vue利用openlayers实现动态轨迹

实现效果

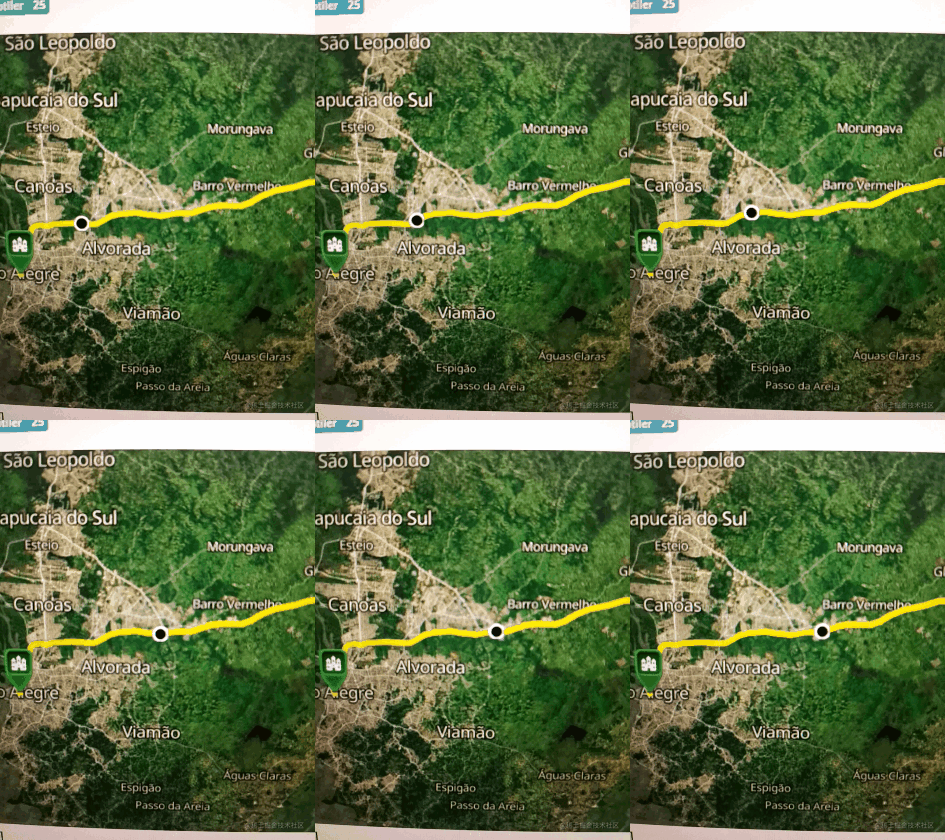
今天介绍一个有趣的gis小功能:动态轨迹播放!效果就像这样:

这效果看着还很丝滑!别急,接下来教你怎么实现。代码示例基于parcel打包工具和es6语法,本文假设你已经掌握相关知识和技巧。

gis初学者可能对openlayers(后面简称ol)不熟悉,这里暂时不介绍ol了,直接上代码,先体验下感觉。

创建一个地图容器

引入地图相关对象

1

2

3

4

import Map from 'ol/Map';

import View from 'ol/View';

import XYZ from 'ol/source/XYZ';

import {Tile as TileLayer, Vector as VectorLayer} from 'ol/layer';

创建地图对象

1

2

3

4

5

6

7

8

9

10

11

12

13

14

15

16

17

18

19

const center = [-5639523.95, -3501274.52];

const map = new Map({

  target: document.getElementById('map'),

  view: new View({

    center: center,

    zoom: 10,

    minZoom: 2,

    maxZoom: 19,

  }),

  layers: [

    new TileLayer({

      source: new XYZ({

        attributions: attributions,

        url: 'https://api.maptiler.com/maps/hybrid/{z}/{x}/{y}.jpg?key=' + key,

        tileSize: 512,

      }),

    }),

  ],

});

创建一条线路

画一条线路

可以用这个geojson网站随意画一条线,然后把数据内容复制下来,保存为json文件格式,作为图层数据添加到地图容器中。

你可以用异步加载的方式,也可以用require方式,这里都介绍下吧:

1

2

3

4

5

6

7

8

// fetch

fetch('data/route.json').then(function (response) {

  response.json().then(function (result) {

    const polyline = result.routes[0].geometry;

  }),

};

// require

var roadData = require('data/route.json')

后面基本一样了,就以fetch为准,现在把线路加载的剩余部分补充完整:

1

2

3

4

5

6

7

8

9

10

11

12

13

14

15

16

17

18

19

20

21

22

23

24

25

26

27

28

29

30

31

32

33

34

35

36

37

38

39

40

41

42

43

44

45

46

47

48

49

50

51

52

53

54

55

56

57

58

59

60

61

62

63

64

65

66

67

68

69

fetch('data/route.json').then(function (response) {

  response.json().then(function (result) {

    const polyline = result.routes[0].geometry;

    // 线路数据坐标系转换

    const route = new Polyline({

      factor: 1e6,

    }).readGeometry(polyline, {

      dataProjection: 'EPSG:4326',

      featureProjection: 'EPSG:3857',

    });

    // 线路图层要素

    const routeFeature = new Feature({

      type: 'route',

      geometry: route,

    });

    // 起点要素

    const startMarker = new Feature({

      type: 'icon',

      geometry: new Point(route.getFirstCoordinate()),

    });

    // 终点要素

    const endMarker = new Feature({

      type: 'icon',

      geometry: new Point(route.getLastCoordinate()),

    });

    // 取起点值

    const position = startMarker.getGeometry().clone();

    // 游标要素

    const geoMarker = new Feature({

      type: 'geoMarker',

      geometry: position,

    });

    // 样式组合

    const styles = {

        // 路线

      'route': new Style({

        stroke: new Stroke({

          width: 6,

          color: [237, 212, 0, 0.8],

        }),

      }),

      'icon': new Style({

        image: new Icon({

          anchor: [0.5, 1],

          src: 'data/icon.png',

        }),

      }),

      'geoMarker': new Style({

        image: new CircleStyle({

          radius: 7,

          fill: new Fill({color: 'black'}),

          stroke: new Stroke({

            color: 'white',

            width: 2,

          }),

        }),

      }),

    };

    // 创建图层并添加以上要素集合

    const vectorLayer = new VectorLayer({

      source: new VectorSource({

        features: [routeFeature, geoMarker, startMarker, endMarker],

      }),

      style: function (feature) {

        return styles[feature.get('type')];

      },

    });

    // 在地图容器中添加图层

    map.addLayer(vectorLayer);

以上代码很完整,我加了注释,整体思路总结如下:

  • 先加载路线数据
  • 构造路线、起始点及游标对应图层要素对象
  • 构造图层并把要素添加进去
  • 在地图容器中添加图层

添加起、终点

这个上面的代码已经包括了,我这里列出来是为了让你更清晰,就是startMarkerendMarker对应的代码。

添加小车

同样的,这里的代码在上面也写过了,就是geoMarker所对应的代码。

准备开车

线路有了,车也有了,现在就到了激动人心的开车时刻了,接下来才是本文最核心的代码!

1

2

3

4

5

6

7

8

9

10

11

12

13

14

15

16

17

18

19

20

21

22

23

24

25

26

27

28

29

30

31

32

33

34

35

36

37

38

39

40

41

42

43

44

45

46

47

48

const speedInput = document.getElementById('speed');

    const startButton = document.getElementById('start-animation');

    let animating = false;

    let distance = 0;

    let lastTime;

    function moveFeature(event) {

      const speed = Number(speedInput.value);

      // 获取当前渲染帧状态时刻

      const time = event.frameState.time;

      // 渲染时刻减去开始播放轨迹的时间

      const elapsedTime = time - lastTime;

      // 求得距离比

      distance = (distance + (speed * elapsedTime) / 1e6) % 2;

      // 刷新上一时刻

      lastTime = time;

      // 反减可实现反向运动,获取坐标点

      const currentCoordinate = route.getCoordinateAt(

        distance > 1 ? 2 - distance : distance

      );

      position.setCoordinates(currentCoordinate);

      // 获取渲染图层的画布

      const vectorContext = getVectorContext(event);

      vectorContext.setStyle(styles.geoMarker);

      vectorContext.drawGeometry(position);

      map.render();

    }

    function startAnimation() {

      animating = true;

      lastTime = Date.now();

      startButton.textContent = 'Stop Animation';

      vectorLayer.on('postrender', moveFeature);

      // 隐藏小车前一刻位置同时触发事件

      geoMarker.setGeometry(null);

    }

    function stopAnimation() {

      animating = false;

      startButton.textContent = '开车了';

      // 将小车固定在当前位置

      geoMarker.setGeometry(position);

      vectorLayer.un('postrender', moveFeature);

    }

    startButton.addEventListener('click', function () {

      if (animating) {

        stopAnimation();

      } else {

        startAnimation();

      }

    });

简单说下它的原理就是利用postrender事件触发一个函数,这个事件本来是地图渲染结束事件,但是它的回调函数中,小车的坐标位置一直在变,那就会不停地触发地图渲染,当然最终也会触发postrender。这样就实现的小车沿着轨迹的动画效果了。这段代码有点难理解,最好自己尝试体验下,比较难理解部分我都加上了注释。

好了,ol动态巡查已经介绍完了,动手试下吧!看你的车能否开起来?

完整代码

index.html

1

2

3

4

5

6

7

8

9

10

11

12

13

14

15

16

17

18

19

20

21

22

23

24

<!DOCTYPE html>

<html lang="en">

  <head>

    <meta charset="UTF-8">

    <title>Marker Animation</title>

    <!-- Pointer events polyfill for old browsers, see https://caniuse.com/#feat=pointer -->

    <script src="https://unpkg.com/elm-pep"></script>

    <style>

      .map {

        width: 100%;

        height:400px;

      }

    </style>

  </head>

  <body>

    <div id="map" class="map"></div>

    <label for="speed">

      speed:

      <input id="speed" type="range" min="10" max="999" step="10" value="60">

    </label>

    <button id="start-animation">Start Animation</button>

    <script src="main.js"></script>

  </body>

</html>

main.js

1

2

3

4

5

6

7

8

9

10

11

12

13

14

15

16

17

18

19

20

21

22

23

24

25

26

27

28

29

30

31

32

33

34

35

36

37

38

39

40

41

42

43

44

45

46

47

48

49

50

51

52

53

54

55

56

57

58

59

60

61

62

63

64

65

66

67

68

69

70

71

72

73

74

75

76

77

78

79

80

81

82

83

84

85

86

87

88

89

90

91

92

93

94

95

96

97

98

99

100

101

102

103

104

105

106

107

108

109

110

111

112

113

114

115

116

117

118

119

120

121

122

123

124

125

126

127

128

129

130

131

132

133

134

135

136

137

138

139

140

141

142

143

144

import 'ol/ol.css';

import Feature from 'ol/Feature';

import Map from 'ol/Map';

import Point from 'ol/geom/Point';

import Polyline from 'ol/format/Polyline';

import VectorSource from 'ol/source/Vector';

import View from 'ol/View';

import XYZ from 'ol/source/XYZ';

import {

  Circle as CircleStyle,

  Fill,

  Icon,

  Stroke,

  Style,

} from 'ol/style';

import {Tile as TileLayer, Vector as VectorLayer} from 'ol/layer';

import {getVectorContext} from 'ol/render';

const key = 'Get your own API key at https://www.maptiler.com/cloud/';

const attributions =

  '<a href="https://www.maptiler.com/copyright/" rel="external nofollow"  target="_blank">&copy; MapTiler</a> ' +

  '<a href="https://www.openstreetmap.org/copyright" rel="external nofollow"  target="_blank">&copy; OpenStreetMap contributors</a>';

const center = [-5639523.95, -3501274.52];

const map = new Map({

  target: document.getElementById('map'),

  view: new View({

    center: center,

    zoom: 10,

    minZoom: 2,

    maxZoom: 19,

  }),

  layers: [

    new TileLayer({

      source: new XYZ({

        attributions: attributions,

        url: 'https://api.maptiler.com/maps/hybrid/{z}/{x}/{y}.jpg?key=' + key,

        tileSize: 512,

      }),

    }),

  ],

});

// The polyline string is read from a JSON similiar to those returned

// by directions APIs such as Openrouteservice and Mapbox.

fetch('data/polyline/route.json').then(function (response) {

  response.json().then(function (result) {

    const polyline = result.routes[0].geometry;

    const route = new Polyline({

      factor: 1e6,

    }).readGeometry(polyline, {

      dataProjection: 'EPSG:4326',

      featureProjection: 'EPSG:3857',

    });

    const routeFeature = new Feature({

      type: 'route',

      geometry: route,

    });

    const startMarker = new Feature({

      type: 'icon',

      geometry: new Point(route.getFirstCoordinate()),

    });

    const endMarker = new Feature({

      type: 'icon',

      geometry: new Point(route.getLastCoordinate()),

    });

    const position = startMarker.getGeometry().clone();

    const geoMarker = new Feature({

      type: 'geoMarker',

      geometry: position,

    });

    const styles = {

      'route': new Style({

        stroke: new Stroke({

          width: 6,

          color: [237, 212, 0, 0.8],

        }),

      }),

      'icon': new Style({

        image: new Icon({

          anchor: [0.5, 1],

          src: 'data/icon.png',

        }),

      }),

      'geoMarker': new Style({

        image: new CircleStyle({

          radius: 7,

          fill: new Fill({color: 'black'}),

          stroke: new Stroke({

            color: 'white',

            width: 2,

          }),

        }),

      }),

    };

    const vectorLayer = new VectorLayer({

      source: new VectorSource({

        features: [routeFeature, geoMarker, startMarker, endMarker],

      }),

      style: function (feature) {

        return styles[feature.get('type')];

      },

    });

    map.addLayer(vectorLayer);

    const speedInput = document.getElementById('speed');

    const startButton = document.getElementById('start-animation');

    let animating = false;

    let distance = 0;

    let lastTime;

    function moveFeature(event) {

      const speed = Number(speedInput.value);

      const time = event.frameState.time;

      const elapsedTime = time - lastTime;

      distance = (distance + (speed * elapsedTime) / 1e6) % 2;

      lastTime = time;

      const currentCoordinate = route.getCoordinateAt(

        distance > 1 ? 2 - distance : distance

      );

      position.setCoordinates(currentCoordinate);

      const vectorContext = getVectorContext(event);

      vectorContext.setStyle(styles.geoMarker);

      vectorContext.drawGeometry(position);

      // tell OpenLayers to continue the postrender animation

      map.render();

    }

    function startAnimation() {

      animating = true;

      lastTime = Date.now();

      startButton.textContent = 'Stop Animation';

      vectorLayer.on('postrender', moveFeature);

      geoMarker.setGeometry(null);

    }

    function stopAnimation() {

      animating = false;

      startButton.textContent = '开车了';

      geoMarker.setGeometry(position);

      vectorLayer.un('postrender', moveFeature);

    }

    startButton.addEventListener('click', function () {

      if (animating) {

        stopAnimation();

      } else {

        startAnimation();

      }

    });

  });

});

package.json

1

2

3

4

5

6

7

8

9

10

11

12

13

{

  "name": "feature-move-animation",

  "dependencies": {

    "ol": "6.9.0"

  },

  "devDependencies": {

    "parcel": "^2.0.0-beta.1"

  },

  "scripts": {

    "start": "parcel index.html",

    "build": "parcel build --public-url . index.html"

  }

}


  • 3
    点赞
  • 8
    收藏
    觉得还不错? 一键收藏
  • 打赏
    打赏
  • 1
    评论
Vue是一种流行的JavaScript框架,用于构建用户界面。OpenLayers是一个开源的JavaScript库,用于在web浏览器中显示交互式地图。结合VueOpenLayers,我们可以实现台风轨迹的可视化。 首先,我们需要获取台风的相关数据。可以从台风数据的API或其他数据源中获取实时或历史台风数据。数据通常包含台风的经纬度坐标和其他相关信息,如风力、风速等。 在Vue组件中,我们可以使用OpenLayers来显示地图。首先,在Vue组件中引入OpenLayers库,并在Vue的生命周期钩子中初始化地图。可以使用OpenLayers的地图视图类(MapView)来设置地图的中心坐标和缩放级别。 接下来,我们需要将台风的轨迹数据添加到地图上。可以使用OpenLayers的矢量图层(Vector Layer)来添加台风轨迹。将每个台风点的经纬度坐标转换为OpenLayers的几何对象,并将其添加到矢量图层中。 为了使台风轨迹更具交互性,可以在每个台风点上添加弹出窗口,显示该点的详细信息。可以使用OpenLayers的弹出窗口类(Overlay)和交互类(Interaction)来实现这一功能。 最后,根据需求,可以添加其他地图元素,如底图切换、比例尺、图例等,以增强用户体验。 总之,使用VueOpenLayers,我们可以方便地将台风轨迹可视化,并提供交互功能。这种方式可以帮助用户更直观地了解台风的路径和特征,从而提高对台风的认知和应对能力。

“相关推荐”对你有帮助么?

  • 非常没帮助
  • 没帮助
  • 一般
  • 有帮助
  • 非常有帮助
提交
评论 1
添加红包

请填写红包祝福语或标题

红包个数最小为10个

红包金额最低5元

当前余额3.43前往充值 >
需支付:10.00
成就一亿技术人!
领取后你会自动成为博主和红包主的粉丝 规则
hope_wisdom
发出的红包

打赏作者

sinat_40572875

你的鼓励将是我创作的最大动力

¥1 ¥2 ¥4 ¥6 ¥10 ¥20
扫码支付:¥1
获取中
扫码支付

您的余额不足,请更换扫码支付或充值

打赏作者

实付
使用余额支付
点击重新获取
扫码支付
钱包余额 0

抵扣说明:

1.余额是钱包充值的虚拟货币,按照1:1的比例进行支付金额的抵扣。
2.余额无法直接购买下载,可以购买VIP、付费专栏及课程。

余额充值