


代码示例(参考网上别人的代码,自己整理的)
package com.pdf.pdfdemo;
import java.io.BufferedReader;
import java.io.BufferedWriter;
import java.io.File;
import java.io.FileWriter;
import java.io.IOException;
import java.io.InputStreamReader;
import java.util.UUID;
public class EchartsTest {
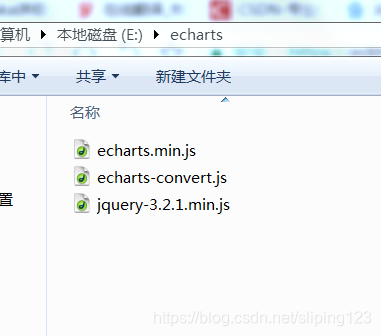
private static final String JSpath = "E:\\echarts\\echarts-convert.js";
public static void main(String[] args) {
//String options = "{\"title\":{\"text\":\"销售图\",\"subtext\":\"销售统计\",\"x\":\"CENTER\"},\"toolbox\": {\"feature\": {\"saveAsImage\": {\"show\": true,}}},\"tooltip\": {\"show\": true},\"legend\": {\"data\":[\"直接访问\",\"邮件营销\",\"联盟广告\",\"视频广告\",\"搜索引擎\"]}, \"series\":[{\"name\":\"访问来源\",\"type\":\"pie\",\"radius\": '55%',\"center\": ['50%', '60%'],\"data\":[{\"value\":335, \"name\":\"直接访问\"},{\"value\":310, \"name\":\"邮件营销\"},{\"value\":234, \"name\":\"联盟广告\"},{\"value\":135, \"name\":\"视频广告\"},{\"value\":1548, \"name\":\"搜索引擎\"}]}]}";
String options=" {\n" +
" title: {\n" +
" text: '基础雷达图'\n" +
" },\n" +
" tooltip: {},\n" +
" legend: {\n" +
" data: ['预算分配(Allocated Budget)', '实际开销(Actual Spending)']\n" +
" },\n" +
" radar: {\n" +
" // shape: 'circle',\n" +
" name: {\n" +
" textStyle: {\n" +
" color: '#fff',\n" +
" backgroundColor: '#999',\n" +
" borderRadius: 3,\n" +
" padding: [3, 5]\n" +
" }\n" +
" },\n" +
" indicator: [\n" +
" { name: '销售(sales)', max: 6500},\n" +
" { name: '管理(Administration)', max: 16000},\n" +
" { name: '信息技术(Information Techology)', max: 30000},\n" +
" { name: '客服(Customer Support)', max: 38000},\n" +
" { name: '研发(Development)', max: 52000},\n" +
" { name: '市场(Marketing)', max: 25000}\n" +
" ]\n" +
" },\n" +
" series: [{\n" +
" name: '预算 vs 开销(Budget vs spending)',\n" +
" type: 'radar',\n" +
" // areaStyle: {normal: {}},\n" +
" data: [\n" +
" {\n" +
" value: [4300, 10000, 28000, 35000, 50000, 19000],\n" +
" name: '预算分配(Allocated Budget)'\n" +
" },\n" +
" {\n" +
" value: [5000, 14000, 28000, 31000, 42000, 21000],\n" +
" name: '实际开销(Actual Spending)'\n" +
" }\n" +
" ]\n" +
" }]\n" +
"}";
System.out.println(options.trim());
String picPath = generateEChart(options);
}
/*
* 主程序
*/
public static String generateEChart(String options) {
String dataPath = writeFile(options);
String fileName= UUID.randomUUID().toString() + ".png";
String path = "D:/temp/Echart/" +fileName;
try {
File file = new File(path); //文件路径
if (!file.exists()) {
File dir = new File(file.getParent());
dir.mkdirs();
file.createNewFile();
}
String cmd = "phantomjs " + JSpath + " -infile " + dataPath + " -outfile " + path;//生成命令行
Process process = Runtime.getRuntime().exec(cmd);
BufferedReader input = new BufferedReader(new InputStreamReader(process.getInputStream()));
String line = "";
while ((line = input.readLine()) != null) {
}
input.close();
} catch (IOException e) {
e.printStackTrace();
}finally{
}
return path;
}
/*
*
* options生成文件存储
*/
public static String writeFile(String options) {
String dataPath="D:\\chartData\\data"+ UUID.randomUUID().toString().substring(0, 8) +".json";
try {
/* option写入文本文件 用于执行命令*/
File writename = new File(dataPath);
if (!writename.exists()) {
File dir = new File(writename.getParent());
dir.mkdirs();
writename.createNewFile(); //
}
BufferedWriter out = new BufferedWriter(new FileWriter(writename));
out.write(options);
out.flush(); // 把缓存区内容压入文件
out.close(); // 最后关闭文件
} catch (IOException e) {
e.printStackTrace();
}
return dataPath;
}
}
需要下载 phantomjs-2.1.1-windows
从百度 https://www.echartsjs.com/examples/zh/editor.html?c=radar
官网靠出ercharts 图 options 对象
echarts-converts.js为画图核心js,里面引用了min.js和jquery


 859
859


 被折叠的 条评论
为什么被折叠?
被折叠的 条评论
为什么被折叠?
 到【灌水乐园】发言


