import numpy as np
import matplotlib.pyplot as plt
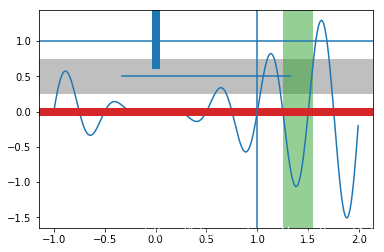
t = np.arange(-1, 2, .01)
s = np.sin(4 * np.pi * t)*np.log(t*t+1)
plt.plot(t, s)
# Draw a thick red hline at y=0 that spans the xrange 在y=0处绘制一条横跨xrange的红色粗线。
plt.axhline(linewidth=8, color='#d62728') #RGB、RGBA十六进制形式字符串( color = '#1f77b4'blue )
# Draw a default hline at y=1 that spans the xrange #default hline 默认的水平线
plt.axhline(y=1)
# Draw a default vline at x=1 that spans the yrange
plt.axvline(x=1)
# Draw a thick blue vline at x=0 that spans the upper quadrant of the yrange 在x=0处绘制一条横跨yRange上象限的蓝色粗垂直线。
plt.axvline(x=0, ymin=0.75, linewidth=8, color='#1f77b4')
# Draw a default hline at y=.5 that spans the middle half of the axes 在Y=0.5处绘制一个横跨轴中间半部分的默认hline。
plt.axhline(y=.5, xmin=0.25, xmax=0.75)
plt.axhspan(0.25, 0.75, facecolor='0.5', alpha=0.5) #水平带
plt.axvspan(1.25, 1.55, facecolor='#2ca02c', alpha=0.5) #垂直带
plt.show()
plt.show()


 被折叠的 条评论
为什么被折叠?
被折叠的 条评论
为什么被折叠?
 到【灌水乐园】发言


