| 
A live demo is available for this Tutorial. Click here to view it online
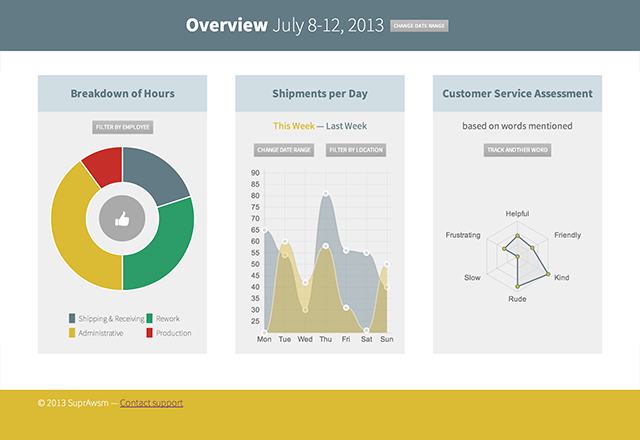
Today we will be creating a dynamic dashboard with live charts, through the power of ChartJS. ChartJS is a powerful, dependency free JavaScript library which builds graphs via the canvas element. Best of all, it's easy for designers to get up and running. We'll be focusing on the pieces of the library that get you up and running with beautiful and functional charts fast. We will build a mobile-friendly dashboard from start to finish.
| 译者信息
在线演示请点击这里。
今天我们将会用ChartJS来创建一个动态仪表盘。ChartJS是一个强大、无依赖的JavaScript库,通过canvas元素来创建图表。最重要的是设计人员可以自己轻松的创建和运行图表。我们将会专注于库中能够让你快速创建美观、功能强大的图表的部分,从头到尾创建一个移动友好的动态仪表盘。
|
Getting Started We're going to build our dashboard on top of HTML5 Boilerplate. Download the zip file, or clone the repository via Git. We're going to name our project directory "chartjs_dashboard", and drop all of the files directly there.
2 | git clone git@github.com:h5bp/html5-boilerplate.git chartjs_dashboard |
Next, we'll grab ChartJS. Go to the uminified version at raw.github.com/nnnick/Chart.js/master/Chart.js, and copy the contents into your js/plugins.js file. Having the unminified version will make errors more readable if you run into them.
Tip: in production, you would use the minified version of the JavaScript, to make the dashboard more performant.
Your file structure should look like this:
13 | │ ├── jquery-1.10.1.min.js |
14 | │ └── modernizr-2.6.2.min.js |
Note: this does not include some of the files included in H5BP that we won't be using. | 译者信息 开始 我们将用HTML5 Boilerplate模版项目来创建一个仪表盘。从github上直接将这个项目迁至chartjs_dashboard文件夹下:
2 | git clone git@github.com:h5bp/html5-boilerplate.git chartjs_dashboard |
然后,我们需要去下载ChatJS。从raw.github.com/nnnick/Chart.js/master/Chart.js 下载没有压缩过的Chart.js, 将文件中的内容拷贝到 js/plugins.js中。如果你用了压缩版本的chart.js,由于可读性不高将会产生很多错误。
建议: 产品发布时你应该用压缩版本的Chart.js,这样仪表盘的性能将会更好。
项目文件结构如下:
13 | │ ├── jquery-1.10.1.min.js |
14 | │ └── modernizr-2.6.2.min.js |
注意: 这里的文件结构没有将H5BP中没有用到的文件包含进来。 |
Color Palette Before we get into the coding of the site, let's start by setting up a color palette that we will use throughout the design. By doing this, we can establish a future "style guide" of sorts; this is a common practice for basically any given design. If you are building the dashboard with a particular brand in mind, start by using the brand's colors. Today, we will define two main colors and two ancillary colors. We will also use shades or faded out versions of these colors.
- dark blue:#637b85
- green:#2c9c69
- yellow:#dbba34
- red:#c62f29
We will also use a lighter shade of the dark blue,#d0dde3. Lastly, we will be utilizing grayscale colors.
| 译者信息 调色板 在我们编写网站代码之前,我们先做一个调色板,这个调色板将贯穿后面整个设计之中。为了实现这个目标,我们可以建立一个如“风格向导”的东西,这个“向导”可以应用在任何设计之中。如果你想基于某种品牌来创建仪表盘,那咱就用这个品牌的颜色作为仪表盘的颜色。现在,我将定义两种主要颜色和两种辅助颜色,也许会用到比这些颜色深些或是浅些的颜色:
- 蓝黑:#637b85
- 绿色:#2c9c69
- 黄色:#dbba34
- 红色:#c62f29
我们也会用到深蓝或浅蓝,#d0dde3.最后我们也会用到灰度颜色。 |
ChartJS Basics ChartJS uses the canvas element. The canvas element provides a JavaScript-only interface to draw pixels to a given rectangle area. It is often compared to SVG, which offers a DOM node based solution to creating vector graphics in the browser. However, pixels drawn to the canvas element are not kept in memory and thus don't respond to JavaScript events. But enough with the tech talk - how do we get started quickly with ChartJS? Luckily, the ChartJS homepage has plenty of examples to get us started quickly. The basic pattern is to create the canvas element in HTML, select it with JavaScript, and create the Chart while passing in the data the chart is built from.
1 | <canvas id="something"></canvas> |
3 | var canvas = document.getElementById("something"); |
4 | var ctx = canvas.getContext("2d"); |
5 | new Chart(ctx).Line(data, options); |
The above example would assume that you had defined `data` and `options` as objects, and would produce a line graph accordingly. In our example, we will use the Doughnut graph, the Line graph, and the Radar graph. These graphs will represent different business-oriented metrics, but of course you can take this and adapt it to your needs. | 译者信息 ChartJS 基础 ChatJS 用的是canvas(HTML5,译者注)元素.Canvas提供的是JavaScript接口,并能在指定的矩形区域来画像素。人们经常拿它和SVG(另一种矢量图形标准,译者注),SVG在浏览器中以DOM节点的形式来创建矢量图形的。但是,用canvas画的图不会留在内存中,而且也不会响应JavaScript事件。
废话少说,那怎样用CharJS来快速画图呢?很幸运,CharJS主页有很多例子。创建canvas基本的形式是用JavaScript创建,并在创建时传入要画图的数据。
1 | <canvas id="something"></canvas> |
3 | var canvas = document.getElementById("something"); |
4 | var ctx = canvas.getContext("2d"); |
5 | new Chart(ctx).Line(data, options); |
上面的例子是假设你已经定义了‘data’和‘option’对象了,并最终创建了一条线。在我们的例子中,我们将用到圆环圈图,线条和雷达图。这些图代表不同的商业指标,但你可以根据你的需要进行改变 |
Page Markup Let's start by defining some basic HTML for the layout of our page.
03 | <div class="container clearfix"> |
04 | <h1>Overview <span>July 8-12, 2013</span><a class="button">Change Date Range</a></h1> |
07 | <div class="container clearfix"> |
08 | <div class="third widget doughnut"> |
09 | <h3>Breakdown of Hours</h3> |
10 | <div class="canvas-container"> |
11 | <canvas id="hours"></canvas> |
14 | <div class="third widget line"> |
15 | <div class="chart-legend"> |
16 | <h3>Shipments per Day</h3> |
18 | <div class="canvas-container"> |
19 | <canvas id="shipments"></canvas> |
22 | <div class="third widget"> |
23 | <div class="chart-legend"> |
24 | <h3>Customer Service Assessment</h3> |
26 | <div class="canvas-container"> |
27 | <canvas id="departments"></canvas> |
31 | <div class="push"></div> |
Here, we can see that we have a basic header, middle, and footer section. We are using the .wrapper class and .push class to create a sticky footer (see here for more info). We will be creating our layout to be mobile friendly first, and to scale up from there. There are a few tricks we will pull along the way, but this structure will do a lot of the work for us. | 译者信息 页面标记 咱一起先为我们的页面布局定义一些基本的HTML:
03 | <div class="container clearfix"> |
04 | <h1>Overview <span>July 8-12, 2013</span><a class="button">Change Date Range</a></h1> |
07 | <div class="container clearfix"> |
08 | <div class="third widget doughnut"> |
09 | <h3>Breakdown of Hours</h3> |
10 | <div class="canvas-container"> |
11 | <canvas id="hours"></canvas> |
14 | <div class="third widget line"> |
15 | <div class="chart-legend"> |
16 | <h3>Shipments per Day</h3> |
18 | <div class="canvas-container"> |
19 | <canvas id="shipments"></canvas> |
22 | <div class="third widget"> |
23 | <div class="chart-legend"> |
24 | <h3>Customer Service Assessment</h3> |
26 | <div class="canvas-container"> |
27 | <canvas id="departments"></canvas> |
31 | <div class="push"></div> |
这里,我们有基本的头部,内容和页脚部分。我们用.wrapper和.push类来创建粘性页脚(粘性页脚相关信息)。我们先创建支持移动设备的布局,然后在向上扩展。也许以这种方式会碰到很多陷阱,但这种结构会给我们很大帮助的。 |
Before We Go Too Far... Note that canvas doesnt play extremely well with media queries. For this tutorial, we will be creating a workaround to allow the charts to be redrawn at different sizes in the JavaScript. Inside our main.js file, we will need to have a sizing function that is triggered by a window resize. We will also need a "redraw" function to fire after the resizing function fires. Finally, when we redraw the charts, we don't want them to animate in, as if this is the first time they are being drawn.
06 | function size(animate){ |
12 | t = setTimeout(function(){ |
13 | $("canvas").each(function(i,el){ |
17 | "width":$(el).parent().width(), |
18 | "height":$(el).parent().outerHeight() |
27 | $(".widget").height(""); |
28 | $(".widget").each(function(i,el){ m = Math.max(m,$(el).height()); }); |
29 | $(".widget").height(m); |
33 | $(window).on('resize', size); |
34 | function redraw(animation){ |
37 | options.animation = false; |
39 | options.animation = true; |
If this seems a little daunting, don't worry! Ask a question in the comments, and we and the Tuts+ community will help you understand fully! | 译者信息 热个身先 Canvas在媒体库方面做的不是很好。下面的指南将会创建一个工作区,这个工作区将允许charts用JavaScript在不同窗口大小下重绘。
在我们的main.js文件里,我们需要有一个设置大小的函数,这个函数是在窗口大小变化时触发的,同时在大小改变后我们需要调用“重绘”函数,最终将重绘charts,但我们不让它有动态效果,让它保持第一次绘制时的样子。
06 | function size(animate){ |
13 | t = setTimeout(function(){ |
14 | $("canvas").each(function(i,el){ |
18 | "width":$(el).parent().width(), |
19 | "height":$(el).parent().outerHeight() |
29 | $(".widget").height(""); |
30 | $(".widget").each(function(i,el){ m = Math.max(m,$(el).height()); }); |
31 | $(".widget").height(m); |
35 | $(window).on('resize', size); |
36 | function redraw(animation){ |
39 | options.animation = false; |
41 | options.animation = true; |
这看起来很难吧!去Tuts+社区交流交流会帮助你加深理解的。 |
Some CSS to Get Us Started We want to set up some basic CSS structures to get us started. HTML5 Boilerplate of course includes normalize and some other defaults that you can change, but for the sake of the tutorial, we will write our CSS after the line "Author's custom styles".
05 | font-family: 'Source Sans Pro', sans-serif; |
11 | text-decoration: none; |
14 | text-transform: uppercase; |
15 | display: inline-block; |
21 | box-shadow: 0 0 2px rgba(0,0,0,0.1); |
22 | background: rgb(190,190,190); |
23 | background: -moz-linear-gradient(top, rgba(190,190,190,1) 0%, rgba(170,170,170,1) 100%); |
24 | background: -webkit-gradient(linear, left top, left bottom, color-stop(0%,rgba(190,190,190,1)), color-stop(100%,rgba(170,170,170,1))); |
25 | background: -webkit-linear-gradient(top, rgba(190,190,190,1) 0%,rgba(170,170,170,1) 100%); |
26 | background: -o-linear-gradient(top, rgba(190,190,190,1) 0%,rgba(170,170,170,1) 100%); |
27 | background: -ms-linear-gradient(top, rgba(190,190,190,1) 0%,rgba(170,170,170,1) 100%); |
28 | background: linear-gradient(to bottom, rgba(190,190,190,1) 0%,rgba(170,170,170,1) 100%); |
29 | filter: progid:DXImageTransform.Microsoft.gradient( startColorstr='#bebebe', endColorstr='#aaaaaa',GradientType=0 ); |
65 | -webkit-box-sizing: border-box; |
66 | -moz-box-sizing: border-box; |
67 | box-sizing: border-box; |
Here, we define the necessary CSS for the sticky footer, as well as a button class, a self-centering container class, a class for containing our canvas elements inside of our widgets, and our widgets themselves. We will also need to add the Google font we are defining for the body by including this in our head tag.
1 | <link href='http://fonts.googleapis.com/css?family=Source+Sans+Pro:200,400,700' rel='stylesheet' type='text/css'> |
| 译者信息 CSS准备 我们也讲讲一些CSS结构的知识吧。HTML5模板文件包含了一些普通的和一些用户可以改变的例子,但是为了我们的指南,我们将在“作者自定义风格”后写写我们自己的CSS。
05 | font-family: 'Source Sans Pro', sans-serif; |
11 | text-decoration: none; |
14 | text-transform: uppercase; |
15 | display: inline-block; |
21 | box-shadow: 0 0 2px rgba(0,0,0,0.1); |
22 | background: rgb(190,190,190); |
23 | background: -moz-linear-gradient(top, rgba(190,190,190,1) 0%, rgba(170,170,170,1) 100%); |
24 | background: -webkit-gradient(linear, left top, left bottom, color-stop(0%,rgba(190,190,190,1)), color-stop(100%,rgba(170,170,170,1))); |
25 | background: -webkit-linear-gradient(top, rgba(190,190,190,1) 0%,rgba(170,170,170,1) 100%); |
26 | background: -o-linear-gradient(top, rgba(190,190,190,1) 0%,rgba(170,170,170,1) 100%); |
27 | background: -ms-linear-gradient(top, rgba(190,190,190,1) 0%,rgba(170,170,170,1) 100%); |
28 | background: linear-gradient(to bottom, rgba(190,190,190,1) 0%,rgba(170,170,170,1) 100%); |
29 | filter: progid:DXImageTransform.Microsoft.gradient( startColorstr='#bebebe', endColorstr='#aaaaaa',GradientType=0 ); |
65 | -webkit-box-sizing: border-box; |
66 | -moz-box-sizing: border-box; |
67 | box-sizing: border-box; |
这里,我们定义了有关粘性页脚所必需的CSS,包括一个按钮的类,一个自居中的类,一个包含canvas元素组件的类,以及我们组件自己用的类。我们在boby里的head标签里定义来添加Google字体。
1 | <link href='http://fonts.googleapis.com/css?family=Source+Sans+Pro:200,400,700' rel='stylesheet' type='text/css'> |
|
The Doughnut Graph Doughnut graphs are a lot like pie graphs, except they have part of the middle cut out. By default, ChartJS defines that 50% of the area of the graph should be left out; we will stay with this default. The code to create the doughnut graph is shown below.
20 | var canvas = document.getElementById("hours"); |
21 | var ctx = canvas.getContext("2d"); |
22 | new Chart(ctx).Doughnut(data); |
Here, you can see that we have defined our doughnut graph's data and colors. This is all that is needed to make the doughnut graph work. However, what are each of the sections representing? Unfortunately, ChartJS does not yet have an easy way to define labels for the doughnut graph; however, we can make our own legend to describe each of the different sections. Modify the doughnut widget's html to include the following.
01 | <div class="third widget doughnut"> |
02 | <h3>Breakdown of Hours</h3> |
03 | <p><a href="" class="button">Filter By Employee</a></p> |
04 | <div class="canvas-container"> |
05 | <canvas id="hours"></canvas> |
06 | <span class="status"></span> |
08 | <div class="chart-legend"> |
10 | <li class="ship">Shipping & Receiving</li> |
11 | <li class="rework">Rework</li> |
12 | <li class="admin">Administrative</li> |
13 | <li class="prod">Production</li> |
| 译者信息 圆环圈图 圆环圈图很像馅饼圈图,除过中间被剪掉了。默认情况下,ChartJS定义将忽略50%的区域;我们保持这个默认值。下面是创建圆圈环图的代码。
20 | var canvas = document.getElementById("hours"); |
21 | var ctx = canvas.getContext("2d"); |
22 | new Chart(ctx).Doughnut(data); |
这里你可以看到我们定义了圆环圈图的数据和颜色。这是创建圆圈环图所必需的。然而,到底哪些部分需要重复呢?不幸的是,ChartJS没有简单定义标签的方式,我们只能靠我们自己用图示的方式来描述每一个部分。修改圆环圈组件的html如下:
01 | <div class="third widget doughnut"> |
02 | <h3>Breakdown of Hours</h3> |
03 | <p><a href="" class="button">Filter By Employee</a></p> |
04 | <div class="canvas-container"> |
05 | <canvas id="hours"></canvas> |
06 | <span class="status"></span> |
08 | <div class="chart-legend"> |
10 | <li class="ship">Shipping & Receiving</li> |
11 | <li class="rework">Rework</li> |
12 | <li class="admin">Administrative</li> |
13 | <li class="prod">Production</li> |
|
We use these li's by their classes very simply in the CSS, by leveraging the `:before` pseudo-class.
16 | .chart-legend li:before { |
25 | .ship:before { background-color: #637b85; } |
26 | .rework:before { background-color: #2c9c69; } |
27 | .admin:before { background-color: #dbba34; } |
28 | .prod:before { background-color: #c62f29; } |
Next, we want to have a nice "thumbs-up" in the center of the doughnut. This involves some CSS trickery, including a version of Uncle Dave's Ol' Padded Box to get the circle to be responsive. We will use the span with the class of .status to achieve this circle. Add the following rules to main.css:
01 | .widget.doughnut .status { |
17 | background-color: #aaa; |
18 | background-image: url(data:image/png;base64,iVBORw0KGgoAAAANSUhEUgAAAF8AAABkCAQAAABK+CQQAAAACXBIWXMAAFKnAABSpwHUSB+cAAADGGlDQ1BQaG90b3Nob3AgSUNDIHByb2ZpbGUAAHjaY2BgnuDo4uTKJMDAUFBUUuQe5BgZERmlwH6egY2BmYGBgYGBITG5uMAxIMCHgYGBIS8/L5UBFTAyMHy7xsDIwMDAcFnX0cXJlYE0wJpcUFTCwMBwgIGBwSgltTiZgYHhCwMDQ3p5SUEJAwNjDAMDg0hSdkEJAwNjAQMDg0h2SJAzAwNjCwMDE09JakUJAwMDg3N+QWVRZnpGiYKhpaWlgmNKflKqQnBlcUlqbrGCZ15yflFBflFiSWoKAwMD1A4GBgYGXpf8EgX3xMw8BSMDVQYqg4jIKAUICxE+CDEESC4tKoMHJQODAIMCgwGDA0MAQyJDPcMChqMMbxjFGV0YSxlXMN5jEmMKYprAdIFZmDmSeSHzGxZLlg6WW6x6rK2s99gs2aaxfWMPZ9/NocTRxfGFM5HzApcj1xZuTe4FPFI8U3mFeCfxCfNN45fhXyygI7BD0FXwilCq0A/hXhEVkb2i4aJfxCaJG4lfkaiQlJM8JpUvLS19QqZMVl32llyfvIv8H4WtioVKekpvldeqFKiaqP5UO6jepRGqqaT5QeuA9iSdVF0rPUG9V/pHDBYY1hrFGNuayJsym740u2C+02KJ5QSrOutcmzjbQDtXe2sHY0cdJzVnJRcFV3k3BXdlD3VPXS8Tbxsfd99gvwT//ID6wIlBS4N3hVwMfRnOFCEXaRUVEV0RMzN2T9yDBLZE3aSw5IaUNak30zkyLDIzs+ZmX8xlz7PPryjYVPiuWLskq3RV2ZsK/cqSql01jLVedVPrHzbqNdU0n22VaytsP9op3VXUfbpXta+x/+5Em0mzJ/+dGj/t8AyNmf2zvs9JmHt6vvmCpYtEFrcu+bYsc/m9lSGrTq9xWbtvveWGbZtMNm/ZarJt+w6rnft3u+45uy9s/4ODOYd+Hmk/Jn58xUnrU+fOJJ/9dX7SRe1LR68kXv13fc5Nm1t379TfU75/4mHeY7En+59lvhB5efB1/lv5dxc+NH0y/fzq64Lv4T8Ffp360/rP8f9/AA0ADzT6lvFdAAAAIGNIUk0AAHolAACAgwAA+f8AAIDpAAB1MAAA6mAAADqYAAAXb5JfxUYAAAUYSURBVHja1JxdTBxVFMd/O7vssgvLtxIQKrSVQluNiqVp0xAepKSpiaFKVEyMD2oQNGisifFJ06TRN2xjS2Js0geNHy9am5q0wRhNLNZUwI9aQmtDMbUtSFsKLOyye3xgl8KyHwM7uzv3vwkk99yZ+TF759xzzz0DQko/z8kl8ckt+U26pEEciZ4vtfAu6ZE7GpUjcr9K+EUyIEs1JC2irf6MGqmUi5ywlvUcpnX1J0wtvhvXsrZC3qNeDfwcnBFa7+FtclXAz8cRsb2BJhXwS7FHbHfwJBnmx6+IatlCmdnxtRj4JdSYHd9JeVSbg01mx8+jJIbV9INnDcUxrMWrYUkl/kbcMawOs+PXYYlhtZh78BRSG9M+S8DM+JupimkfNTd+U8yRD1fMPHhK2B3TPsegmfEfizMtjZsZv5QXscbscZ5hs+JrtPFInD6nuG1W/D10xPHqY5xc5bmTvjx/VIYlnj4VuxkzDZo0y99x4SekyYyJEqd0yqjE15fiNB9+kXwoHh3wt2Sn+dJUZfKF+EWSe++ThV8sX4s+JTDuk4VvlwOiV8fElci1kuH3G3leZ88ZjjKd2Ixo/IL8hTix5R2d5btEJ3SjVUuD7r5fccNc+BZayNPZ9wrfJh5OGavKOHH9Yp1hyGz4u1mru+9PeM2Fn0eL7oyBl3NGxOJGakecbMJSpzlmLnw7z0bYPYkmG5mJX9JmIP4Wdq6gt4smJsnEjg0NKxpa8LeFAH4C+PExwwyzeLjNNB68SJijE6PgrRzipRUdMctsENoS/BD8GYplAvjxM8csk9xknBEG+J4/F2WEDIt06uSapEL/yFuSbXTIZpNuSZW8clDcxuLv0LWuMko+2T+/OjbG82TSTlEKc9U2XuUp48Z+s9yWVOu8bDDm7hfzBtmkWht4BZtmwMTXznbSoSfYmrjfb+QT7iI96k4Uv5LPqCNdupQYfj6HeJr0yWsLBlsFOCKGuoKHceaihMf7aSGdGrQI1NHJwxFLVQCm6KWL35e1V7CPZ+Jk7ZOr/2hH6mUwro/tk5qFHE65VMhmeVn6JCDplF/eFStyUlfnriD+JumXYbkuc5JuHZcCwcY2XV/UVnKYAOysIZ/06yr7GAdN53zpWigkEsygs/StZLFowVxyz5eVaaipB+cnS1Xxc+ggS1182MUelfEz6aRCXXx4iHaV8TVaVcaHTJXx/RxVGf8b3lcX/2fe5Lqq+Bd5jQuq+n0P79CrbtAwwPGQ71Tz7ntVxl8bKuZWE788tPWtJr7G4/M7Y6o6zu08oDJ+IbtUxodtZKqM78KqMv6PTKmL388Rdcf+ZfZyUVX8ETroUXXaGqYtFLCphz9KJycWT79qqZtjS6MHlTRNz9IMt1r4PqbCYze1ZFEZXwvfClQLX8L3dtTCH+Wayvifh7/dpen+2qI8PClUDweXD55JXYdOBVMTPm7iTwv8r7zO1fBGG6dp1HHwGSYAGKKZKqqpYT1lFET5txHG6xfaIhQmYJF6PorzJi3008pfS1qsuCmmgmpqqOJe7iYracMqwAn2Rn4lM1SSURu1JHeK03wQ6S9feBacFFHOfWykmkpKyDW0NneMwxyIVu88X89jpwA7lmU75haEmagFMcuVQR6lrKOaGtZRSBZOHGRgW6iOXYmP9/AvP/AxvdGfNkuS9vituMnBTS755JNHAfnkkUM22WSThQM7GWSQgQ0IIAQQfMwwzQ3GGOEC5/iDy/hiXeb/AQDtquZeJxF4YgAAAABJRU5ErkJggg==); |
19 | background-repeat: no-repeat; |
21 | background-position: center; |
Perhaps the most glaring element standing out here is the use of the data URI for the background image. This allows us to avoid an extra HTTP request, and is syntactically synonymous with using an actual http url. We are also setting this element to be positioned absolutely inside its .widget element, which we previously set to be position relative. | 译者信息 我们用简单的CSS类样式和:before伪类来渲染li元素。
16 | .chart-legend li:before { |
25 | .ship:before { background-color: #637b85; } |
26 | .rework:before { background-color: #2c9c69; } |
27 | .admin:before { background-color: #dbba34; } |
28 | .prod:before { background-color: #c62f29; } |
接下来,我想在馅饼圈图中间放一个“竖起的大拇指”。这里将会使用到一些比如使用 Uncle Dave's Ol' Padded Box来使圆圈响应的CSS技巧,我们将会用.status类样式渲染span来实现,main.css样式如下:
01 | .widget.doughnut .status { |
17 | background-color: #aaa; |
18 | background-image: url(data:image/png;base64,iVBORw0KGgoAAAANSUhEUgAAAF8AAABkCAQAAABK+CQQAAAACXBIWXMAAFKnAABSpwHUSB+cAAADGGlDQ1BQaG90b3Nob3AgSUNDIHByb2ZpbGUAAHjaY2BgnuDo4uTKJMDAUFBUUuQe5BgZERmlwH6egY2BmYGBgYGBITG5uMAxIMCHgYGBIS8/L5UBFTAyMHy7xsDIwMDAcFnX0cXJlYE0wJpcUFTCwMBwgIGBwSgltTiZgYHhCwMDQ3p5SUEJAwNjDAMDg0hSdkEJAwNjAQMDg0h2SJAzAwNjCwMDE09JakUJAwMDg3N+QWVRZnpGiYKhpaWlgmNKflKqQnBlcUlqbrGCZ15yflFBflFiSWoKAwMD1A4GBgYGXpf8EgX3xMw8BSMDVQYqg4jIKAUICxE+CDEESC4tKoMHJQODAIMCgwGDA0MAQyJDPcMChqMMbxjFGV0YSxlXMN5jEmMKYprAdIFZmDmSeSHzGxZLlg6WW6x6rK2s99gs2aaxfWMPZ9/NocTRxfGFM5HzApcj1xZuTe4FPFI8U3mFeCfxCfNN45fhXyygI7BD0FXwilCq0A/hXhEVkb2i4aJfxCaJG4lfkaiQlJM8JpUvLS19QqZMVl32llyfvIv8H4WtioVKekpvldeqFKiaqP5UO6jepRGqqaT5QeuA9iSdVF0rPUG9V/pHDBYY1hrFGNuayJsym740u2C+02KJ5QSrOutcmzjbQDtXe2sHY0cdJzVnJRcFV3k3BXdlD3VPXS8Tbxsfd99gvwT//ID6wIlBS4N3hVwMfRnOFCEXaRUVEV0RMzN2T9yDBLZE3aSw5IaUNak30zkyLDIzs+ZmX8xlz7PPryjYVPiuWLskq3RV2ZsK/cqSql01jLVedVPrHzbqNdU0n22VaytsP9op3VXUfbpXta+x/+5Em0mzJ/+dGj/t8AyNmf2zvs9JmHt6vvmCpYtEFrcu+bYsc/m9lSGrTq9xWbtvveWGbZtMNm/ZarJt+w6rnft3u+45uy9s/4ODOYd+Hmk/Jn58xUnrU+fOJJ/9dX7SRe1LR68kXv13fc5Nm1t379TfU75/4mHeY7En+59lvhB5efB1/lv5dxc+NH0y/fzq64Lv4T8Ffp360/rP8f9/AA0ADzT6lvFdAAAAIGNIUk0AAHolAACAgwAA+f8AAIDpAAB1MAAA6mAAADqYAAAXb5JfxUYAAAUYSURBVHja1JxdTBxVFMd/O7vssgvLtxIQKrSVQluNiqVp0xAepKSpiaFKVEyMD2oQNGisifFJ06TRN2xjS2Js0geNHy9am5q0wRhNLNZUwI9aQmtDMbUtSFsKLOyye3xgl8KyHwM7uzv3vwkk99yZ+TF759xzzz0DQko/z8kl8ckt+U26pEEciZ4vtfAu6ZE7GpUjcr9K+EUyIEs1JC2irf6MGqmUi5ywlvUcpnX1J0wtvhvXsrZC3qNeDfwcnBFa7+FtclXAz8cRsb2BJhXwS7FHbHfwJBnmx6+IatlCmdnxtRj4JdSYHd9JeVSbg01mx8+jJIbV9INnDcUxrMWrYUkl/kbcMawOs+PXYYlhtZh78BRSG9M+S8DM+JupimkfNTd+U8yRD1fMPHhK2B3TPsegmfEfizMtjZsZv5QXscbscZ5hs+JrtPFInD6nuG1W/D10xPHqY5xc5bmTvjx/VIYlnj4VuxkzDZo0y99x4SekyYyJEqd0yqjE15fiNB9+kXwoHh3wt2Sn+dJUZfKF+EWSe++ThV8sX4s+JTDuk4VvlwOiV8fElci1kuH3G3leZ88ZjjKd2Ixo/IL8hTix5R2d5btEJ3SjVUuD7r5fccNc+BZayNPZ9wrfJh5OGavKOHH9Yp1hyGz4u1mru+9PeM2Fn0eL7oyBl3NGxOJGakecbMJSpzlmLnw7z0bYPYkmG5mJX9JmIP4Wdq6gt4smJsnEjg0NKxpa8LeFAH4C+PExwwyzeLjNNB68SJijE6PgrRzipRUdMctsENoS/BD8GYplAvjxM8csk9xknBEG+J4/F2WEDIt06uSapEL/yFuSbXTIZpNuSZW8clDcxuLv0LWuMko+2T+/OjbG82TSTlEKc9U2XuUp48Z+s9yWVOu8bDDm7hfzBtmkWht4BZtmwMTXznbSoSfYmrjfb+QT7iI96k4Uv5LPqCNdupQYfj6HeJr0yWsLBlsFOCKGuoKHceaihMf7aSGdGrQI1NHJwxFLVQCm6KWL35e1V7CPZ+Jk7ZOr/2hH6mUwro/tk5qFHE65VMhmeVn6JCDplF/eFStyUlfnriD+JumXYbkuc5JuHZcCwcY2XV/UVnKYAOysIZ/06yr7GAdN53zpWigkEsygs/StZLFowVxyz5eVaaipB+cnS1Xxc+ggS1182MUelfEz6aRCXXx4iHaV8TVaVcaHTJXx/RxVGf8b3lcX/2fe5Lqq+Bd5jQuq+n0P79CrbtAwwPGQ71Tz7ntVxl8bKuZWE788tPWtJr7G4/M7Y6o6zu08oDJ+IbtUxodtZKqM78KqMv6PTKmL388Rdcf+ZfZyUVX8ETroUXXaGqYtFLCphz9KJycWT79qqZtjS6MHlTRNz9IMt1r4PqbCYze1ZFEZXwvfClQLX8L3dtTCH+Wayvifh7/dpen+2qI8PClUDweXD55JXYdOBVMTPm7iTwv8r7zO1fBGG6dp1HHwGSYAGKKZKqqpYT1lFET5txHG6xfaIhQmYJF6PorzJi3008pfS1qsuCmmgmpqqOJe7iYracMqwAn2Rn4lM1SSURu1JHeK03wQ6S9feBacFFHOfWykmkpKyDW0NneMwxyIVu88X89jpwA7lmU75haEmagFMcuVQR6lrKOaGtZRSBZOHGRgW6iOXYmP9/AvP/AxvdGfNkuS9vituMnBTS755JNHAfnkkUM22WSThQM7GWSQgQ0IIAQQfMwwzQ3GGOEC5/iDy/hiXeb/AQDtquZeJxF4YgAAAABJRU5ErkJggg==); |
19 | background-repeat: no-repeat; |
21 | background-position: center; |
这段代码中最引人注目的可能就是背景图片所使用的数据URI了。URI在语法上等同于实际使用HTTP URL路径并且能够避免额外HTTP请求开销。同样我们在.widget样式中将它设置成了绝对定位,之前我们设置的是相对定位的。 |
| Let's now go ahead and set up the widget typography. We only use h3 and p elements inside the widget; here is the accompanying css.
06 | margin: -12px 0 12px -12px; |
The margin and padding rules on the h3 element allow the element to stretch to the edge of the widget element over the top of the widget's 12px of padding. We also set the top margin to 0 on the p element to fit closer to the header of the widget. | 译者信息 现在我们设置widget的样式。在这里我们只用到了h3和p元素,它们的样式如下:
06 | margin: -12px 0 12px -12px; |
h3元素的margin和padding的规则能够使得元素拉升到距离widget顶部12像素的位置,将p元素的margin设置为0能够让p元素和widget顶部贴合。 |


 419
419

 被折叠的 条评论
为什么被折叠?
被折叠的 条评论
为什么被折叠?
 到【灌水乐园】发言


