d3学习之(Data Visualization with d3.js Cookbook )(第三章)-4

第三章 处理数据


          4.处理数组

        我们大多数的数据都是以数组形式存储的,我们会花费大量的工作在格式化和重组数组的数据上,为此D3为我们提供了丰富的数组操作方法,使我们的工作简单化。在本节我们将展示最常用和实用的D3数组操作方法。


             先来看下面的代码:


<!DOCTYPE html>
<html>
<head>
    <meta charset="utf-8">
    <title>Working with Array</title>
    <link rel="stylesheet" type="text/css" href="styles.css"/>
    <script type="text/javascript" src="http://d3js.org/d3.v3.min.js"></script>
</head>

<body>

<div class="code">var array = [3, 2, 11, 7, 6, 4, 10, 8, 15]</div>

<div>d3.min => <span id="min"></span></div>
<div>d3.max => <span id="max"></span></div>
<div>d3.extent => <span id="extent"></span></div>
<div>d3.sum => <span id="sum"></span></div>
<div>d3.median => <span id="median"></span></div>
<div>d3.mean => <span id="mean"></span></div>
<div>array.sort(d3.ascending) => <span id="asc"></span></div>
<div>array.sort(d3.descending) => <span id="desc"></span></div>
<div>d3.quantile(array.sort(d3.ascending), 0.25) => <span id="quantile"></span></div>
<div>d3.bisect(array.sort(d3.ascending), 6) => <span id="bisect"></span></div>

<div class="code">
<pre>
    var records = [
      {date: "2011-11-14T16:17:54Z", quantity: 2, total: 190, tip: 100, type: "tab"},
      {date: "2011-11-14T16:20:19Z", quantity: 2, total: 190, tip: 100, type: "tab"},
      {date: "2011-11-14T16:28:54Z", quantity: 1, total: 300, tip: 200, type: "visa"},
      {date: "2011-11-14T16:30:43Z", quantity: 2, total: 90, tip: 0, type: "tab"},
      {date: "2011-11-14T16:48:46Z", quantity: 2, total: 90, tip: 0, type: "tab"},
      {date: "2011-11-14T16:53:41Z", quantity: 2, total: 90, tip: 0, type: "tab"},
      {date: "2011-11-14T16:54:06Z", quantity: 1, total: 100, tip: 0, type: "cash"},
      {date: "2011-11-14T16:58:03Z", quantity: 2, total: 90, tip: 0, type: "tab"},
      {date: "2011-11-14T17:07:21Z", quantity: 2, total: 90, tip: 0, type: "tab"},
      {date: "2011-11-14T17:22:59Z", quantity: 2, total: 90, tip: 0, type: "tab"},
      {date: "2011-11-14T17:25:45Z", quantity: 2, total: 200, tip: 0, type: "cash"},
      {date: "2011-11-14T17:29:52Z", quantity: 1, total: 200, tip: 100, type: "visa"}
    ];

    d3.nest()
            .key(function(d){return d.type;})
            .key(function(d){return d.tip;})
            .entries(records) =>
</pre>
</div>

<div>
    <pre id="nest"></pre>
</div>


<script type="text/javascript">
    var array = [3, 2, 11, 7, 6, 4, 10, 8, 15];

    d3.select("#min").text(d3.min(array));
    d3.select("#max").text(d3.max(array));
    d3.select("#extent").text(d3.extent(array));
    d3.select("#sum").text(d3.sum(array));
    d3.select("#median").text(d3.median(array));
    d3.select("#mean").text(d3.mean(array));
    d3.select("#asc").text(array.sort(d3.ascending));
    d3.select("#desc").text(array.sort(d3.descending));
    d3.select("#quantile").text(
        d3.quantile(array.sort(d3.ascending), 0.25)
    );
    d3.select("#bisect").text(
        d3.bisect(array.sort(d3.ascending), 6)
    );

    var records = [
        {quantity: 2, total: 190, tip: 100, type: "tab"},
        {quantity: 2, total: 190, tip: 100, type: "tab"},
        {quantity: 1, total: 300, tip: 200, type: "visa"},
        {quantity: 2, total: 90, tip: 0, type: "tab"},
        {quantity: 2, total: 90, tip: 0, type: "tab"},
        {quantity: 2, total: 90, tip: 0, type: "tab"},
        {quantity: 1, total: 100, tip: 0, type: "cash"},
        {quantity: 2, total: 90, tip: 0, type: "tab"},
        {quantity: 2, total: 90, tip: 0, type: "tab"},
        {quantity: 2, total: 90, tip: 0, type: "tab"},
        {quantity: 2, total: 200, tip: 0, type: "cash"},
        {quantity: 1, total: 200, tip: 100, type: "visa"}
    ];

    var nest = d3.nest()
            .key(function (d) { // <- A
                return d.type;
            })
            .key(function (d) { // <- B
                return d.tip;
            })
            .entries(records); // <- C

    d3.select("#nest").html(printNest(nest, ""));

    function printNest(nest, out, i) {
        if(i === undefined) i = 0;

        var tab = ""; for(var j = 0; j < i; ++j) tab += " ";

        nest.forEach(function (e) {
            if (e.key)
                out += tab + e.key + "<br>";
            else
                out += tab + printObject(e) + "<br>";

            if (e.values)
                out = printNest(e.values, out, ++i);
            else
                return out;
        });

        return out;
    }

    function printObject(obj) {
        var s = "{";
        for (var f in obj) {
            s += f + ": " + obj[f] + ", ";
        }
        s += "}";
        return s;
    }
</script>

</body>

</html>

        以上的代码展示了D3所提供的最常用也是最有效的对数组的操作,在浏览器中运行的输出结果如下:


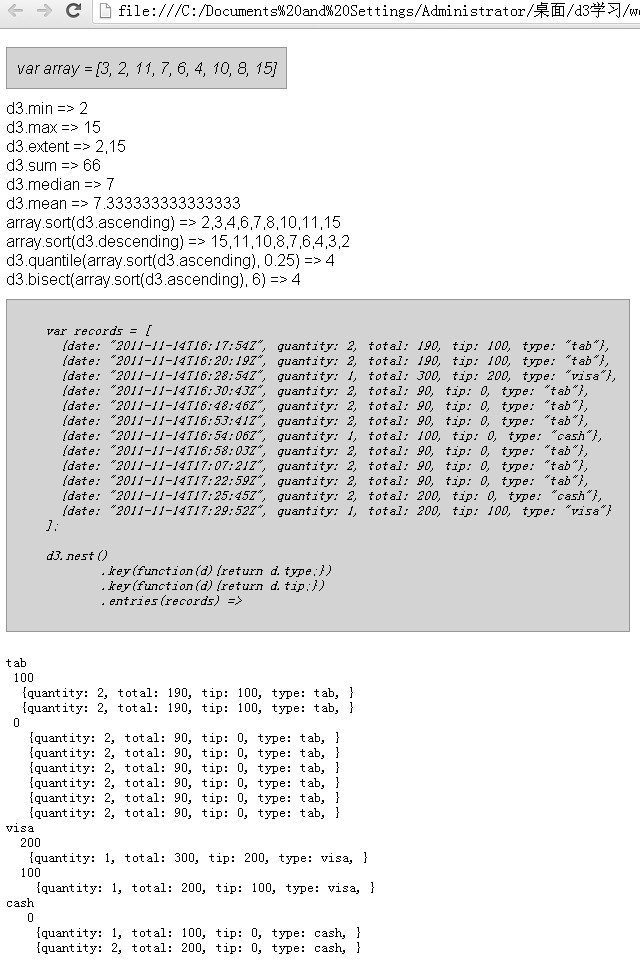
         我们看看是如何工作的,D3提供了多种公共方法来帮助我们处理javascript数组,他们中的大多数是非常直观和直接的,然而,在本节中我们还是要简短的讨论一下他们的内在的东西。

         我们看上面的代码,首先给了我们一个数组var array = [3, 2, 11, 7, 6, 4, 10, 8, 15];

         d3.min(array)。d3.min这个方法用来获取数组中最小的元素,在本例中为2.

         d3.max(array)。d3.max这个方法用来获取数组中最大的元素,在本例中为15.

         d3.extent(array)。d3.extent这个方法返回数组中的最大值和最小值,本例中为2,15.

         d3.sum(array)。d3.sum这个方法返回数组中所有元素的和,本例中为66.

         d3.median(array)。d3.median这个方法返回数组中按大小顺序在中间的那个,本例中为7.

         d3.mean(array)。 d3.mean这个方法返回数组中所有元素的平均值,本例为7.33.

         array.sort(d3.ascending)/array.sort(d3.descending)。d3.ascending /d3.descending这个两个方法是D3内建的计算方法,可以用来对数组进行排序:

           d3. ascending = function( a, b) { return a < b ? -1 : a > b ? 1 : 0;}       升序

           d3. descending = function( a, b) { return b < a ? -1 : b > a ? 1 : 0;}       降序

        d3.quantile(array.sort(d3.ascending), 0.25)。d3.quantile这个方法是计算已经升序排列的数组的分位数,本例中分位数为0.25的是4.

        d3.bisect(array.sort(d3.ascending), 6)。d3.bisect这个方法可以获取已经排序数组中某个元素右边的元素,本例中6右边的为4.

        d3.nest()方法可以用来建立一套算法,将一个平面阵列为基础的数据结构转变成一个分层嵌套结构,这种结构特别适合某些可视化项目,d3.nest()可以被看成是利用key方法链接到nest像我们在A处和B处看到的那样。

         var nest = d3.nest()
            .key(function (d) { // <- A
                return d.type;
            })
            .key(function (d) { // <- B
                return d.tip;
            })
            .entries(records); // <- C

        多种key方法可以产生多层的嵌套,在本例中使用了2层,首先是type的值,然后是tip的值,最后展示的结果就是:


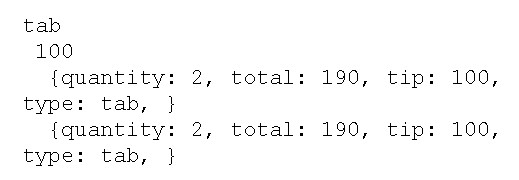
            最后在C处entries方法用来支持平面阵列为基础的数据结构。


D3.js 4.x Data Visualization - Third Edition by Andrew Rininsland English | 28 Apr. 2017 | ASIN: B01MG90SSJ | 308 Pages | AZW3 | 6.6 MB Key Features Build interactive and rich graphics and visualization using JavaScript`s powerful library D3.js Learn D3 from the ground up, using the all-new version 4 of the library Gain insight into producing high-quality, extensible charts and visualizations using best practices such as writing testable, extensible code and strong typing Book Description Want to get started with impressive interactive visualizations and implement them in your daily tasks? This book offers the perfect solution-D3.js. It has emerged as the most popular tool for data visualization. This book will teach you how to implement the features of the latest version of D3 while writing JavaScript using the newest tools and technique You will start by setting up the D3 environment and making your first basic bar chart. You will then build stunning SVG and Canvas-based data visualizations while writing testable, extensible code,as accurate and informative as it is visually stimulating. Step-by-step examples walk you through creating, integrating, and debugging different types of visualization and will have you building basic visualizations (such as bar, line, and scatter graphs) in no time. By the end of this book, you will have mastered the techniques necessary to successfully visualize data and will be ready to use D3 to transform any data into an engaging and sophisticated visualization. What you will learn Map data to visual elements using D3's scales Draw SVG elements using D3's shape generators Transform data using D3's collection methods Use D3's various layout patterns to quickly generate various common types of chart Write modern JavaScript using ES2017 and Babel Explore the basics of unit testing D3 visualizations using Mocha and Chai Write and deploy a simple Node.js web service to render charts via HTML Canvas Understand what makes a good data visualization and how to use the tools at your disposal to create accurate charts About the Author Andrew Rininsland is a developer and journalist who has spent much of the last half a decade building interactive content for newspapers such as The Financial Times, The Times, Sunday Times, The Economist, and The Guardian. During his 3 years at The Times and Sunday Times, he worked on all kinds of editorial projects, ranging from obituaries of figures such as Nelson Mandela to high-profile, data-driven investigations such as The Doping Scandal the largest leak of sporting blood test data in history. He is currently a senior developer with the interactive graphics team at the Financial Times. Swizec Teller, author of Data Visualization with d3.js, is a geek with a hat. He founded his first start-up at the age of 21 years and is now looking for the next big idea as a full-stack Web generalist focusing on freelancing for early-stage start-up companies. When he isn't coding, he's usually blogging, writing books, or giving talks at various non-conference events in Slovenia and nearby countries. He is still looking for a chance to speak at a big international conference. In November 2012, he started writing Why Programmers Work At Night, and set out on a quest to improve the lives of developers everywhere. Table of Contents Getting Started with D3, ES2017, and Node.js A Primer on DOM, SVG, and CSS Shape Primitives of D3 Making Data Useful Defining the User Experience - Animation and Interaction Hierarchical Layouts of D3 The Other Layouts D3 on the Server with Canvas, Koa 2, and Node.js Having Confidence in Your Visualizations Designing Good Data Visualizations
Book Description Mold your data into beautiful visualizations with d3.js Overview Build blocks of web visualizations Learn visualization with detailed walkthroughs Learn to use data more effectively Animate with d3.js Design good visualizations In Detail d3.js. provides a platform that help you create your own beautiful visualization and bring data to life using HTML, SVG and CSS. It emphasis on web standards that will fully utilize the capabilities of your web browser. Data Visualization with d3.js walks you through 20 examples in great detail. You can finally stop struggling to piece together examples you've found online. With this book in hand, you will learn enough of the core concepts to conceive of and build your own visualizations from scratch. The book begins with the basics of putting lines on the screen, and builds on this foundation all the way to creating interactive animated visualizations using d3.js layouts. You will learn how to use d3.js to manipulate vector graphics with SVG, layout with HTML, and styling with CSS. You'll take a look at the basics of functional programming and using data structures effectively – everything from handling time to doing geographic projections. The book will also help make your visualizations interactive and teach you how automated layouts really work. Data Visualization with d3.js will unveil the mystery behind all those beautiful examples you've been admiring. What you will learn from this book Draw with SVG shapes and path generators Add styles with HTML and CSS Use data structures effectively Dynamically update visualizations as data changes Animate visualizations Let the user explore your data Use layouts to create complex drawings Learn to identify what makes a good visualization good Approach This book is a mini tutorial with plenty of code examples and strategies to give you many options when building your own visualizations. Who this book is written for This book is ideal for anyone interested in data visualization. Some rudimentary knowledge of JavaScript is required. Product Details Paperback: 194 pages Publisher: Packt Publishing (October 25, 2013) Language: English ISBN-10: 1782160000 ISBN-13: 978-1782160007 Product Dimensions: 9.2 x 7.5 x 0.4 inches
评论
添加红包

请填写红包祝福语或标题

红包个数最小为10个

红包金额最低5元

当前余额3.43前往充值 >
需支付:10.00
成就一亿技术人!
领取后你会自动成为博主和红包主的粉丝 规则
hope_wisdom
发出的红包
实付
使用余额支付
点击重新获取
扫码支付
钱包余额 0

抵扣说明:

1.余额是钱包充值的虚拟货币,按照1:1的比例进行支付金额的抵扣。
2.余额无法直接购买下载,可以购买VIP、付费专栏及课程。

余额充值