


根据数据格式
dataGoz: [{
"xAxis": ["2017-3-1", "2017-3-15", "2017-4-1", "2017-4-12", "2017-5-21", "2017-6-5", "2017-8-12", "2017-9-1", "2017-10-11"],
"yAxis": [
{ "name": "TT", "data": ["23", "56", "32", "41", "32", "45", "39", "47", "58"] },
{ "name": "KK", "data": ["23333", "34533", "32234", "25551", "34265", "35032", "23332", "27932", "22438"] }
],
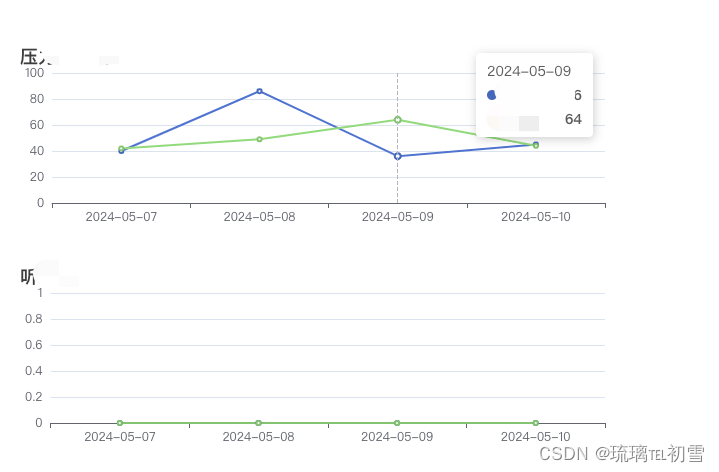
"name": "温度"
}]动态实现效果
<template>
  <div>
    <div v-for="(dataset, index) in dataGoz" :key="index" :ref="'chart' + index"
      style="width: 600px; height: 200px; margin-bottom: 20px;" v-loading="loading"></div>
  </div>
</template>

<script>
import * as echarts from 'echarts';

export default {
  name: 'LineCharts',
  props: {
    dataGoz: {
      type: Array,
      default: () => []
    }
  },
  mounted() {
    this.$nextTick(() => {
      this.initCharts()
    })
  },
  watch: {
    dataGoz: {
      handler() {

        this.initCharts();

      },
      deep: true
    }
  },
  data() {
    return {
      // 遮罩层
      loading: true,

    }
  },
  methods: {
    initCharts() {
      this.loading = true
      // 遍历 dataGoz 数组,为每个数据集初始化一个图表实例
      this.dataGoz.forEach((dataset, index) => {
        // 初始化图表实例
        const chartDom = this.$refs['chart' + index][0];
        const chartInstance = echarts.init(chartDom);

        // 转换 yAxis 数据为数字类型
        dataset.yAxis.forEach(yAxisItem => {
          yAxisItem.yData = yAxisItem.yData.map(value => Number(value));
        });
        // ECharts 配置项
        const option = {
          title: {
            text: dataset.name
          },
          tooltip: {
            trigger: 'axis'
          },
          grid: {
            left: 10,
            right: 10,
            bottom: 20,
            top: 30,
            containLabel: true
          },
          xAxis: {
            type: 'category',
            data: dataset.xAxis
          },
          yAxis: {
            type: 'value'
          },
          series: dataset.yAxis.map(yAxisItem => ({
            name: yAxisItem.yName,
            type: 'line',
            data: yAxisItem.yData
          }))
        };
        this.loading = false;

        // 使用配置项和数据显示图表
        chartInstance.setOption(option);
      });


    }
  }
};
</script>

<style scoped>
/* 你的样式 */
</style>


 被折叠的 条评论
为什么被折叠?
被折叠的 条评论
为什么被折叠?
 到【灌水乐园】发言


