


使用npm安装echarts
npm install echarts --save
运行完语句出现以下的内容表示echarts安装成功,4.3.0表示安装的echarts版本号
使用echarts
<template>
<div id="bar_dv" style="width: 500px; height: 500px"> </div>
</template>
<script>
  var echarts = require('echarts'); //引入echarts所有的方法。没有按需引入
  export default {
    name: "HelloWorld",
    data(){
      return{
        myChart: null,
      }
    },
    mounted(){
      this.showChart()
    },
    beforeDestroy() { //销毁实例
      if(!this.myChart){  //解决报错:cannot read property 'dispose' of null
        return;
      }
      this.myChart.dispose()
      this.myChart = null
    },
    methods:{
      showChart(){
        this.myChart = echarts.init(document.getElementById("bar_dv")); //初始化echarts实例,id名称对应template中的id名称
        var option = {
          tooltip: {    //弹框
            trigger: 'item',
            position:'inside', //防止弹框跑出div,内容显示不全
            formatter: "{b}: {c}<br/>({d}%)" //b为data中的name值 c为value值 d为选中区域占比值
          },
          series: [
            { //内部环形图
              color: ['#3196fa', '#ef4864','#facc14' ],
              type:'pie',
              radius: [0, '45%'],
              label: {
                normal: {
                  position: 'inner',
                  textStyle:{
                    fontSize:'12',
                  },
                  formatter:'{b}\n{d}%',
                  position:'inside',
                },
              },
              labelLine: {
                normal: {
                  show: false,
                }
              },
              data:[ //内部环形图数据
                {value:'150', name:'大一' },
                {value:'170', name:'大二'},
                {value:'190', name:'大三'}
              ],
            },
            {//外面的环形图
              type:'pie',
              radius: ['50%', '60%'],
              label: {
                normal: {
                  show:false,
                }
              },
              data:[//外部环形图数据
                {value:'100', name:'男',itemStyle:{
                    normal:{
                      color:'#65b2ff'
                    }
                  }
                },
                {value:'50', name:'女',itemStyle:{
                    normal:{
                      color:'#c0d8f1'
                    }
                  }},
                {value:'110', name:'男',itemStyle:{
                    normal:{
                      color:'#ed7085'
                    }
                  }},
                {value:'60', name:'女',itemStyle:{
                    normal:{
                      color:'#f59cab'
                    }
                  }},
                {value:'120', name:'男',itemStyle:{
                    normal:{
                      color:'#f8d751'
                    }
                  }},
                {value:'70', name:'女',itemStyle:{
                    normal:{
                      color:'#f9e596'
                    }
                  }}
              ]
            }
          ]
        };
        this.myChart.setOption(option);
      }
    }
  }
</script>
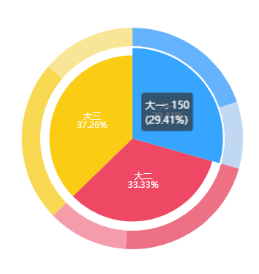
以上是一个嵌套环形图,在vue 中使用echarts的步骤主要为:
1:npm 安装echarts npm install echarts --save。
2页面中引入echarts var echarts = require(‘echarts’)
3:在div中添加id名称,并给宽高 id=“bar_dv” style=“width: 500px; height: 500px”
4:初始化echarts实例 this.myChart = echarts.init(document.getElementById(“bar_dv”))


 409
409


 被折叠的 条评论
为什么被折叠?
被折叠的 条评论
为什么被折叠?
 到【灌水乐园】发言


