


在使用echarts 环形图时,有时候我们开发需要 环形图 中间默认显示我们需要的数据,我们可以这样改一下代码;
改之前:

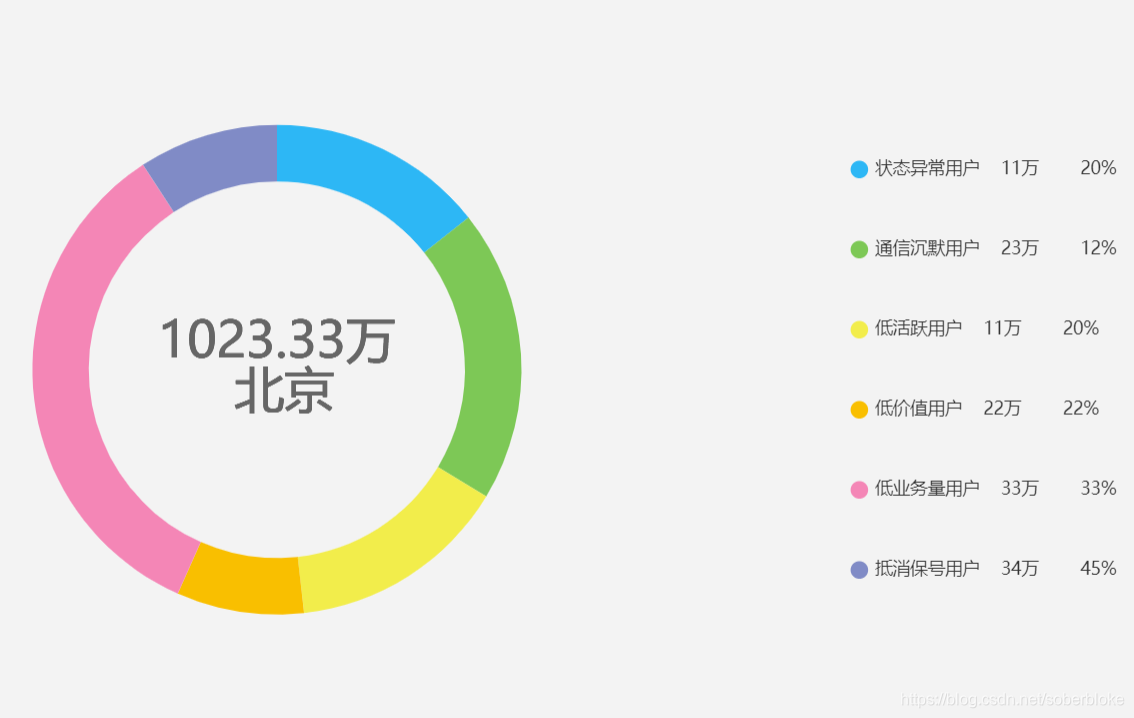
修改之后:
修改代码如下:
 normal: {

                    show: true,
                    position: 'center',
                    formatter:function()
在使用echarts 环形图时,有时候我们开发需要 环形图 中间默认显示我们需要的数据,我们可以这样改一下代码;
改之前:
修改之后:
修改代码如下:
normal: {
show: true,
position: 'center',
formatter:function()
 被折叠的 条评论
为什么被折叠?
被折叠的 条评论
为什么被折叠?
 到【灌水乐园】发言


 最低0.47元/天 解锁文章


