echarts使用笔记

前段时间由于项目需要,对echarts的关系图进行了简单的了解,虽然都是一些简单的用法,很久不用还是会忘,好记性不如烂笔头,还是写下来吧。


首先,以官网中的http://echarts.baidu.com/demo.html#graph-simple 为例


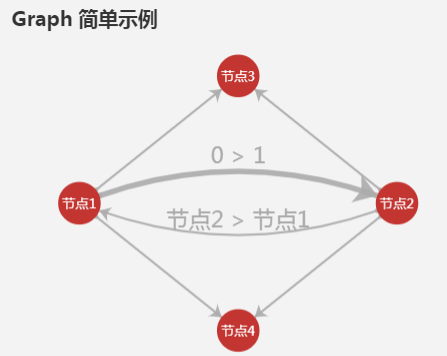
创建图示关系图可分为三步:1. 引入echarts.js文件  2 .为关系图准备一个div并设置好宽高  3.创建echarts实例,通过option指定图表的配置项和数据。如下图


关于option里面的配置项,主要用到的是series
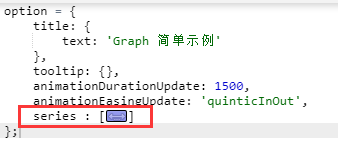

 详细如下


data属性,详细如下


links属性,详细如下


如果要用图片替换节点图标,可在series下或每个节点中添加symbol属性,如:symbol:'image://./img/server.png'


以下为上图代码,只在官网的例子上改动了一点点

[html]  view plain  copy
  1. <!DOCTYPE html>  
  2. <html>  
  3.     <head>  
  4.         <meta charset="UTF-8">  
  5.         <title></title>  
  6.         <script src="js/echarts.js"></script>  
  7.     </head>  
  8.     <body>  
  9.         <div id="main" style="width: 600px;height:400px;"></div>  
  10.         <script type="text/javascript">  
  11.         // 基于准备好的dom,初始化echarts实例  
  12.         var myChart = echarts.init(document.getElementById('main'));  
  13.         // 指定图表的配置项和数据  
  14.         var option = {  
  15.             title: {  
  16.                 text: 'Graph 简单示例'  
  17.             },  
  18.             tooltip: {},  
  19.             animationDurationUpdate: 1500,  
  20.             animationEasingUpdate: 'quinticInOut',  
  21.             series : [  
  22.                 {  
  23.                     type: 'graph',  
  24.                     layout: 'none',  
  25.                     symbol:'image://./img/server.png',  
  26.                     symbolSize: [60,80],//设置节点宽高,为一个数字时,则宽高相同  
  27.                     roam: true,  
  28.                     label: {  
  29.                         normal: {  
  30.                             show: true  
  31.                         }  
  32.                     },  
  33.                     edgeSymbol: ['circle', 'arrow'],  
  34.                     edgeSymbolSize: [4, 10],  
  35.                     edgeLabel: {  
  36.                         normal: {  
  37.                             textStyle: {  
  38.                                 fontSize: 20  
  39.                             }  
  40.                         }  
  41.                     },  
  42.                     data: [{  
  43.                         name: '节点1',  
  44.                         x: 300,  
  45.                         y: 300  
  46.                     }, {  
  47.                         name: '节点2',  
  48.                         x: 800,  
  49.                         y: 300  
  50.                     }, {  
  51.                         name: '节点3',  
  52.                         x: 550,  
  53.                         y: 100  
  54.                     }, {  
  55.                         name: '节点4',  
  56.                         x: 550,  
  57.                         y: 500  
  58.                     }],  
  59.                     links: [{  
  60.                         source: 0,  
  61.                         target: 1,  
  62.                         symbolSize: [5, 20],  
  63.                         label: {  
  64.                             normal: {  
  65.                                 show: true  
  66.                             }  
  67.                         },  
  68.                         lineStyle: {  
  69.                             normal: {  
  70.                                 width: 5,  
  71.                                 curveness: 0.2  
  72.                             }  
  73.                         }  
  74.                     }, {  
  75.                         source: '节点2',  
  76.                         target: '节点1',  
  77.                         label: {  
  78.                             normal: {  
  79.                                 show: true  
  80.                             }  
  81.                         },  
  82.                         lineStyle: {  
  83.                             normal: { curveness: 0.2 }  
  84.                         }  
  85.                     }, {  
  86.                         source: '节点1',  
  87.                         target: '节点3'  
  88.                     }, {  
  89.                         source: '节点2',  
  90.                         target: '节点3'  
  91.                     }, {  
  92.                         source: '节点2',  
  93.                         target: '节点4'  
  94.                     }, {  
  95.                         source: '节点1',  
  96.                         target: '节点4'  
  97.                     }],  
  98.                     lineStyle: {  
  99.                         normal: {  
  100.                             opacity: 0.9,  
  101.                             width: 2,  
  102.                             curveness: 0  
  103.                         }  
  104.                     }  
  105.                 }  
  106.             ]  
  107.         };  
  108.         // 使用刚指定的配置项和数据显示图表。  
  109.         myChart.setOption(option);  
  110.         </script>  
  111.     </body>  
  112. </html>  

上面提到的两个没试出来的属性,有知道的小伙伴可以交流一下。


  • 0
    点赞
  • 1
    收藏
    觉得还不错? 一键收藏
  • 0
    评论
评论
添加红包

请填写红包祝福语或标题

红包个数最小为10个

红包金额最低5元

当前余额3.43前往充值 >
需支付:10.00
成就一亿技术人!
领取后你会自动成为博主和红包主的粉丝 规则
hope_wisdom
发出的红包
实付
使用余额支付
点击重新获取
扫码支付
钱包余额 0

抵扣说明:

1.余额是钱包充值的虚拟货币,按照1:1的比例进行支付金额的抵扣。
2.余额无法直接购买下载,可以购买VIP、付费专栏及课程。

余额充值