


 本文介绍GeoPandas在Python中处理矢量数据的方法,包括读写shp文件、空间数据操作、投影转换及空间分析等内容。GeoPandas基于pandas和fiona,提供强大的地理数据处理功能。
【Python处理矢量数据(例shp文件)】
1.ogr:GDAL项目中用于处理矢量数据的模块
2.fiona:基于ogr的封装,提供了更简洁了API
3.geopandas:基于fiona进行封装,并在pandas的基础上添加了对空间数据的支持,实现了读取空间数据以及对空间数据进行处理
文章目录
示例
基础操作
(1)读、写、看
# 读文件
gdf = geopandas.GeoDataFrame.from_file("shp文件路径", encoding='gb18030')
gdf = geopandas.read_file("package.gpkg", layer='countries')
gdf = geopandas.read_file("shp文件路径")
# 显示
gdf.head()  #输出属性表
gdf.plot()	#画
gdf.show()
# 保存
gdf.to_file("countries.geojson", driver='GeoJSON')
gdf.to_file("countries.shp")
(2)遍历
for i in range(0, len(gdf) ):
    geo = gdf.geometry[i] #获取空间属性,即GeoSeries
    name = gdf.NAME[i]	  #获得属性数据,即字段
(3)索引
# 可用:.loc .iloc .cs索引方法
(4)其他
# 投影转换
tmp_gdf = gdf.to_crs(crs)
new_gdf = gdf1.to_crs(gdf2.crs) #gdf1和gdf2统一坐标系
# 求面积
df = df.to_crs({'init': 'epsg:32650'}) #转成投影坐标后,才能算出正确的面积(示例,转为墨卡托投影)
df['area'] = df.apply(lambda row: row.geometry.area, axis=1)
# 合并两个数据
new_df = df1.append(df2)
简单操作实例
(1)简单创造、构造空间属性、添加其他属性
from shapely.geometry
import  Polygon;
from geopandas import GeoSeries,GeoDataFrame
# 创造Polygon
p1 = Polygon([(0, 0), (1, 0), (1, 1)])
p2 = Polygon([(0, 0), (1, 0), (1, 1), (0, 1)])
p3 = Polygon([(2, 0), (3, 0), (3, 1), (2, 1)])
# 构造空间属性,即GeoSeries
g = GeoSeries([p1, p2, p3])
g.show()		#显示
g.buffer(0.5)	#缓冲区
g.boundary		#边界
g.centroid		#质心
# 添加属性
gdf = GeoDataFrame({'属性名' : [1, 2, ..]}, geometry=g)
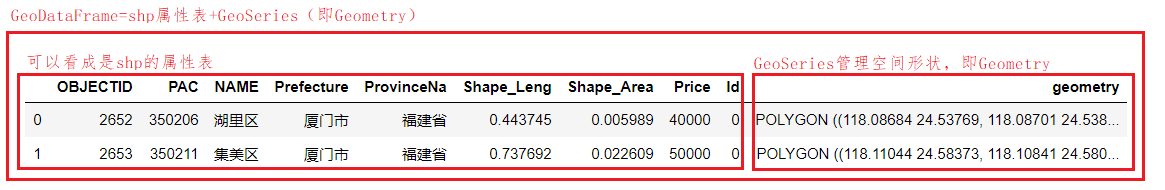
GeoPandas的数据结构
【GeoPandas】主要包含两个数据结构,即GeoSeries和GeoDataFrame
空间数据主要由两部分组成,属性数据和空间属性。属性数据即是shp中的属性表,空间属性即为shp中每个单元的几何形状。
1.【GeoSeries】用GeoSeries表示空间属性(即geometry)。
2.【GeoDataFrame】可以把GeoDataFrame理解为shp的属性表,但比shp的属性表多一列,这一列就是空间数据(即GeoSeries)
GeoSeries管理空间属性
【GeoSeries】GeoSeries只管理空间属性,不包含GeoDataFrame中的其他属性。主要包括:点/多点、线/多线、面/多面
(1)方法和属性
GeoSeries.area		#面积
GeoSeries.bounds 	#边界:minx, miny, maxx, maxy
GeoSeries.length	#几何的长度
GeoSeries.geom_type	#几何类型
GeoSeries.to_crs(src)	#改变坐标系
GeoSeries.plot()		#制图
GeoSeries.distance(other)	#最小距离
GeoSeries.centroid()		#质心
GeoSeries.representative_point()	#返回在每个几何内部的点,但不返回重心
GeoSeries.exterior	#返回线环(LinearRings)的一个GeoSeries,它表示GeoSeries中每个多边形的外边界
GeoSeries.interior	#返回内部环序列的一个GeoSeries,它表示GeoSeries中每个多边形的内部环
(2)谓词
GeoSeries.is_empty	#返回一个布尔型的Series,对于一个空的几何图形,该值就为True
GeoSeries.is_ring	#返回一个布尔型的Series,对于闭合的要素,该值就为True
GeoSeries.is_simple	#返回一个布尔型的Series,如果几何体自身不交叉,该值就为True(仅对线串--LineStrings和线环--LineRings有意义)
GeoSeries.is_valid	#返回一个布尔型的Series,如果几何体是有效的,该值就为True
GeoSeries.almost_equals(other[,decimal=6])	#返回一个布尔型的Series对象,如果在指定的小数位精度下,每个对象所有点与其他对象大致相等,该值就为True(可见equals())
GeoSeries.contains(other)	#返回一个布尔型的Series,如果每个对象的内部包含其他对象的内部和边界,并且它们的边界不相接,该值为True
GeoSeries.crosses(other)	#返回一个布尔型的Series,如果每个对象的内部与其他对象的内部相交但不包含,并且相交的部分小于这两个相交对象自身,该值为True
GeoSeries.disjoint(other)	#返回一个布尔型的Series,如果每个对象的边界和内部与其他对象的边界和内部都不相交,该值为True
GeoSeries.equals(other)		#返回一个布尔型的Series,如果几何对象集合的边界,内部,外部都与其他几何对象一样,该值为True。
GeoSeries.intersects(other)	#返回一个布尔型的Series,如果每个对象的边界和内部以其它任何形式与其他对象相交,该值为True。
GeoSeries.touches(other)	#返回一个布尔型的Series,如果对象与其他对象至少有一个点相同,且它们的内部任何部分都不相交,该值为True。
GeoSeries.within(other)		#返回一个布尔型的Series, 如果每个对象的边界和内部只与其他对象的内部相交(不包括边界和外部),该值为True(与contains()方法相反)
(3)不常用
GeoSeries.xticks(rotation = 90) #x刻度数值旋转90°
GeoDataFrame用表格形式组织地理数据
【GeoDataFrame】包含GeoSeries的表格数据结构
world = geopandas.read_file(geopandas.datasets.get_path('naturalearth_lowres'))	#打开geopandas内置数据库中的数据
world.head()	#查看数据结构
world.plot()	#制图
world = world.rename(columns={'geometry': 'borders'}).set_geometry('borders')   #更改geometry列的名字
world['centroid_column'] = world.centroid         #  把质点赋给world的列centroid_column中
world = world.set_geometry('centroid_column')   #   把几何列设为centroid_column
投影
【GeoPandas投影】基于proj4
【GeoPandas支持的坐标系表达方式】
1.+proj=longlat +ellps=WGS84 +datum=WGS84 +no_defs
2.+init=epsg:4326
【常用坐标系代码EPSG】查看全部坐标系代码请点我;坐标系Wkid详细介绍;投影坐标Wkid详细介绍
- WGS84 Latitude/Longitude
"+proj=longlat +ellps=WGS84 +datum=WGS84 +no_defs"或者是"+init=epsg:4326" - UTM Zones (North)
"+proj=utm +zone=33 +ellps=WGS84 +datum=WGS84 +units=m +no_defs" - UTM Zones (South)
"+proj=utm +zone=33 +ellps=WGS84 +datum=WGS84 +units=m +no_defs +south"
# 获得数据的投影
GeoDataFrame.crs
# 用EPSG代码设置投影
my_geoseries.crs = {'init' :'epsg:4326'}
# 投影转换
world = world.to_crs({'init': 'epsg:3395'})
制图工具
# 显示
world.slow()
# 画等值线
world = world[(world.pop_est>0) & (world.name!="Antarctica")]
world['gdp_per_cap'] = world.gdp_md_est / world.pop_est  #计算GDP
world.plot(column='gdp_per_cap')
# 改变颜色
world.plot(column='gdp_per_cap',cmap='OrRd')
# 两个图层叠加
base = world.plot(color='white', edgecolor='black');cities.plot(ax=base, marker='o', color='red', markersize=5);
# 两个图层叠加
ax = world.plot(color="read")
gdf2.plot(ax=ax, color="green")
# 设置题目
base.set_title("WGS84 (lat/lon)")
空间链接
属性连接
world = geopandas.read_file(geopandas.datasets.get_path('naturalearth_lowres'))
cities = geopandas.read_file(geopandas.datasets.get_path('naturalearth_cities'))
country_shapes = world[['geometry', 'iso_a3']]
country_names = world[['name', 'iso_a3']]
# 属性连接
country_shapes.head()
country_names.head()
country_shapes = country_shapes.merge(country_names, on='iso_a3')
country_shapes.head()
空间连接
cities = geopandas.read_file(geopandas.datasets.get_path('naturalearth_cities'))
world = geopandas.read_file(geopandas.datasets.get_path('naturalearth_lowres'))
country_shapes = world[['geometry', 'iso_a3']]
country_names = world[['name', 'iso_a3']]
# For spatial join
countries = world[['geometry', 'name']]
countries = countries.rename(columns={'name':'country'})
# 空间连接
countries.head()
cities.head()
cities_with_country = geopandas.sjoin(cities, countries, how="inner", op='intersects')
cities_with_country.head()
空间分析
集合操作
基于shapely第三方库
GeoSeries.buffer(distance, resolution=16) #缓冲区
GeoSeries.boundary	#表示每个几何的集合理论边界的低维对象
GeoSeries.centroid	#几何的质心
GeoSeries.convex_hull	#建立最小多边形
GeoSeries.envelope		#建立表示包含每个对象的点或最小矩形多边形(边平行于坐标轴)的几何图形
GeoSeries.unary_union	#返回包含所有几何的并集的几何
GeoSeries.simplify		#返回GeoSeries包含每个对象的简化表示的a
GeoSeries.rotate		#旋转GeoSeries的坐标
GeoSeries.scale			#沿着每个(x,y,z)维度缩放GeoSeries的几何
GeoSeries.skew			#通过沿x和y维度的角度剪切/倾斜GeoSeries的几何
GeoSeries.translate		#移动GeoSeries的坐标
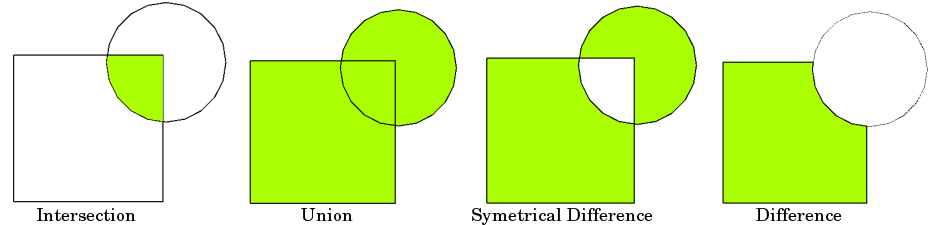
叠置分析overlay
newdf = geopandas.overlay(df1, df2, how='intersection', make_valid=True, use_sindex=None)
	# [how] intersection;union;identity;symmetric_difference;difference
其他
【安装】先安装 GDAL,Fiona, pyproj , Shapely等依赖包l,再利用pip install geopandas安装
编码问题
(1)保存shp文件,字段成乱码
GeoDataFrame.to_file('D:\tmp.shp', encoding="utf-8")
相关链接
【相关链接】
1.GeoPandas官方文档
【学习链接】
1.使用Python实现子区域数据分类统计
2.GeoPandas官方中文文档–译著
3.GeoPandas随笔


 2376
2376

 被折叠的 条评论
为什么被折叠?
被折叠的 条评论
为什么被折叠?
 到【灌水乐园】发言


