


一、官网地址
https://www.qcustomplot.com/index.php/introduction
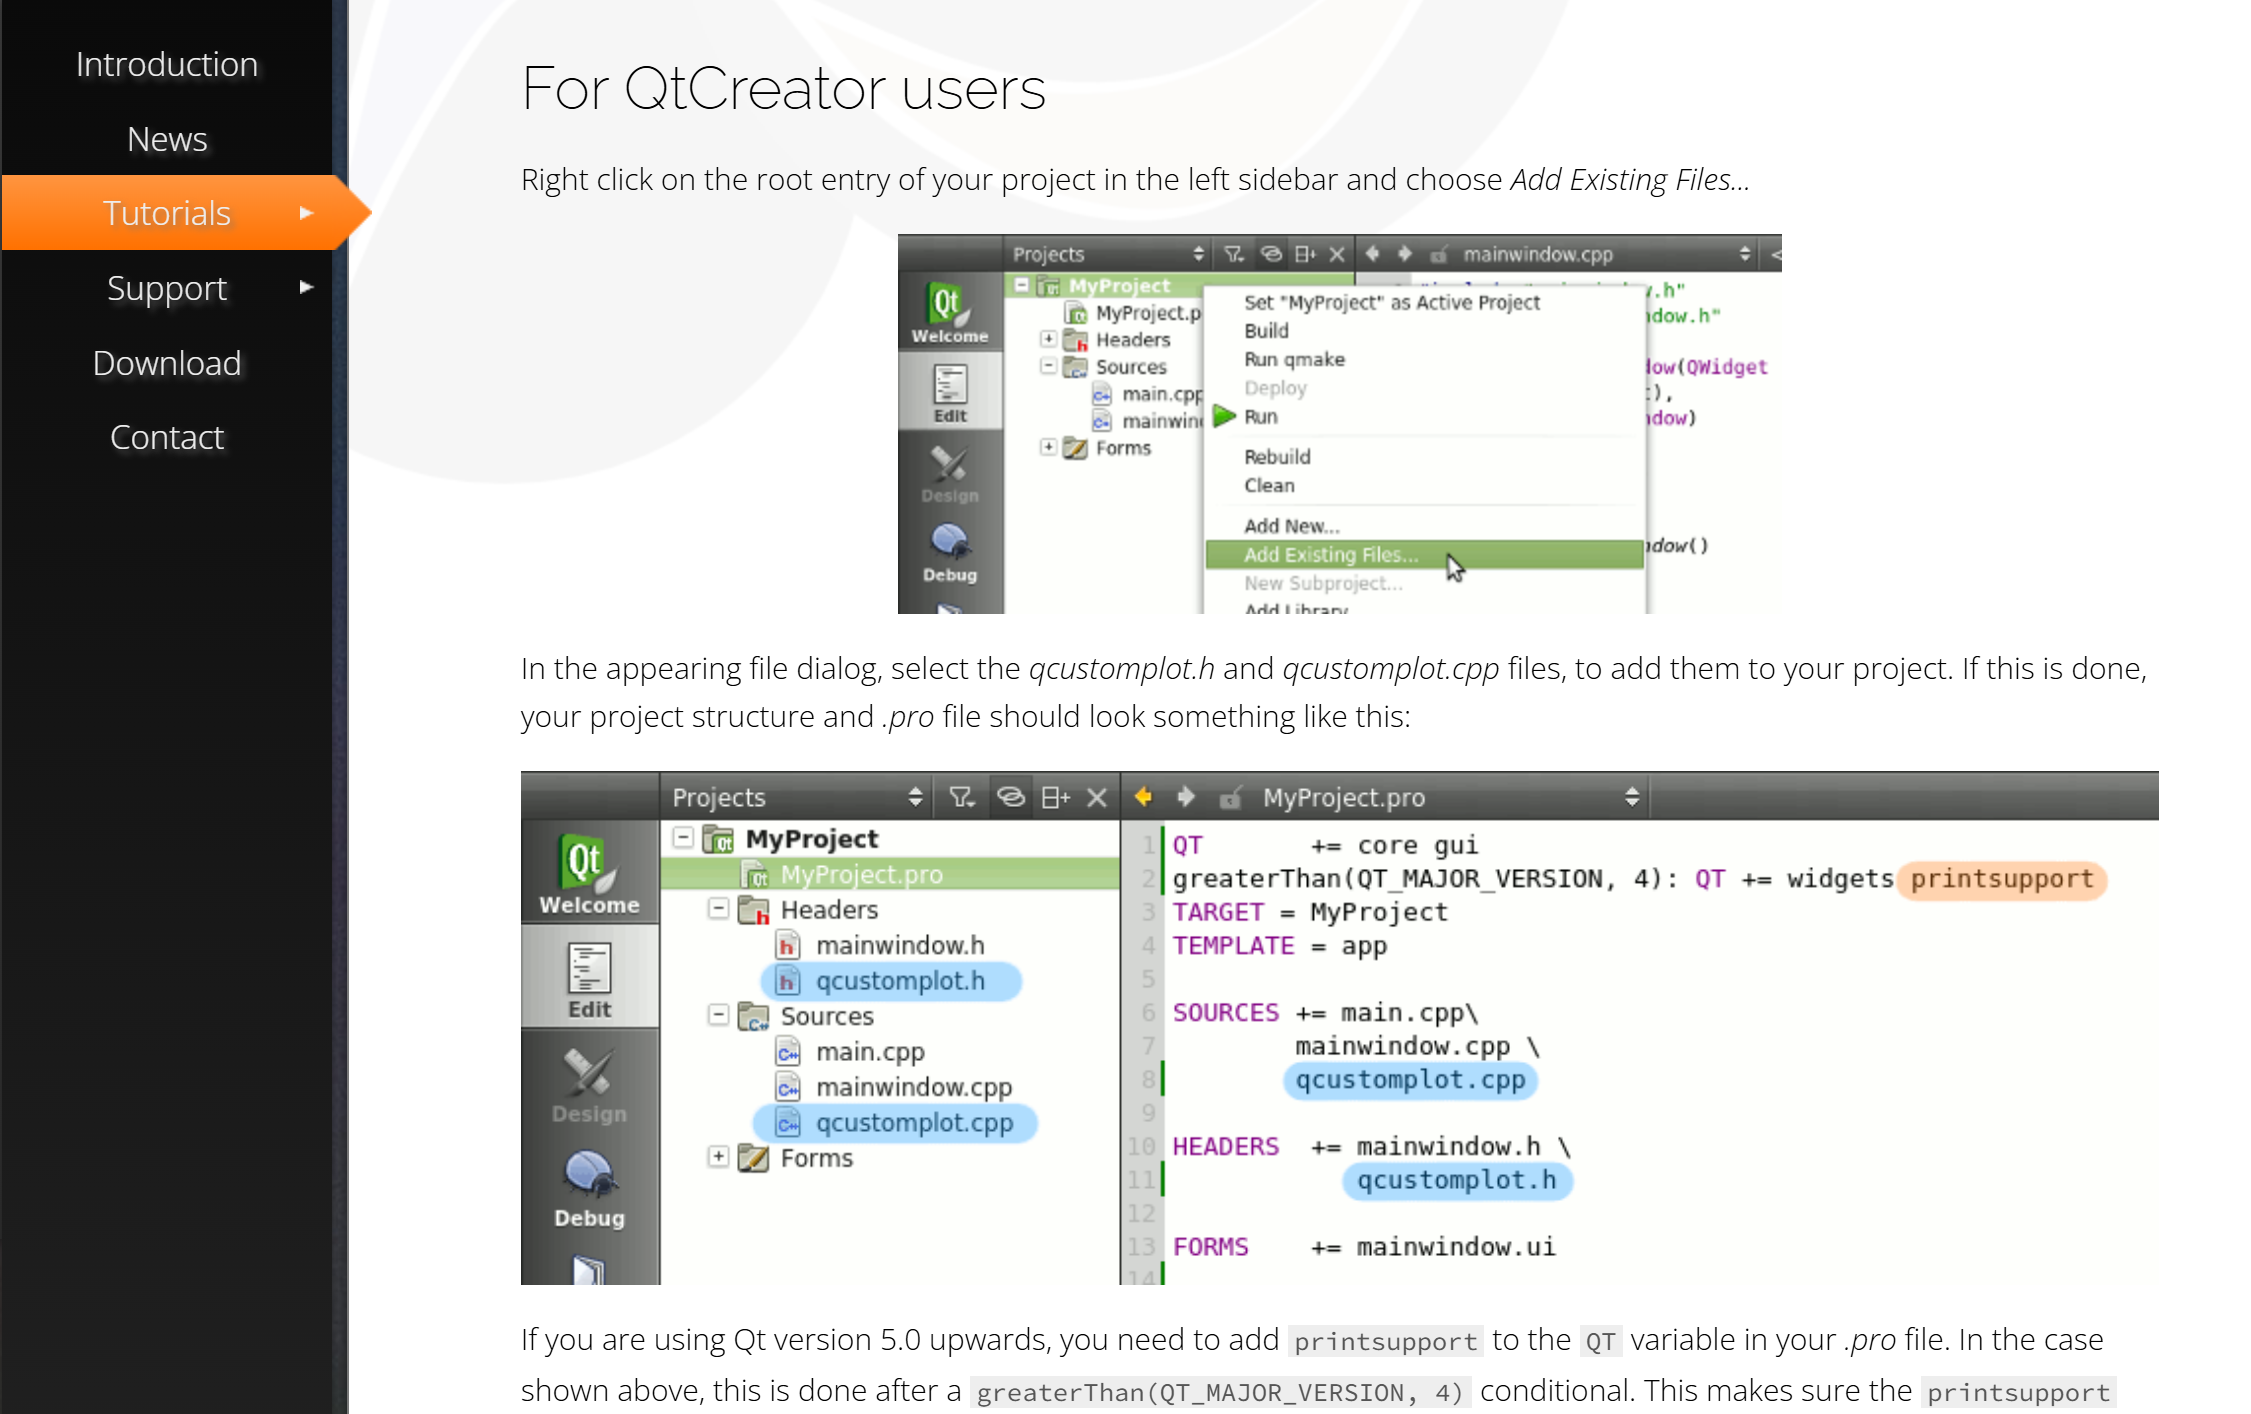
下载压缩包,解压后将qcustomplot.h和qcustomplot.cpp文件添加到项目中
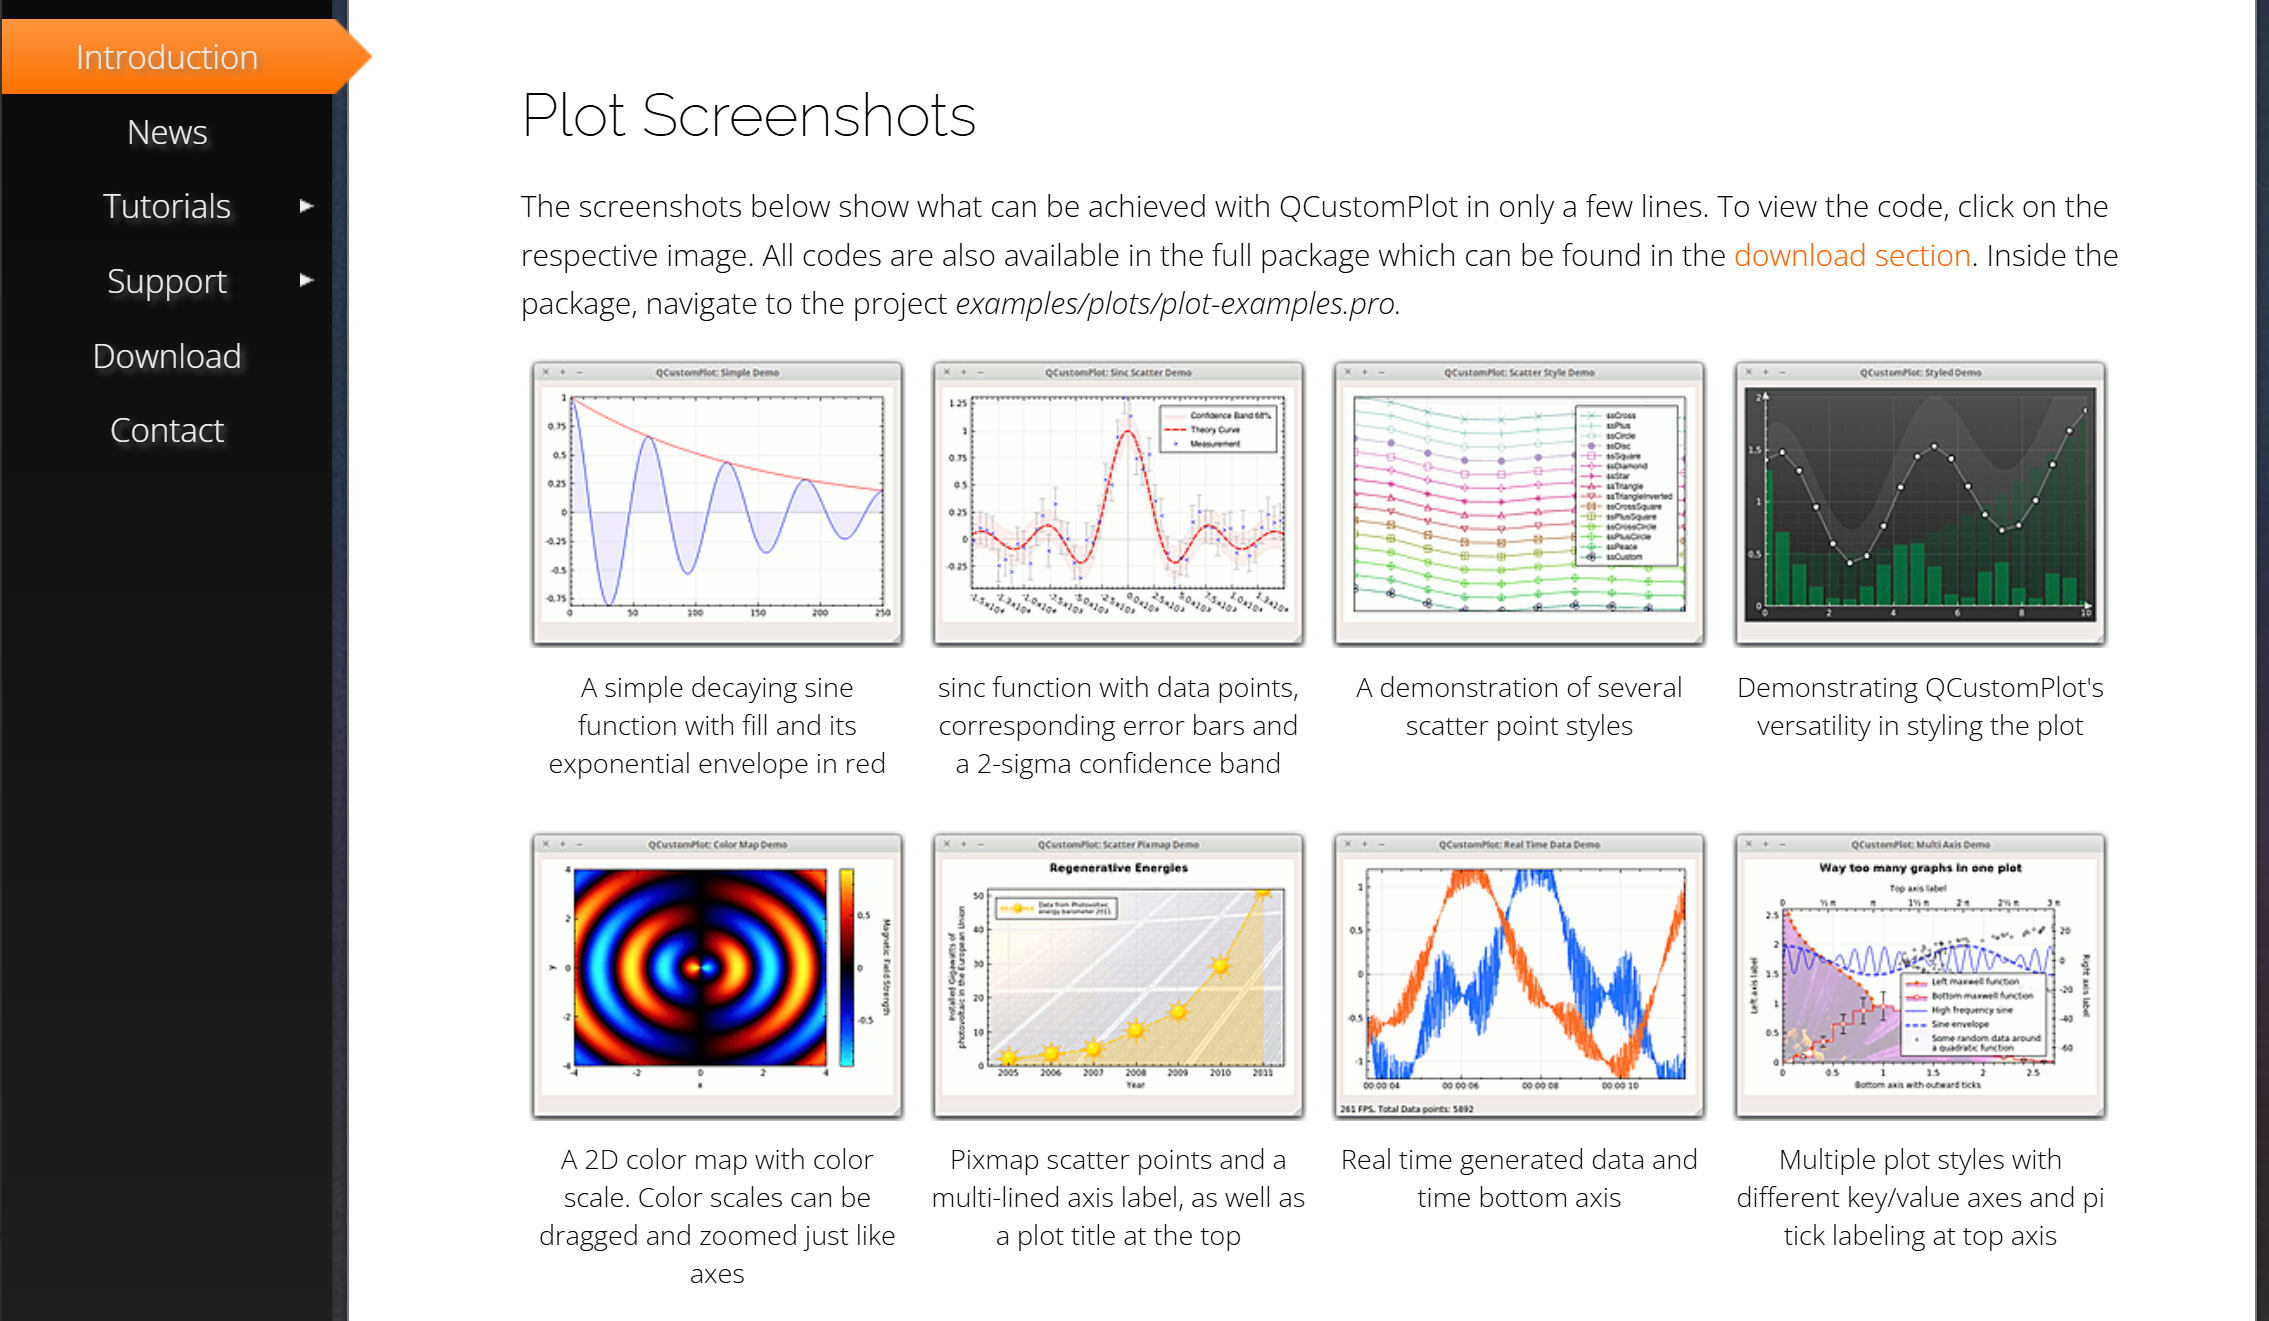
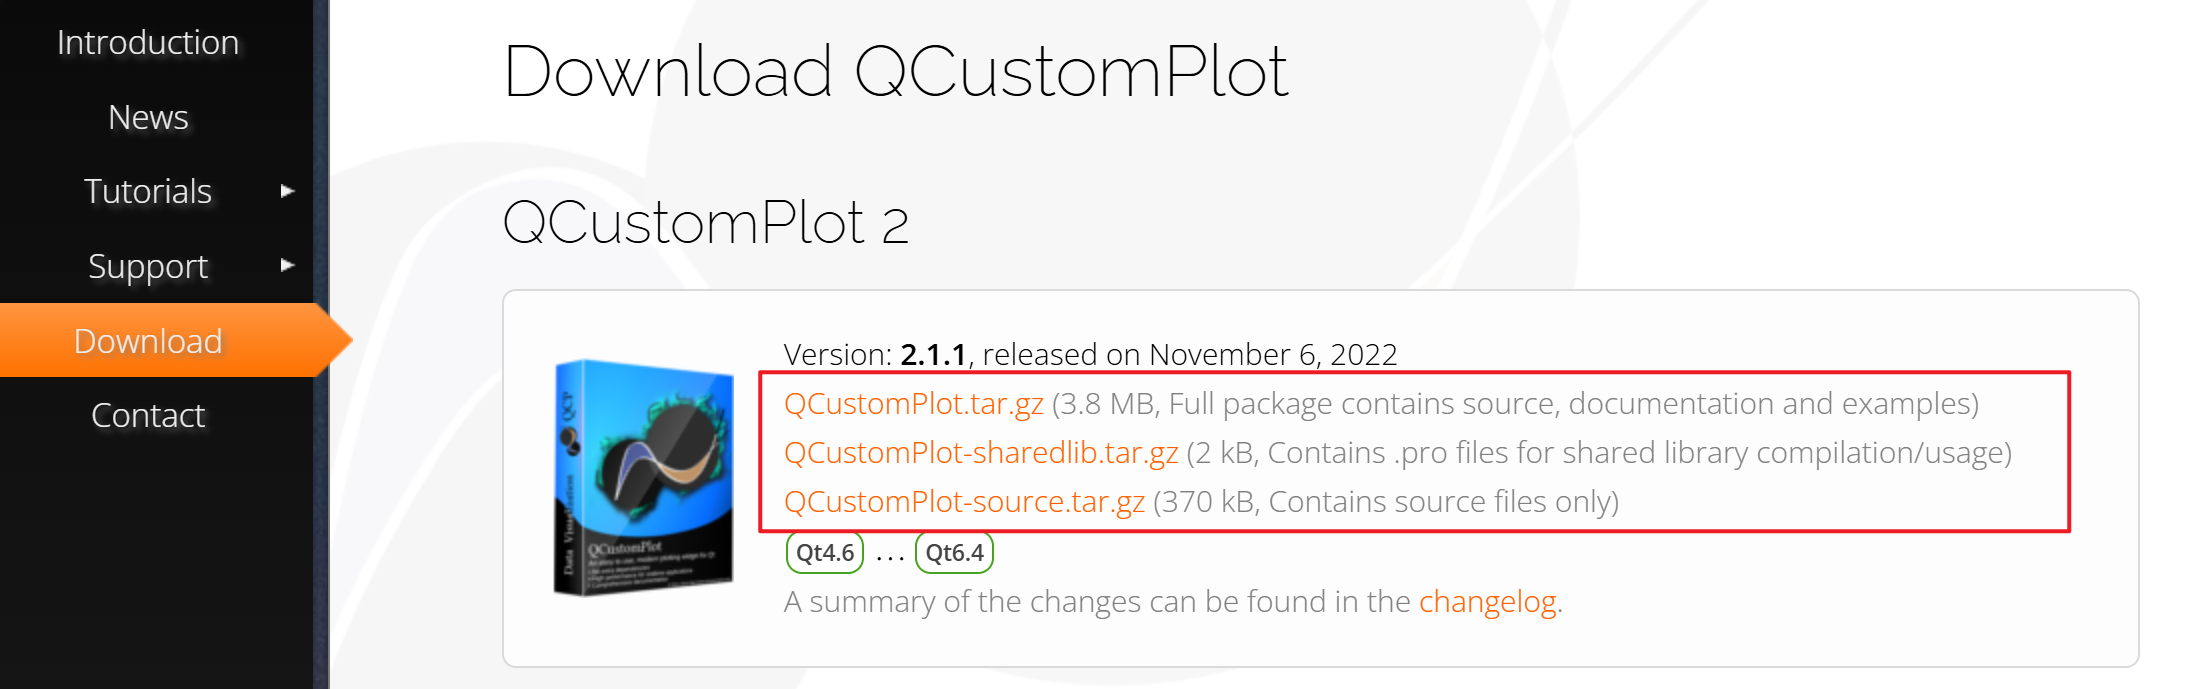
如何引入项目
二、代码实现
widget.h
#ifndef WIDGET_H
#define WIDGET_H

#include <QWidget>

QT_BEGIN_NAMESPACE
namespace Ui {
class Widget;
}
QT_END_NAMESPACE

class Widget : public QWidget
{
    Q_OBJECT

public:
    Widget(QWidget *parent = nullptr);
    ~Widget();

private:
    Ui::Widget *ui;
};
#endif // WIDGET_H
widget.cpp
#include "widget.h"
#include "ui_widget.h"
#include "qcustomplot.h"
#include "QBrush"
#include <QVector>
#include <QtGlobal>
Widget::Widget(QWidget *parent)
: QWidget(parent)
, ui(new Ui::Widget)
{
ui->setupUi(this);
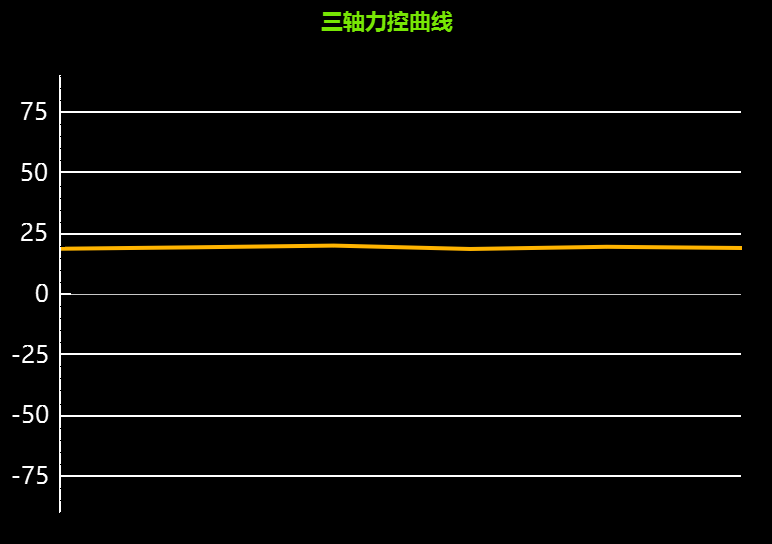
/*折线图创建*/
ui->charts->setStyleSheet("background-color: black;");
// 创建主布局(仅放折线图),谁是容器就把哪个传进去
QVBoxLayout *chartLayout = new QVBoxLayout(ui->charts);
chartLayout ->setContentsMargins(0, 0, 0, 0); // 边缘留白
chartLayout->setSpacing(0);
// 创建QCustomPlot实例(核心绘图控件)
QCustomPlot *plot = new QCustomPlot(this);
chartLayout ->addWidget(plot);
/*图表样式*/
// 1. 图表背景:纯黑色
plot->setBackground(Qt::black);
// 2. 标题设置(2.1.1 正确用法:setDefaultTextColor + setFont)
plot->plotLayout()->insertRow(0); // 插入标题行
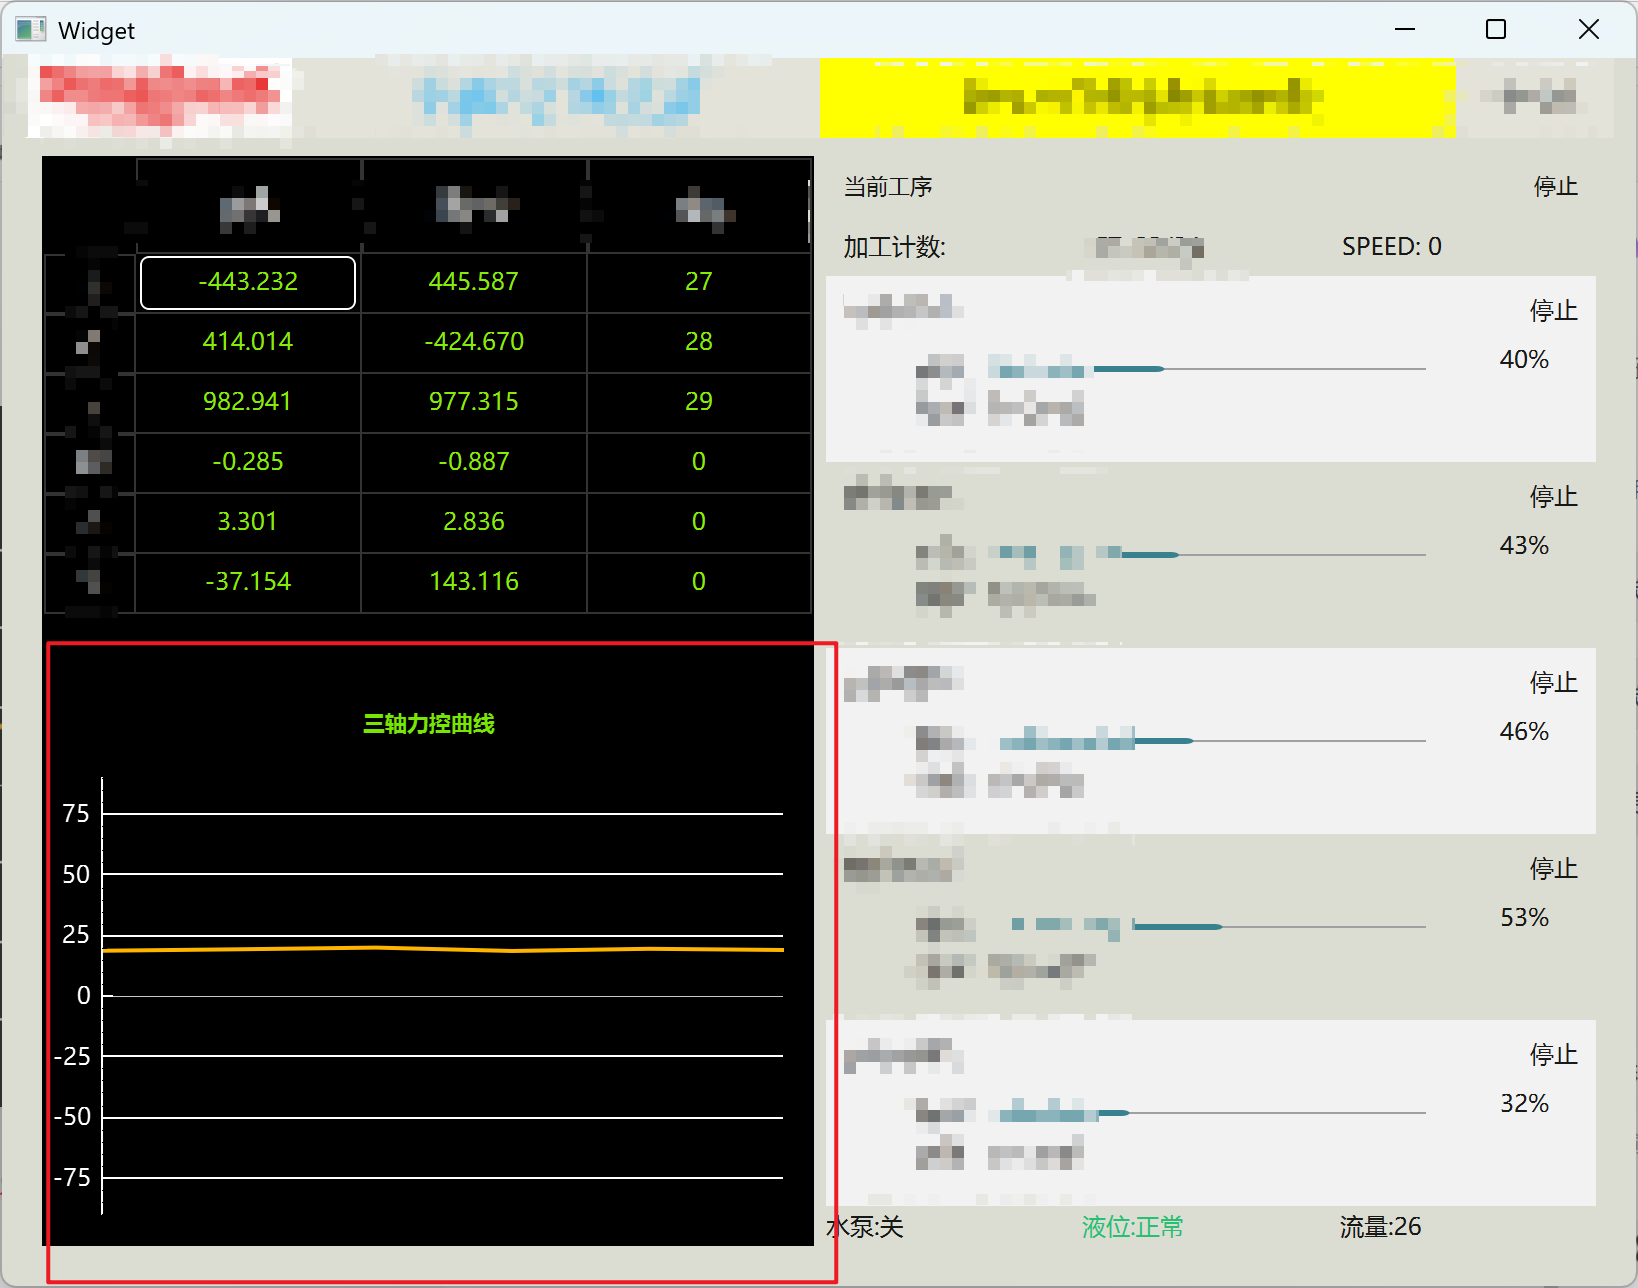
QCPTextElement *title = new QCPTextElement(plot, "三轴力控曲线");
title->setTextColor(QColor(119, 230, 4));//表格标题颜色
title->setFont(QFont("Microsoft YaHei", 8, QFont::Bold)); // 加粗字体
plot->plotLayout()->addElement(0, 0, title); // 标题居中
// 3. X/Y 轴配置
QCPAxis *xAxis = plot->xAxis;
QCPAxis *yAxis = plot->yAxis;
// 刻度文字 + 刻度线:白色
xAxis->setTickLabelColor(Qt::white);
yAxis->setTickLabelColor(Qt::white);
// 轴范围
yAxis->setRange(-80, 80);
// 网格线:白色虚线
yAxis->grid()->setPen(QPen(Qt::white, 1, Qt::SolidLine));
xAxis->grid()->setVisible(false);// 隐藏 X 轴网格线(横向网格)
yAxis->grid()->setVisible(true);
xAxis->setVisible(false); // 整体隐藏 X 轴(最关键)
// 隐藏坐标轴线条 + 轴标签
xAxis->setBasePen(QPen(Qt::NoPen));//x轴不显示
yAxis->setBasePen(QPen(Qt::white, 0.8, Qt::SolidLine));//y轴样式
xAxis->setLabel("");//轴标签
yAxis->setLabel("");
// yAxis->setTickLengthIn(20);//轴的刻度长度
// yAxis->setTickLengthOut(20);//轴的刻度长度
yAxis->setTickPen(QPen(Qt::white, 0.8, Qt::SolidLine));//刻度样式
// 隐藏图例(单曲线无需显示)
plot->legend->setVisible(false);
/*绘制曲线*/
QVector<double> xData, yData;
// 生成 X=0~100 的数据,Y 在 19~21 之间波动(模拟稳定力控)
for (int i = 0; i <= 100; ++i) {
xData.append(i);
yData.append(20 + (rand() % 20 - 10) * 0.1);
}
// 创建曲线(2.1.1 支持 setPen 直接设置颜色和线宽)
QCPGraph *graph = plot->addGraph();
graph->setPen(QPen(QColor(255, 180, 0), 2)); // 橙黄色,线宽2(抗锯齿后更平滑)
graph->setData(xData, yData); // 绑定数据
}
Widget::~Widget()
{
delete ui;
}


 4562
4562

 被折叠的 条评论
为什么被折叠?
被折叠的 条评论
为什么被折叠?
 到【灌水乐园】发言


