


安装部署:
#centos/redhat
yum install gnuplot
#macos
brew install gnuplot
#ubuntu
sudo apt install gnuplot
数据文件
ashe@macos:~/data/test/test_gnuplott $ cat t1.txt
1     1   2.1
2     4   4.5
3     900   6
4    16   8
5    25   10
6    36   11
7    49   12
8    64   13
9    81   14
10  100   15
双曲线
plot 't1.txt' using 1:2 with linespoints title 'a' ,'t1.txt' using 1:3 with linespoints title 'b'

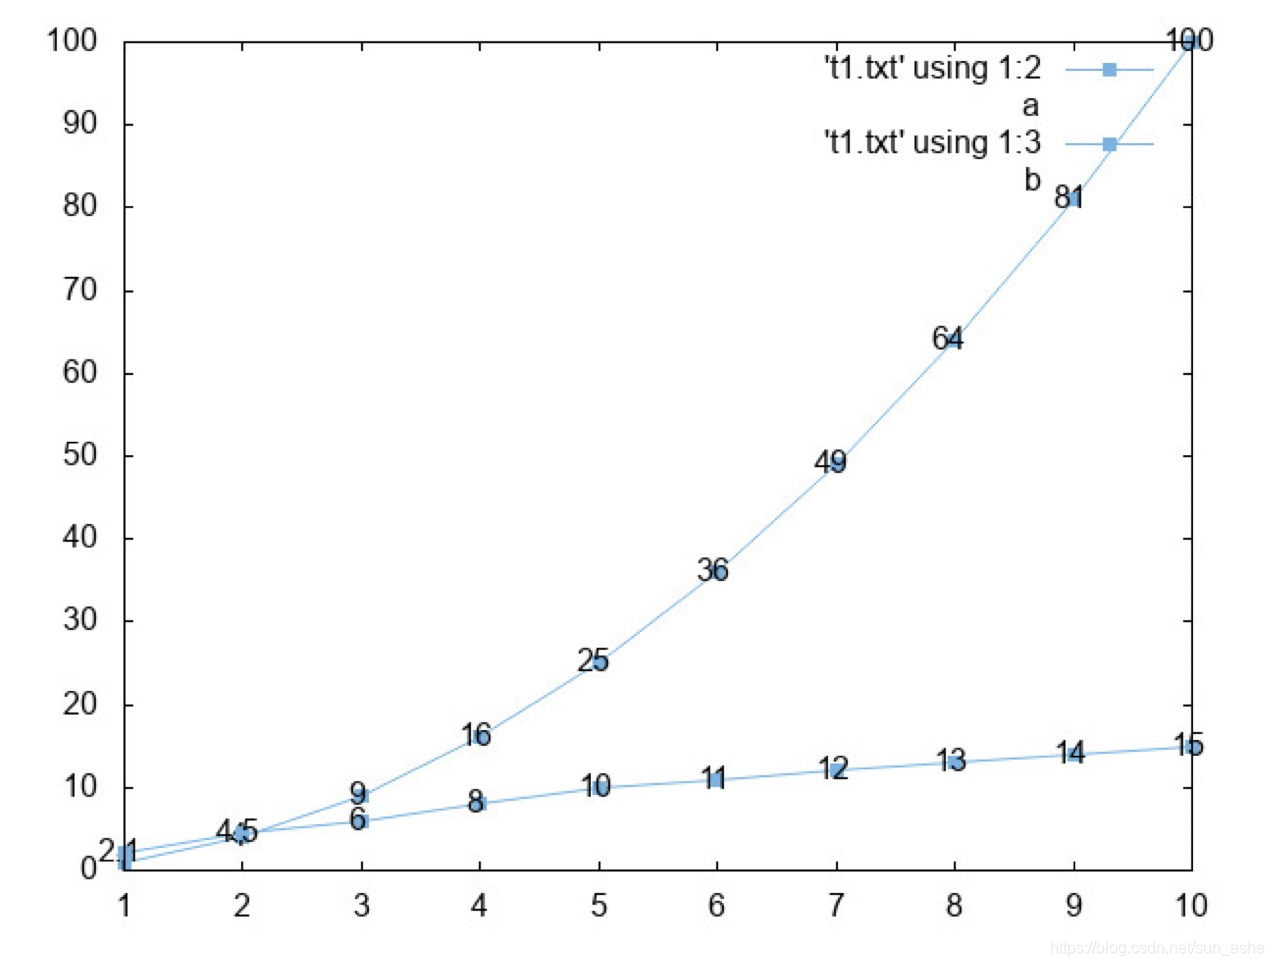
带纵坐标值的双曲线
plot "t1.txt" using 1:2 with linespoints linecolor 3 linewidth 1 pointtype 5 pointsize 1, "" using 1:2:2 with labels title 'a',"t1.txt" using 1:3 with linespoints linecolor 3 linewidth 1 pointtype 5 pointsize 1, "" using 1:3:3 with labels title 'b'

shell一键执行获取图片
ashe@macos:~/data/test/test_gnuplott $ gnuplot -e "set terminal jpeg;set output 'ashe.jpeg';plot 't1.txt' using 1:2 with linespoints linecolor 3 linewidth 1 pointtype 5 pointsize 1, '' using 1:2:2 with labels title 'a','t1.txt' using 1:3 with linespoints linecolor 3 linewidth 1 pointtype 5 pointsize 1, '' using 1:3:3 with labels title 'b'"

gnuplot -e "set xlabel 'threads';set ylabel 'tps'; set key top left;set size ratio 0.7;set terminal png;set output 'ashe.png';plot 'res-1.txt' using 1:2:2 with labels title '', '' using 1:2 with linespoints linecolor 3 linewidth 1 pointtype 5 pointsize 0.2 title 'disk-m','res-2.txt' using 1:2:2 with labels title '', '' using 1:2 with linespoints linecolor 5 linewidth 1 pointtype 5 pointsize 0.2 title 'disk-ssd'"


 5800
5800

 被折叠的 条评论
为什么被折叠?
被折叠的 条评论
为什么被折叠?
 到【灌水乐园】发言


