


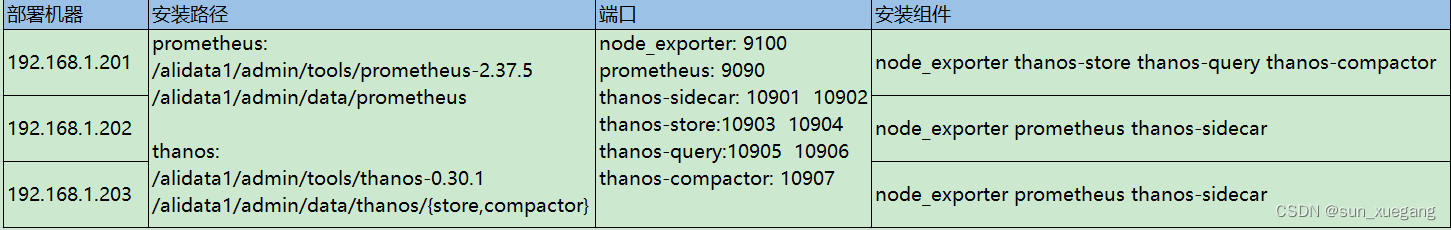
1.基本信息
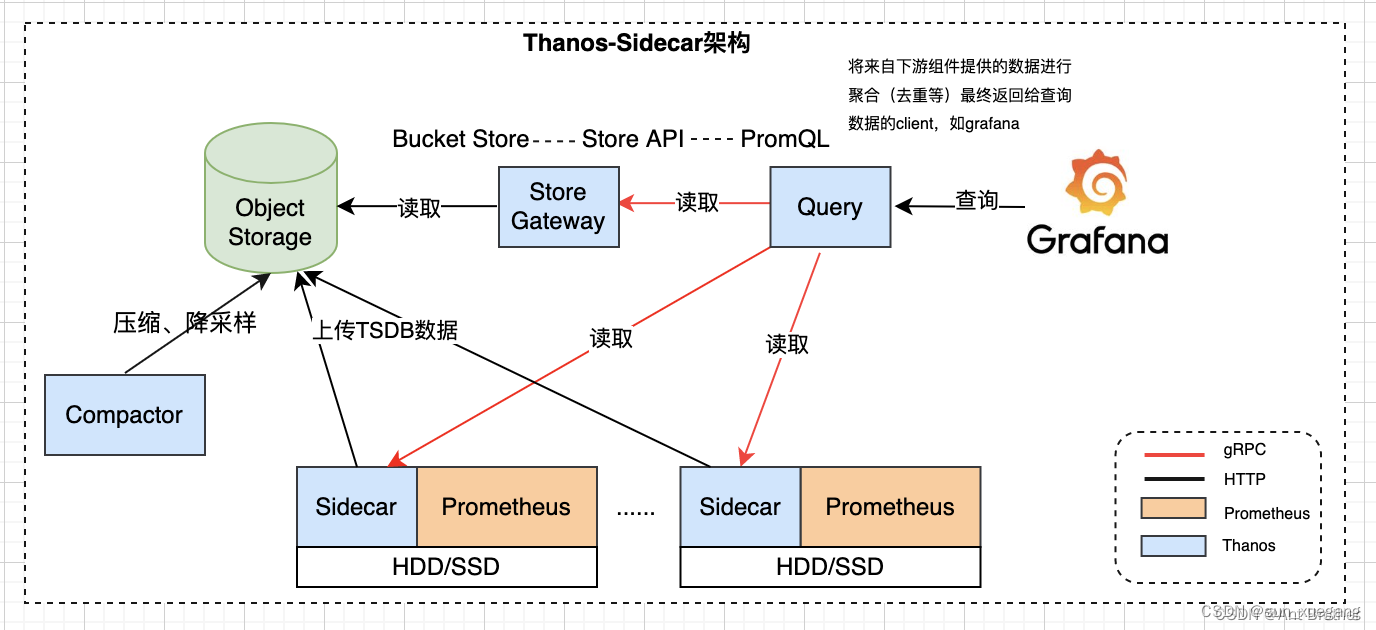
2.架构图
 解释:
解释:
- Prometheus: 是一个开源监控解决方案, 用于收集和聚合指标作为时间序列数据
- Thanos Sidecar: 需要和Prometheus安装在一起,其作用是 (1) 获取prometheus的数据供query查询 (2)每两小时会将prometheus收集的数据同步到对象存储。
- Thanos Store: 主要提供查询历史数据功能, 当 Thanos Query 组件调用 Thanos Stroe 接口, Stroe 再通过对象存储接口获取数据, 并将存储数据转换成 Query 所需的数据格式。其主要充当 API 网关,因此不需要大量的本地磁盘空间。
- Thanos Query: 其实就是查询入口, 之前查询prometheus 客户端不再去查询promethues, 而是经过Thanos Query去查询后端其他的数据。
- Thanos Compactor: Thanos 的数据处理组件,用来将监控数据降准和压缩
3. 安装
3.1 安装node_exporter
## 1. 将二进制包拷贝到 服务器 /usr/bin/node_exporter   ## 版本1.2.2  低版本不支持账密
## 2. 配置账密
# mkdir /etc/node_exporter
# cat /etc/node_exporter/config.yml   ##  默认账密:  admin/FE8P_5Vne_8K_KaVX6Myw
basic_auth_users:
  admin: $2y$10$2v0gUMiNMJ7GNvQzAPjBXOQn8M4FeTneQT83bb6IZbxckkqVTETm2

## 3.设为开机自启
# cat /etc/systemd/system/node_exporter.service
[Unit]
Description=Node_exporter Service
After=network.target

[Service]
User=root
Group=root
Type=simple
ExecStart=/usr/bin/node_exporter --web.listen-address=:9100 --web.config=/etc/node_exporter/config.yml
ExecStop=pkill -9 /usr/bin/node_exporter
Restart=on-failure

[Install]
WantedBy=multi-user.target

## 开机自启动
# systemctl enable --now node_exporter.service

## 4. 验证
# curl -u admin:FE8P_5Vne_8K_KaVX6Myw 127.0.0.1:9100/metrics
3.2 安装Prometheus
## 1. 将安装包上传到服务器 并解压
# pwd
/alidata1/admin/tools/prometheus-2.37.5
## 2. 修改配置文件
# cat prometheus.yml |grep -v "^#"
global:
scrape_interval: 15s # Set the scrape interval to every 15 seconds. Default is every 1 minute.
evaluation_interval: 15s # Evaluate rules every 15 seconds. The default is every 1 minute.
external_labels:
label: 1
alerting:
alertmanagers:
- static_configs:
- targets:
rule_files:
scrape_configs:
- job_name: "prometheus"
static_configs:
- targets: ["192.168.1.202:9090"]
- job_name: 'node'
static_configs:
- targets: ['192.168.1.202:9100', '192.168.1.201:9100']
basic_auth:
username: admin
password: FE8P_5Vne_8K_KaVX6Myw
## 注意: global.external_labels 必须存在 里面的键值对可以自定义 否则sidecar启动失败
## 3.设为开机自启动
# cat /etc/systemd/system/prometheus.service
[Unit]
Description=Prometheus
After=network.target
[Service]
SyslogIdentifier=prometheus
Type=simple
User=admin
Group=admin
ExecStart=/alidata1/admin/tools/prometheus-2.37.5/prometheus --config.file=/alidata1/admin/tools/prometheus-2.37.5/prometheus.yml --storage.tsdb.path=/alidata1/admin/data/prometheus --storage.tsdb.max-block-duration=2h --storage.tsdb.min-block-duration=2h --storage.tsdb.retention.time=2h --web.enable-lifecycle
Restart=on-failure
RestartSec=10
[Install]
WantedBy=multi-user.target
## 设置为开机自启
# systemctl enable --now prometheus
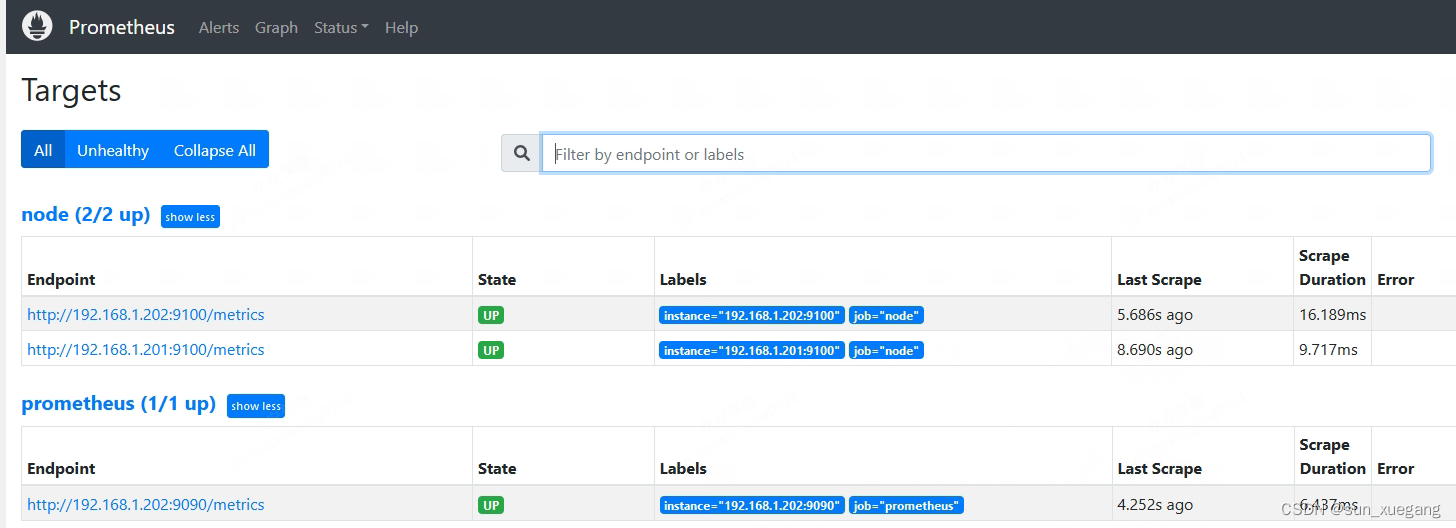
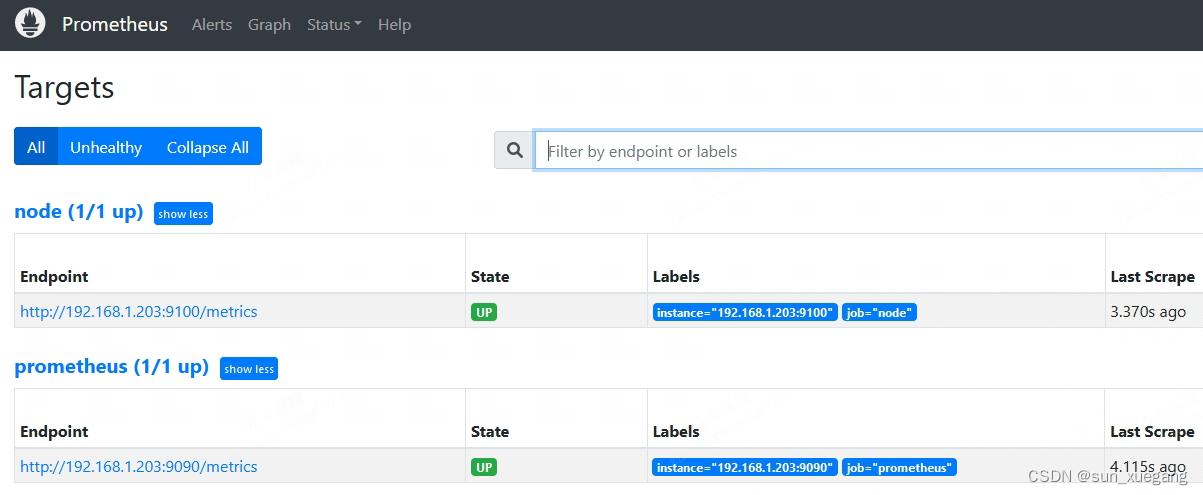
## 4.另一台安装类似, 登录webUI查看
192.168.1.202:9090 19.168.1.203:9090
3.3 安装thanos-sidecar
## thanos各组件使用的是同一个二进制包 只是启动参数不同
# pwd
/alidata1/admin/tools/thanos-0.30.1
# tree
.
├── bin
│      └── thanos                    ## 二进制包
└── conf
        └── store.yaml               ## 对象存储的认证文件

## 1.对象存储配置模板
(1) 如果是阿里云
type: ALIYUNOSS
config:
  endpoint: "{{ thanos_bucket_endpoint }}"
  bucket: "{{ thanos_bucket_name }}"
  access_key_id: "{{ thanos_bucket_ak }}"
  access_key_secret: "{{ thanos_bucket_sk }}"

(2) 如果是腾讯云
type: COS
config:
  bucket: "{{ thanos_bucket_name }}"
  region: "{{ thanos_bucket_region}}"
  app_id: "{{ thanos_bucket_appid}}"
  secret_key: "{{ thanos_bucket_skey }}"
  secret_id: "{{ thanos_bucket_sid }}"

(3) 如果是AWS或者华为云 type均是S3
type: S3
config:
  bucket: "{{ thanos_bucket_name }}"
  endpoint: "{{ thanos_bucket_aws_endpoint }}"
  region: "{{ thanos_bucket_aws_region }}"
  aws_sdk_auth: false
  access_key: "{{ thanos_bucket_aws_ak }}"
  insecure: false
  signature_version2: false
  secret_key: "{{ thanos_bucket_aws_sk }}"
  put_user_metadata: {}
  http_config:
    idle_conn_timeout: 1m30s
    response_header_timeout: 2m
    insecure_skip_verify: false
    tls_handshake_timeout: 10s
    expect_continue_timeout: 1s
    max_idle_conns: 100
    max_idle_conns_per_host: 100
    max_conns_per_host: 0
    tls_config:
      ca_file: ""
      cert_file: ""
      key_file: ""
      server_name: ""
      insecure_skip_verify: false
    disable_compression: false
  trace:
    enable: false
  list_objects_version: ""
  bucket_lookup_type: auto
  part_size: 67108864
  sse_config:
    type: ""
    kms_key_id: ""
    kms_encryption_context: {}
    encryption_key: ""
  sts_endpoint: ""
prefix: ""

## 2. 设为开机自启
# cat /etc/systemd/system/thanos-sidecar.service
[Unit]
Description=Thanos Sidecar
After=network.target

[Service]
User=admin
Group=admin
ExecStart=/alidata1/admin/tools/thanos-0.30.1/bin/thanos sidecar --prometheus.url=http://192.168.1.202:9090 --tsdb.path=/alidata1/admin/data/prometheus --objstore.config-file=/alidata1/admin/tools/thanos-0.30.1/conf/store.yaml --grpc-address=192.168.1.202:10901 --http-address=192.168.1.202:10902 --log.level=error

Restart=on-failure
[Install]
WantedBy=multi-user.target

# systemctl enable --now thanos-sidecar.service

## 等待一段时间后 在对象存储中会发现已经有相应的文件
3.4 安装thanos-store
## 1. 目录结构和 thanos-sidecar一致
## 2. 设置开机自启
# cat /etc/systemd/system/thanos-store.service
[Unit]
Description=Thanos Store
After=network.target

[Service]
User=admin
Group=admin
ExecStart=/alidata1/admin/tools/thanos-0.30.1/bin/thanos store --data-dir=/alidata1/admin/data/thanos/store --objstore.config-file=/alidata1/admin/tools/thanos-0.30.1/conf/store.yaml --http-address=192.168.1.201:10904 --grpc-address=192.168.1.201:10903 --log.level=error

Restart=on-failure
[Install]
WantedBy=multi-user.target

# systemctl enable --now thanos-store

## 3. 登录webUI验证,  这是已经存在一段时间后的截图
http://192.168.1.201:19094

3.5 安装thanos-query
## 1. 目录结构和 thanos-sidecar一致
## 2. 设置开机自启
# cat /etc/systemd/system/thanos-query.service
[Unit]
Description=Thanos Query
After=network.target
[Service]
User=admin
Group=admin
ExecStart=/alidata1/admin/tools/thanos-0.30.1/bin/thanos query --http-address=192.168.1.201:10906 --grpc-address=192.168.1.201:10905 --store=192.168.1.202:10901 --store=192.168.1.203:10901 --store=192.168.1.201:10903 --query.replica-label "replica" --query.replica-label "region" --log.level=error
Restart=on-failure
[Install]
WantedBy=multi-user.target
# systemctl enable --now thanos-query.service
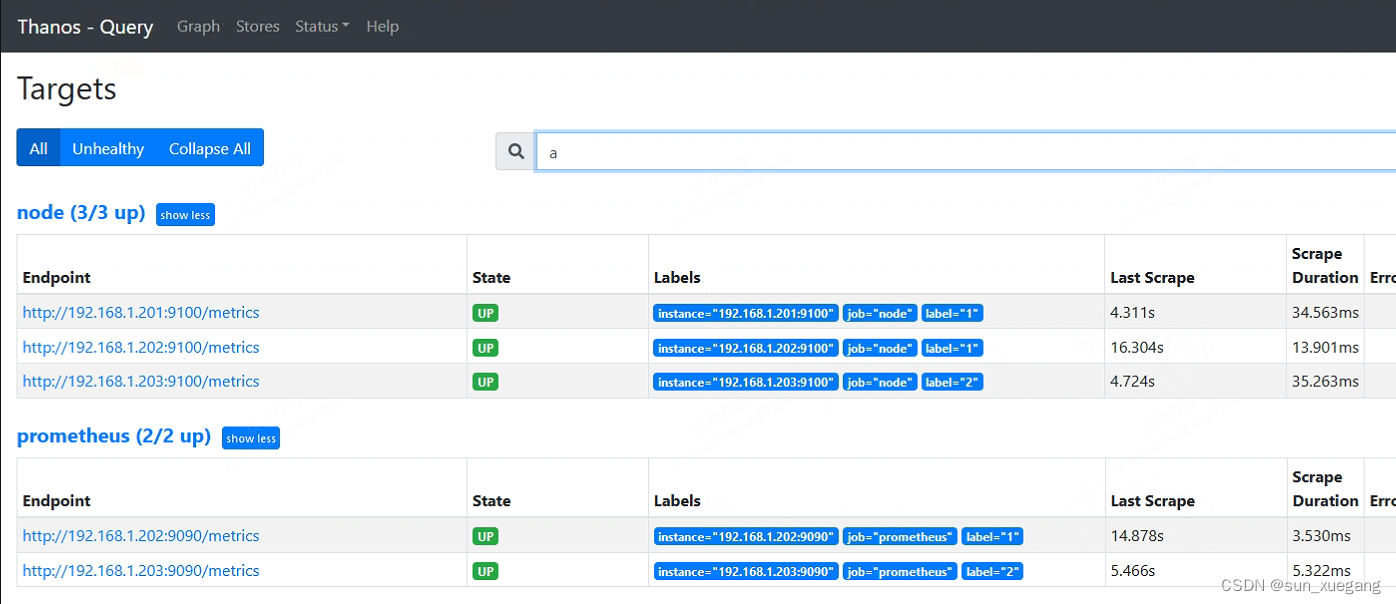
## 3.登录webUI验证, 可以发现2个prometheus的显示在一个界面上
http://192.168.1.201:10906
3.6 安装thanos-compactor
## 1. 目录结构和 thanos-sidecar一致
## 2. 设置开机自启
# cat /etc/systemd/system/thanos-compactor.service
[Unit]
Description=Thanos Compactor
After=network-online.target
[Service]
User=admin
Group=admin
ExecStart=/alidata1/admin/tools/thanos-0.30.1/bin/thanos compact --http-address=192.168.1.201:10907 --data-dir=/alidata1/admin/data/thanos/compactor --objstore.config-file=/alidata1/admin/tools/thanos-0.30.1/conf/store.yaml --wait --log.level=error
Restart=on-failure
[Install]
WantedBy=multi-user.target
# systemctl enable --now thanos-compactor.service
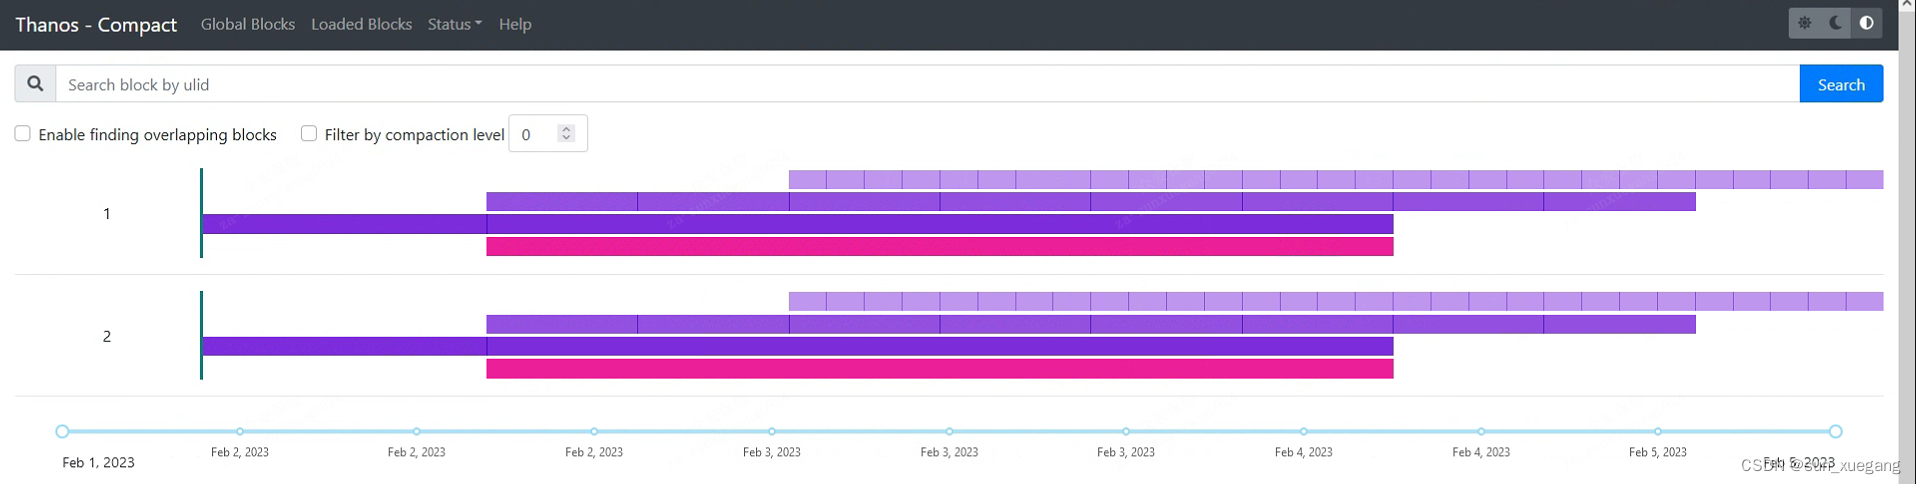
## 3. 登录webUI验证, 出来第一行其他的行表示已经被compactor处理过的数据, 这个组件在本地对数据进行存储,所以也需要较大的数据盘
http://192.168.1.201:19097
3.7 安装grafana
## 1.上传安装包并解压
# pwd
/alidata1/admin/tools/grafana-9.3.6
# ls
bin  conf  LICENSE  NOTICE.md  plugins-bundled  public  README.md  scripts  VERSION

## 2.修改配置:主要修改 数据盘 日志路径 , 内容较多此处不在粘贴

## 3.设置开机自启
# cat /etc/systemd/system/grafana.service
[Unit]
Description=Grafana
After=network.target

[Service]
User=admin
Group=admin
ExecStart=/alidata1/admin/tools/grafana-9.3.6/bin/grafana-server -homepath /alidata1/admin/tools/grafana-9.3.6
Restart=on-failure

[Install]
WantedBy=multi-user.target

# systemctl enable --now grafana.service

## 4. 登录webUI验证  默认账密admin/admin
http://192.168.1.201:3000
4.验证
4.1 添加数据源 --> 选择Prometheus, Name自定义(thanos) URL为thanos-query地址: http://192.168.1.201:10906 --> Save & test
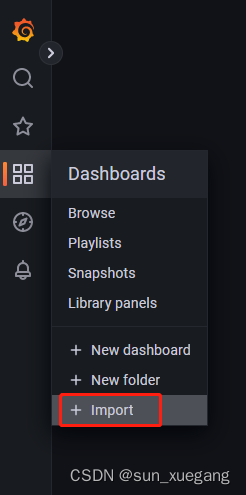
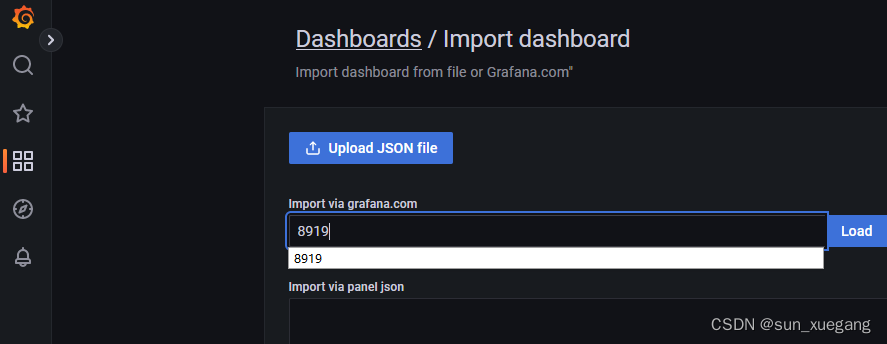
4.2 导入模板, 输入8919, 选择数据源,保存


 2973
2973

 被折叠的 条评论
为什么被折叠?
被折叠的 条评论
为什么被折叠?
 到【灌水乐园】发言


