


Hello,大家好,今天将给大家带来ELK安装部署等相关内容。
ELK是Elasticsearch+Logstash+Kibana的缩写。
E负责索引,存储,搜索。L负责收集。K则负责的是展现。
一、下载
https://www.elastic.co/downloads
Elastic官方下载地址,之前已经在window系统下安装使用过,本次在linux服务器上进行搭建。
window下可以直接下载zip包,解压即可用,真正的开箱即用,确实很强。
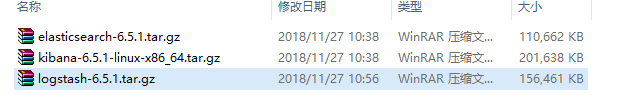
Linux环境下载tar.gz包
这里我们下载好了会是这样子的:
二、安装
安装前,我们确保linux环境已经安装了jdk1.8+
1.Elasticsearch安装
进入文件目录,直接解压elasticsearch-6.5.1.tar.gz
tar -xzf elasticsearch-6.5.1.tar.gz
解压之后我们还需要做一些基本配置,才能正常访问到。
进入elasticsearch配置文件目录
cd elasticsearch-6.5.1/config/
vi elasticsearch.yml
1.修改Cluster,定义集群名称
# ---------------------------------- Cluster -----------------------------------
#
# Use a descriptive name for your cluster:
#
cluster.name: es-cluster
2.修改Node,定义节点名称
# ------------------------------------ Node ------------------------------------
#
# Use a descriptive name for the node:
#
node.name: node-1
#
# Add custom attributes to the node:
#
#node.attr.rack: r1
#
3.修改Paths,定义数据存储目录和日志存储目录
在/data目录下新建es/data和es/logs文件夹
注:在创建文件夹目录的时候一定要控制好文件夹权限。
附文件夹权限修改命令:
xxx为你的用户名
sudo chown xxx:root $dir
# ----------------------------------- Paths ------------------------------------
#
# Path to directory where to store the data (separate multiple locations by comma):
#
path.data: /data/es/data
#
# Path to log files:
#
path.logs: /data/es/logs
4.修改Memory,定义是否锁定内存,一般都设置为false
# ----------------------------------- Memory -----------------------------------
#
# Lock the memory on startup:
#
bootstrap.memory_lock: false
bootstrap.system_call_filter: false
5.修改Network,定义外部访问路径和端口
# ---------------------------------- Network -----------------------------------
#
# Set the bind address to a specific IP (IPv4 or IPv6):
#
network.host: 服务器IP地址
#
# Set a custom port for HTTP:
#
http.port: 9200
修改以上配置之后就可以启动了。
注:因为是单机配置,所以Discovery不需要配置
cd elasticsearch-6.5.1/bin/  #进入bin目录
./elasticsearch                     #普通执行启动命令

因为我们需要后台运行,所以我们用nohup来启动
nohup ./elasticsearch >> /data/es/logs/es.log &
#这样就可以在后台运行elasticsearch,并且日志输出到/data/es/logs/es.log
启动后我们可以直接通过 [服务器IP:9200]通过浏览器访问

2.Kibana安装
kibana安装也很简单,安装三部曲:
1.解压
tar -xzf kibana-6.5.1-linux-x86_64.tar.gz
2.配置
cd kibana-6.5.1-linux-x86_64/config/
vi kibana.yml
列举几个关键修改配置,更多配置参考:kibana详细配置
server.port: 5601
server.host: "服务器IP"
server.name: "kibana"
elasticsearch.url: "http://ES服务IP:9200"  #上面你的elasticsearch服务地址
elasticsearch.preserveHost: true
kibana.index: ".kibana"
修改后保存
3.启动
cd /data/elk/kibana-6.5.1-linux-x86_64/bin/
./kibana
同样的,我们可以用nohup来启动
你将会看到一堆的这样的信息:
 log   [07:56:14.839] [info][status][plugin:kibana@6.5.1] Status changed from uninitialized to green - Ready
  log   [07:56:14.886] [info][status][plugin:elasticsearch@6.5.1] Status changed from uninitialized to yellow - Waiting for Elasticsearch
  log   [07:56:14.889] [info][status][plugin:xpack_main@6.5.1] Status changed from uninitialized to yellow - Waiting for Elasticsearch
  log   [07:56:14.896] [info][status][plugin:searchprofiler@6.5.1] Status changed from uninitialized to yellow - Waiting for Elasticsearch
  log   [07:56:14.901] [info][status][plugin:ml@6.5.1] Status changed from uninitialized to yellow - Waiting for Elasticsearch
  log   [07:56:14.949] [info][status][plugin:tilemap@6.5.1] Status changed from uninitialized to yellow - Waiting for Elasticsearch
  log   [07:56:14.951] [info][status][plugin:watcher@6.5.1] Status changed from uninitialized to yellow - Waiting for Elasticsearch
  log   [07:56:14.969] [info][status][plugin:license_management@6.5.1] Status changed from uninitialized to green - Ready
  log   [07:56:14.971] [info][status][plugin:index_management@6.5.1] Status changed from uninitialized to yellow - Waiting for Elasticsearch
  log   [07:56:14.983] [info][status][plugin:rollup@6.5.1] Status changed from uninitialized to yellow - Waiting for Elasticsearch
  log   [07:56:15.128] [info][status][plugin:timelion@6.5.1] Status changed from uninitialized to green - Ready
  log   [07:56:15.130] [info][status][plugin:graph@6.5.1] Status changed from uninitialized to yellow - Waiting for Elasticsearch
  log   [07:56:15.141] [info][status][plugin:monitoring@6.5.1] Status changed from uninitialized to green - Ready
  log   [07:56:15.146] [info][status][plugin:spaces@6.5.1] Status changed from uninitialized to yellow - Waiting for Elasticsearch
  log   [07:56:15.156] [warning][security] Generating a random key for xpack.security.encryptionKey. To prevent sessions from being invalidated on restart, please set xpack.security.encryptionKey in kibana.yml
  log   [07:56:15.161] [warning][security] Session cookies will be transmitted over insecure connections. This is not recommended.
  log   [07:56:15.169] [info][status][plugin:security@6.5.1] Status changed from uninitialized to yellow - Waiting for Elasticsearch
  log   [07:56:15.192] [info][status][plugin:grokdebugger@6.5.1] Status changed from uninitialized to yellow - Waiting for Elasticsearch
  log   [07:56:15.198] [info][status][plugin:dashboard_mode@6.5.1] Status changed from uninitialized to green - Ready
  log   [07:56:15.201] [info][status][plugin:logstash@6.5.1] Status changed from uninitialized to yellow - Waiting for Elasticsearch
  log   [07:56:15.209] [info][status][plugin:beats_management@6.5.1] Status changed from uninitialized to yellow - Waiting for Elasticsearch
  log   [07:56:15.242] [info][status][plugin:apm@6.5.1] Status changed from uninitialized to green - Ready
[BABEL] Note: The code generator has deoptimised the styling of "/data/elk/kibana-6.5.1-linux-x86_64/node_modules/x-pack/plugins/canvas/canvas_plugin/types/all.js" as it exceeds the max of "500KB".
  log   [07:56:18.182] [info][status][plugin:canvas@6.5.1] Status changed from uninitialized to green - Ready
当你看到[listening]字样的时候,嘿嘿嘿
  log   [07:56:36.345] [info][listening] Server running at http://服务IP:5601
  log   [07:56:37.201] [info][status][plugin:spaces@6.5.1] Status changed from yellow to green - Ready
你就可以到浏览器输入 http://服务IP:5601访问了。
首次访问会有下面这样一个欢迎页,提示说你没数据,要不要搞点简单数据玩玩?
随便你选择哪一种,我反正选的自己玩。


到此,我们kibana也就安装完成咯!
接下来,我们就一起来探索相对麻烦的Logstash吧!!!Gogogo!
3.Logstash安装
安装之前,我们稍微对Logstash进行简单的了解。
Logstash 是开源的服务器端数据处理管道,能够同时从多个来源采集数据,转换数据,然后将数据发送到您最喜欢的 “存储库” 中。(我们的存储库当然是 Elasticsearch。)

Logstash安装很简单,复杂的是配置。
1.解压
tar -xzf logstash-6.5.1.tar.gz
2.配置
Logstash可以说核心部分就是配置了
最难的也是配置!
简单来说,Logstash的配置分为三部分。
一、输入
输入,顾名思义就是日志来源。Logstash有很多的输入插件,本文将会以S3为例。
二、解析/过滤器
解析,是把日志进行过滤,筛选,解析等。本文会用到mutate,ruby,其中ruby是关键。
三、输出/存储
输出,比较简单,我们既然说到ELK,那么当然是输出存储到Elasticsearch。
3.启动
配置完成后,我们启动Logstash
cd /data/elk/logstash-6.5.1/bin/
./logstash
如果你配置好了输入和输出(过滤不是必须设置项),那么你将会在kibana中看到对应的索引数据了。
进入kibana中,可以看到在Index Management中会存在你输出的几个索引文件


进入Index Patterns中,添加索引:

如下图所示,创建索引,成功后我们就可以在Discover等模块进行日志查询了。

由于数据敏感,一些数据部分进行打码处理,请谅解。
关于Logstash的配置部分,我原本是打算在这篇文章一起进行一些说明,考虑篇幅问题,我打算后面单独写一篇文章来进行说明。
那么,本次分享就到这里吧。
大家如果有什么问题欢迎留言。
如果有兴趣了解更多,可以关注我的微信公众号:tanjava


 4032
4032


 被折叠的 条评论
为什么被折叠?
被折叠的 条评论
为什么被折叠?
 到【灌水乐园】发言


