


目录
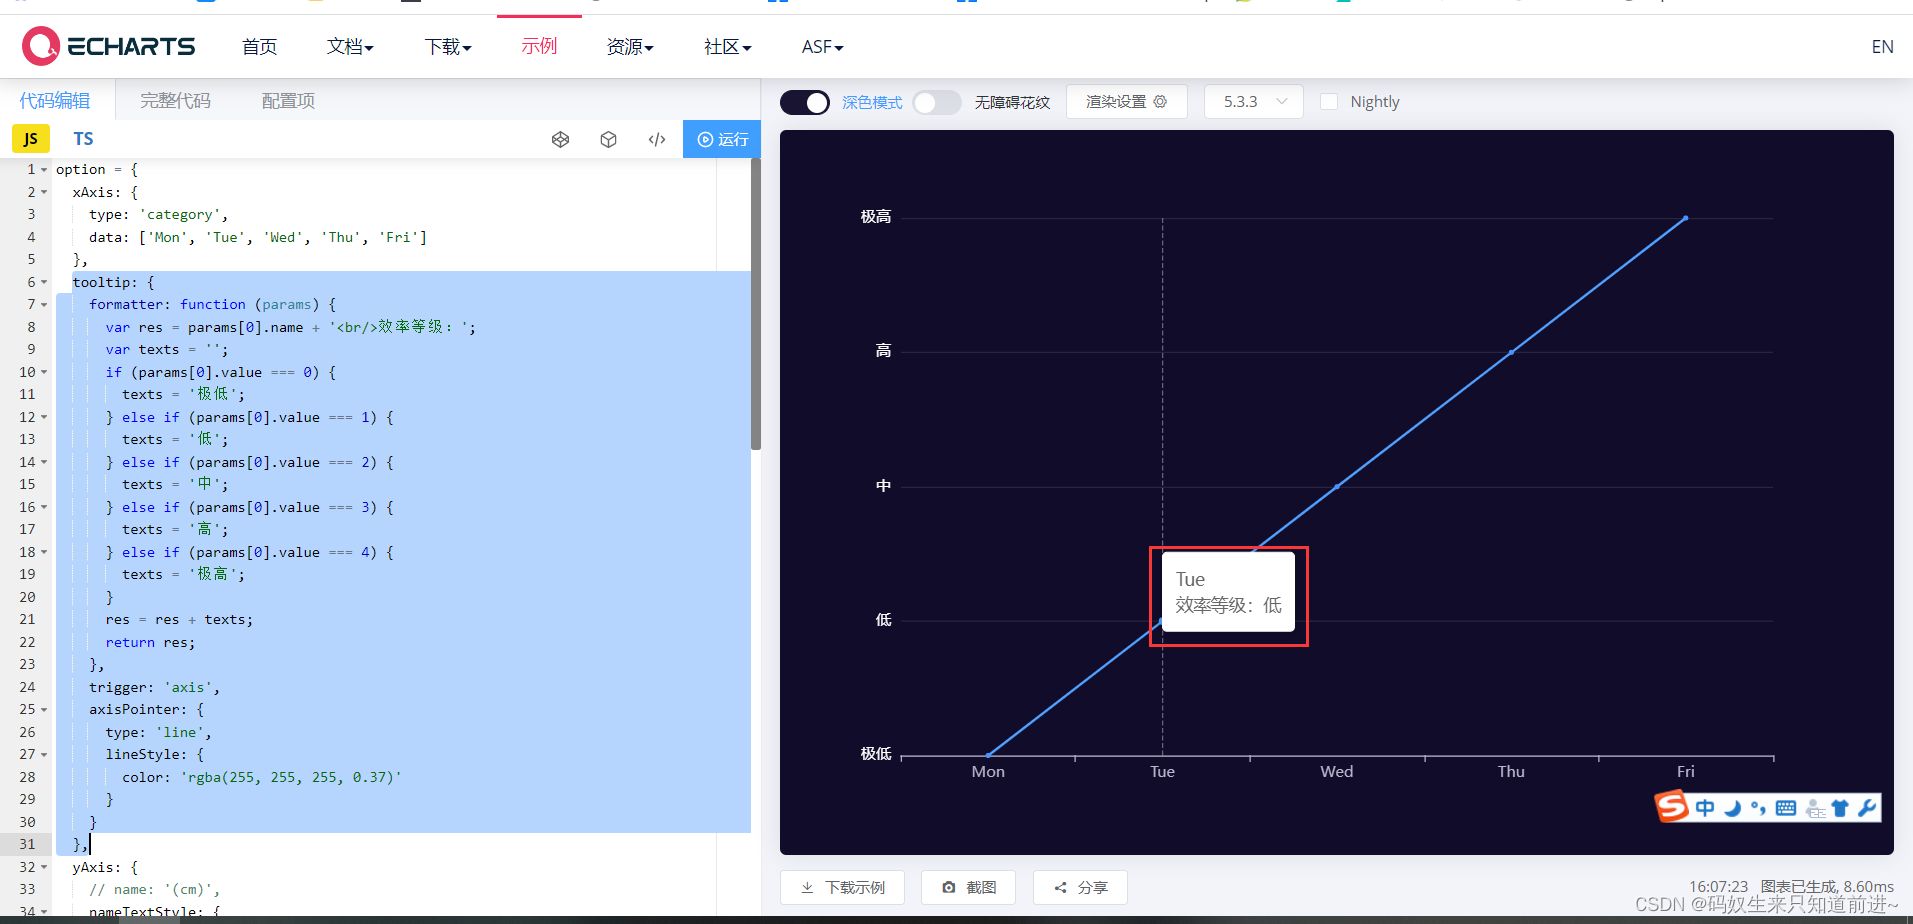
1、悬停显示内容自定义
tooltip: {
    formatter: function (params) {
      var res = params[0].name + '<br/>效率等级:';
      var texts = '';
      if (params[0].value === 0) {
        texts = '极低';
      } else if (params[0].value === 1) {
        texts = '低';
      } else if (params[0].value === 2) {
        texts = '中';
      } else if (params[0].value === 3) {
        texts = '高';
      } else if (params[0].value === 4) {
        texts = '极高';
      }
      res = res + texts;
      return res;
    },
    trigger: 'axis',
    axisPointer: {
      type: 'line',
      lineStyle: {
        color: 'rgba(255, 255, 255, 0.37)'
      }
    }
  }
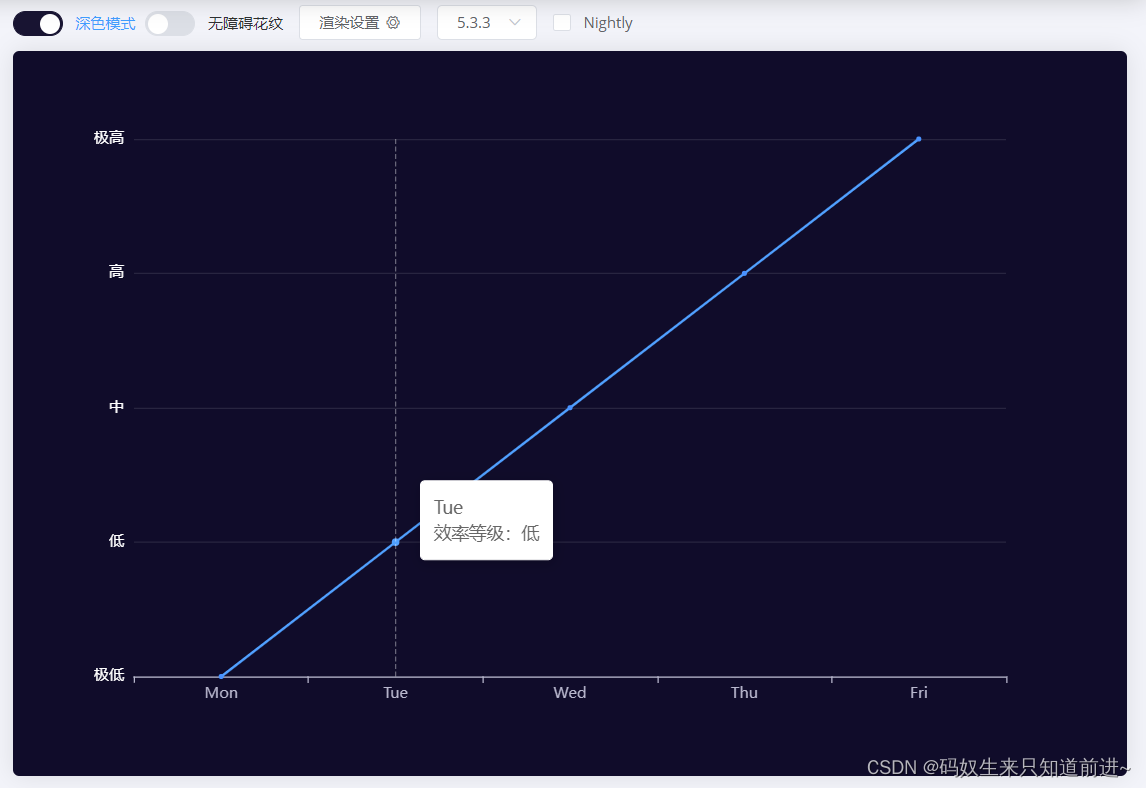
2、设定Y轴显示中文
yAxis: {
    // name: '(cm)',
    nameTextStyle: {
      color: '#fff',
      fontSize: 16
    },
    type: 'value',
    axisTick: {
      // y轴刻度线
      show: false
    },
    splitLine: {
      // 网格线
      show: true,
      lineStyle: {
        color: ['rgba(255, 255, 255, 0.1)'],
        type: 'solid'
      }
    },
    splitArea: { show: false }, // 保留网格区域
    axisLabel: {
      show: true,
      textStyle: {
        color: '#fff'
      },
      // 这里重新定义就可以
      formatter: function (value) {
        var texts = [];
        if (value === 0) {
          texts.push('极低');
        } else if (value === 1) {
          texts.push('低');
        } else if (value === 2) {
          texts.push('中');
        } else if (value === 3) {
          texts.push('高');
        } else if (value === 4) {
          texts.push('极高');
        }
        return texts;
      }
    },
    axisLine: {
      lineStyle: {
        type: 'solid',
        color: 'rgba(255, 255, 255, 0.37)' // 左边线的颜色
      }
    }
  }
3、完整的demo代码
option = {
  xAxis: {
    type: 'category',
    data: ['Mon', 'Tue', 'Wed', 'Thu', 'Fri']
  },
  tooltip: {
    formatter: function (params) {
      var res = params[0].name + '<br/>效率等级:';
      var texts = '';
      if (params[0].value === 0) {
        texts = '极低';
      } else if (params[0].value === 1) {
        texts = '低';
      } else if (params[0].value === 2) {
        texts = '中';
      } else if (params[0].value === 3) {
        texts = '高';
      } else if (params[0].value === 4) {
        texts = '极高';
      }
      res = res + texts;
      return res;
    },
    trigger: 'axis',
    axisPointer: {
      type: 'line',
      lineStyle: {
        color: 'rgba(255, 255, 255, 0.37)'
      }
    }
  },
  yAxis: {
    // name: '(cm)',
    nameTextStyle: {
      color: '#fff',
      fontSize: 16
    },
    type: 'value',
    axisTick: {
      // y轴刻度线
      show: false
    },
    splitLine: {
      // 网格线
      show: true,
      lineStyle: {
        color: ['rgba(255, 255, 255, 0.1)'],
        type: 'solid'
      }
    },
    splitArea: { show: false }, // 保留网格区域
    axisLabel: {
      show: true,
      textStyle: {
        color: '#fff'
      },
      // 这里重新定义就可以
      formatter: function (value) {
        var texts = [];
        if (value === 0) {
          texts.push('极低');
        } else if (value === 1) {
          texts.push('低');
        } else if (value === 2) {
          texts.push('中');
        } else if (value === 3) {
          texts.push('高');
        } else if (value === 4) {
          texts.push('极高');
        }
        return texts;
      }
    },
    axisLine: {
      lineStyle: {
        type: 'solid',
        color: 'rgba(255, 255, 255, 0.37)' // 左边线的颜色
      }
    }
  },
  series: [
    {
      data: [0, 1, 2, 3, 4],
      type: 'line'
    }
  ]
};


 4506
4506


 被折叠的 条评论
为什么被折叠?
被折叠的 条评论
为什么被折叠?
 到【灌水乐园】发言


