


本文为学习笔记,主要用于记录本人学习过程。部分内容为转载!!!!.
ELK快速入门一-基本部署
ELK简介
什么是ELK?通俗来讲,ELK是由Elasticsearch、Logstash、Kibana 三个开源软件组成的一个组合体,这三个软件当中,每个软件用于完成不同的功能,ELK又称ELKstack,官网 https://www.elastic.co/ , ELK主要优点有如下几个:
1、处理方式灵活:elasticsearch是实时全文索引,具有强大的搜索功能
2、配置相对简单:elasticsearch全部使用JSON接口,logstash使用模块配置,kibana的配置文件部分更简单
3、检索性能高:基于优秀的设计,虽然每次查询都是实时,但是也可以达到百亿级数据的查询秒级响应
4、集群线性扩展:elasticsearch和logstash都可以灵活线性扩展
5、前端操作绚丽:kibana的前端设计比较绚丽,而且操作简单
Elasticsearch
elasticsearch是一个高度可扩展全文搜索和分析引擎,基于Apache Lucene 构建,能对大容量的数据进行接近实时的存储、搜索和分析操作,可以处理大规模日志数据,比如Nginx、Tomcat、系统日志等功能。
Logstash
数据收集引擎。它支持动态的从各种数据源搜集数据,并对数据进行过滤、分析、丰富、统一格式等操作,然后存储到用户指定的位置;支持普通log、自定义json格式的日志解析。
Kibana
数据分析和可视化平台。通常与 Elasticsearch 配合使用,对其中数据进行搜索、分析和以统计图表的方式展示。
ELK部署环境准备
这里实验所使用系统CentOS 7.4 x86_64,服务器信息如下。并关闭防火墙和selinux,及host绑定等。本文所使用所有的软件包 下载 提取码:ow1b
| IPAddr | HostName | Mem |
|---|---|---|
| 192.168.1.31 | linux-elk1.exmaple.com | 3G |
| 192.168.1.32 | linux-elk2.exmaple.com | 3G |
epel源配置
# wget -O /etc/yum.repos.d/epel.repo http://mirrors.aliyun.com/repo/epel-7.repo
Elasticsearch部署
因为elasticsearch服务运行需要java环境,因此两台elasticsearch服务器需要安装java环境。
安装JDK
centos7默认是安装了jdk,如果需要安装高版本可以使用一下步骤,这里使用下面的yum安装jdk 1.8.0_211 。注意:两个节点都要安装。
方法一:yum安装下载好的JDK包,将下载好的软件包上传到服务器进行安装,首先卸载自带的jdk;再进行安装。
下载地址:https://pan.baidu.com/s/1VK1iCnvouppZ06jsVBOaRw  提取码:lofc

[root@linux-elk1 ~]# rpm -qa |grep jdk |xargs yum -y remove {}\;
[root@linux-elk1 ~]# yum -y localinstall jdk-8u211-linux-x64.rpm
[root@linux-elk1 ~]# java -version
java version "1.8.0_211"
Java(TM) SE Runtime Environment (build 1.8.0_211-b12)
Java HotSpot(TM) 64-Bit Server VM (build 25.211-b12, mixed mode)

方法二:源码安装JDK,将下载的软件包上传到服务器进行安装。
下载地址:https://pan.baidu.com/s/1AAPyPzhdclNNCb0m6ooVYQ  提取码:x18u

[root@linux-elk1 ~]# tar xf jdk-8u211-linux-x64.tar.gz -C /usr/local/
[root@linux-elk1 ~]# ln -s /usr/local/jdk1.8.0_211 /usr/local/java
[root@linux-elk1 ~]# sed -i.ori '$a export JAVA_HOME=/usr/local/java \nexport PATH=$JAVA_HOME/bin:$JAVA_HOME/jre/bin:$PATH \nexport CLASSPATH=.$CLASSPATH:$JAVA_HOME/lib:$JAVA_HOME/jre/lib:$JAVA_HOME/lib/tools.jar' /etc/profile
[root@linux-elk1 ~]# source /etc/profile
[root@linux-elk1 ~]# java -version
java version "1.8.0_211"
Java(TM) SE Runtime Environment (build 1.8.0_211-b12)
Java HotSpot(TM) 64-Bit Server VM (build 25.211-b12, mixed mode)
安装Elasticsearch
两台节点都需要安装elasticsearch,使用yum安装会很慢,所以先下载下来传到服务器进行安装,官网下载地址:https://www.elastic.co/cn/downloads/past-releases#elasticsearch
本文所使用的包下载:https://pan.baidu.com/s/1djYOs3PQjtq16VkPMETAWg 提取码:b15v
将下载的elasticsearch包上传到服务器进行安装。
[root@linux-elk1 ~]# yum -y localinstall elasticsearch-6.8.1.rpm
[root@linux-elk2 ~]# yum -y localinstall elasticsearch-6.8.1.rpm


配置elasticsearch,linux-elk2配置一个相同的节点,通过组播进行通信,如果无法通过组播查询,修改成单播即可。
[root@linux-elk1 ~]# vim /etc/elasticsearch/elasticsearch.yml
cluster.name: ELK-Cluster    #ELK的集群名称,名称相同即属于是同一个集群
node.name: elk-node1    #本机在集群内的节点名称
path.data: /elk/data    #数据存放目录
path.logs: /elk/logs    #日志保存目录
bootstrap.memory_lock: true    #服务启动的时候锁定足够的内存,防止数据写入swap
network.host: 192.168.1.31    #监听的IP地址
http.port: 9200    #服务监听的端口
discovery.zen.ping.unicast.hosts: ["192.168.1.31", "192.168.1.32"]    #单播配置一台即可


修改内存限制,内存锁定需要进行配置需要2g以上内存,否则会导致无法启动elasticsearch。
[root@linux-elk1 ~]# vim /usr/lib/systemd/system/elasticsearch.service
# 在[Service]下加入下面这行内容
LimitMEMLOCK=infinity
[root@linux-elk1 ~]# systemctl daemon-reload
[root@linux-elk1 ~]# vim /etc/elasticsearch/jvm.options
-Xms2g
-Xmx2g     #最小和最大内存限制,为什么最小和最大设置一样大?参考:https://www.elastic.co/guide/en/elasticsearch/reference/current/heap-size.html


创建数据目录和日志目录及权限修改
[root@linux-elk1 ~]# mkdir -p /elk/{data,logs}
[root@linux-elk1 ~]# chown elasticsearch.elasticsearch /elk/ -R


启动elasticsearch及检查端口是否处于监听状态
[root@linux-elk1 ~]# systemctl start elasticsearch
[root@linux-elk1 ~]# netstat -nltup |grep java
tcp6       0      0 192.168.1.31:9200       :::*                    LISTEN      12887/java
tcp6       0      0 192.168.1.31:9300       :::*                    LISTEN      12887/java


将配置文件copy到linux-elk2上面并进行修改,配置启动等。
[root@linux-elk1 ~]# scp /etc/elasticsearch/elasticsearch.yml 192.168.1.32:/etc/elasticsearch/elasticsearch.yml
[root@linux-elk2 ~]# grep ^[a-Z] /etc/elasticsearch/elasticsearch.yml
cluster.name: ELK-Cluster
node.name: elk-node2
path.data: /elk/data
path.logs: /elk/logs
bootstrap.memory_lock: true
network.host: 192.168.1.32
http.port: 9200
discovery.zen.ping.unicast.hosts: ["192.168.1.31", "192.168.1.32"]
[root@linux-elk2 ~]# vim /usr/lib/systemd/system/elasticsearch.service
# 在[Service]下加入下面这行内容
LimitMEMLOCK=infinity
[root@linux-elk2 ~]# systemctl daemon-reload
[root@linux-elk2 ~]# vim /etc/elasticsearch/jvm.options
-Xms2g
-Xmx2g
[root@linux-elk2 ~]# mkdir -p /elk/{data,logs}
[root@linux-elk2 ~]# chown elasticsearch.elasticsearch /elk/ -R
[root@linux-elk2 ~]# systemctl start elasticsearch
[root@linux-elk2 ~]#  netstat -nltup |grep java
tcp6       0      0 192.168.1.32:9200       :::*                    LISTEN      18667/java
tcp6       0      0 192.168.1.32:9300       :::*                    LISTEN      18667/java
通过浏览器访问elasticsearch端口


监控elasticsearch集群状态
通过shell命令获取集群状态,这里获取到的是一个json格式的返回值,例如对status进行分析,如果等于green(绿色)就是运行在正常,等于yellow(黄色)表示副本分片丢失,red(红色)表示主分片丢失。
[root@linux-elk1 ~]# curl http://192.168.1.31:9200/_cluster/health?pretty=true
{
  "cluster_name" : "ELK-Cluster",
  "status" : "green",
  "timed_out" : false,
  "number_of_nodes" : 2,
  "number_of_data_nodes" : 2,
  "active_primary_shards" : 0,
  "active_shards" : 0,
  "relocating_shards" : 0,
  "initializing_shards" : 0,
  "unassigned_shards" : 0,
  "delayed_unassigned_shards" : 0,
  "number_of_pending_tasks" : 0,
  "number_of_in_flight_fetch" : 0,
  "task_max_waiting_in_queue_millis" : 0,
  "active_shards_percent_as_number" : 100.0
}

[root@linux-elk1 ~]# curl http://192.168.1.32:9200/_cluster/health?pretty=true
{
  "cluster_name" : "ELK-Cluster",
  "status" : "green",
  "timed_out" : false,
  "number_of_nodes" : 2,
  "number_of_data_nodes" : 2,
  "active_primary_shards" : 0,
  "active_shards" : 0,
  "relocating_shards" : 0,
  "initializing_shards" : 0,
  "unassigned_shards" : 0,
  "delayed_unassigned_shards" : 0,
  "number_of_pending_tasks" : 0,
  "number_of_in_flight_fetch" : 0,
  "task_max_waiting_in_queue_millis" : 0,
  "active_shards_percent_as_number" : 100.0
}
安装elasticsearch插件head
我们不可能经常通过命令来查看集群的信息,所以就使用到了插件 –head。件是为了完成不同的功能,官方提供了一些插件但大部分是收费的,另外也有一些开发爱好者提供的插件,可以实现对elasticsearch集群的状态监控与管理配置等功能。
head:主要用来做集群管理的插件
下载地址:https://github.com/mobz/elasticsearch-head
1)安装
# 安装npm和git
[root@linux-elk1 ~]# yum -y install npm git

# 安装elasticsearch-head插件
[root@linux-elk1 ~]# cd /usr/local/src/
[root@linux-elk1 src]# git clone git://github.com/mobz/elasticsearch-head.git
[root@linux-elk1 src]# cd elasticsearch-head/
[root@linux-elk1 elasticsearch-head]# npm install grunt -save --registry=https://registry.npm.taobao.org
[root@linux-elk1 elasticsearch-head]# ll node_modules/grunt    #确定该目录有生成文件
总用量 24
drwxr-xr-x. 2 root root   19 4月   6 2016 bin
-rw-r--r--. 1 root root 7111 4月   6 2016 CHANGELOG
drwxr-xr-x. 4 root root   47 7月   4 09:21 lib
-rw-r--r--. 1 root root 1592 3月  23 2016 LICENSE
drwxr-xr-x. 5 root root   50 7月   4 09:21 node_modules
-rw-r--r--. 1 root root 4108 7月   4 09:21 package.json
-rw-r--r--. 1 root root  878 2月  12 2016 README.md
[root@linux-elk1 elasticsearch-head]# npm install --registry=https://registry.npm.taobao.org    #执行安装
[root@linux-elk1 elasticsearch-head]# npm run start &    #后台启动服务
[root@linux-elk1 ~]# ss -nlt |grep 9100
LISTEN     0      128          *:9100                     *:*

#------------------------补充说明------------------------
由于上面npm安装时候超级慢,使用taobao源同样慢,这里将已安装的打成了包,可以直接下载使用即可
下载地址:https://pan.baidu.com/s/16zDlecKVfmkEeInPcRx9NQ   提取码:h890
[root@linux-elk1 ~]# yum -y install npm
[root@linux-elk1 ~]# cd /usr/local/src/
[root@linux-elk1 src]# ls
elasticsearch-head.tar.gz
[root@linux-elk1 src]# tar xvzf elasticsearch-head.tar.gz
[root@linux-elk1 src]# cd elasticsearch-head/
[root@linux-elk1 elasticsearch-head]# npm run start &
#--------------------------------------------------------

# 修改elasticsearch服务配置文件,开启跨域访问支持,然后重启elasticsearch服务
[root@linux-elk1 ~]# vim /etc/elasticsearch/elasticsearch.yml
http.cors.enabled: true     #最下方添加
http.cors.allow-origin: "*"
为了方便管理elasticsearch-head插件,编写一个启动脚本
[root@linux-elk1 ~]# vim /usr/bin/elasticsearch-head
#!/bin/bash
#desc: elasticsearch-head service manager
#date: 2019

data="cd /usr/local/src/elasticsearch-head/; nohup npm run start > /dev/null 2>&1 & "

function START (){
    eval $data && echo -e "elasticsearch-head start\033[32m     ok\033[0m"
}

function STOP (){
    ps -ef |grep grunt |grep -v "grep" |awk '{print $2}' |xargs kill -s 9 > /dev/null && echo -e "elasticsearch-head stop\033[32m      ok\033[0m"
}

case "$1" in
    start)
        START
        ;;
    stop)
        STOP
        ;;
    restart)
        STOP
        sleep 3
        START
        ;;
    *)
        echo "Usage: elasticsearch-head (start|stop|restart)"
        ;;
esac

[root@linux-elk1 ~]# chmod +x /usr/bin/elasticsearch-head
2)浏览器访问9100端口,将连接地址修改为elasticsearch地址。


3)测试提交数据

4)验证索引是否存在

5)查看数据

6)Master和Slave的区别:
Master的职责:
统计各node节点状态信息、集群状态信息统计、索引的创建和删除、索引分配的管理、关闭node节点等Savle的职责:
同步数据、等待机会称为Master
Logstash部署
Logstash 是一个开源的数据收集引擎,可以水平伸缩,而且logstash是整个ELK当中拥有最多插件的一个组件,其可以接收来自不同来源的数据并同意输出到指定的且可以是多个不同目的地。官网下载地址:https://www.elastic.co/cn/downloads/past-releases#logstash
安装logstash
[root@linux-elk1 ~]# wget https://artifacts.elastic.co/downloads/logstash/logstash-6.8.1.rpm
[root@linux-elk1 ~]# yum -y localinstall logstash-6.8.1.rpm
测试logstash是否正常
1)测试标准输入输出
[root@linux-elk1 ~]# /usr/share/logstash/bin/logstash -e 'input { stdin {} } output { stdout { codec => rubydebug} }'
hello world    #输入

{
      "@version" => "1",    #事件版本号,一个事件就是一个ruby对象
    "@timestamp" => 2019-07-04T04:30:35.106Z,    #当前事件发生的事件
          "host" => "linux-elk1.exmaple.com",    #标记事件发生在哪里
       "message" => "hello world"    #消息的具体内容
}
2)测试输出到文件
[root@linux-elk1 ~]# /usr/share/logstash/bin/logstash   -e 'input { stdin{} } output { file { path => "/tmp/log-%{+YYYY.MM.dd}messages.gz"}}'
hello world   #输入
[INFO ] 2019-07-04 17:33:06.065 [[main]>worker0] file - Opening file {:path=>"/tmp/log-2019.07.04messages.gz"}

[root@linux-elk1 ~]# tail /tmp/log-2019.07.04messages.gz
{"message":"hello world","@version":"1","host":"linux-elk1.exmaple.com","@timestamp":"2019-07-04T09:33:05.698Z"}
3)测试输出到elasticsearch
[root@linux-elk1 ~]# /usr/share/logstash/bin/logstash -e 'input { stdin{} } output { elasticsearch {hosts => ["192.168.1.31:9200"] index => "mytest-%{+YYYY.MM.dd}" }}'
4)elasticsearch服务器验证收到数据
[root@linux-elk1 ~]# ll /elk/data/nodes/0/indices/
总用量 0
drwxr-xr-x. 8 elasticsearch elasticsearch 65 7月   4 17:23 4jaihRq6Qu6NQWVxbuRQZg
drwxr-xr-x. 8 elasticsearch elasticsearch 65 7月   4 17:22 kkd_RCldSeaCX3y1XKzdgA

kibana部署
Kibana是一个通过调用elasticsearch服务器进行图形化展示搜索结果的开源项目。官网下载地址:https://www.elastic.co/cn/downloads/past-releases#kibana
安装kibana
[root@linux-elk1 ~]# wget https://artifacts.elastic.co/downloads/kibana/kibana-6.8.1-x86_64.rpm
[root@linux-elk1 ~]# yum -y localinstall kibana-6.8.1-x86_64.rpm
[root@linux-elk1 ~]# vim /etc/kibana/kibana.yml
[root@linux-elk1 ~]# grep ^[a-Z] /etc/kibana/kibana.yml
server.port: 5601    #监听端口
server.host: "192.168.1.31"    #监听地址
elasticsearch.hosts: ["http://192.168.1.31:9200"]    #elasticsearch服务器地址
i18n.locale: "zh-CN"    #修改为中文
启动kibana并验证
[root@linux-elk1 ~]# systemctl start kibana
[root@linux-elk1 ~]# systemctl enable kibana
[root@linux-elk1 ~]# ss -nlt  |grep 5601
LISTEN     0      128    192.168.1.31:5601                     *:*
查看状态

通过logstash收集系统message日志
说明:通过logstash收集别的日志文件,前提需要logstash用户对被收集的日志文件有读的权限并对写入的文件有写的权限
1)配置logstash配置文件
[root@linux-elk1 ~]# vim /etc/logstash/conf.d/system-log.conf
input {
    file {
        path => "/var/log/messages"    #日志路径
        type => "systemlog"            #类型,自定义,在进行多个日志收集存储时可以通过该项进行判断输出
        start_position => "beginning"        #logstash 从什么位置开始读取文件数据,默认是结束位置,也就是说 logstash 进程会以类似 tail -F 的形式运行。如果你是要导入原有数据,把这个设定改成 "beginning",logstash 进程就从头开始读取,类似 less +F 的形式运行。
        stat_interval => "2"    #logstash 每隔多久检查一次被监听文件状态(是否有更新),默认是 1 秒
    }
}

output {
    elasticsearch {
        hosts => ["192.168.1.31:9200"]        #elasticsearch服务器地址
        index => "logstash-%{type}-%{+YYYY.MM.dd}"    #索引名称
    }
}
2)检测配置文件语法是否有错误
[root@linux-elk1 ~]# /usr/share/logstash/bin/logstash -f /etc/logstash/conf.d/system-log.conf -t    #检测配置文件是否有语法错误
WARNING: Could not find logstash.yml which is typically located in $LS_HOME/config or /etc/logstash. You can specify the path using --path.settings. Continuing using the defaults
Could not find log4j2 configuration at path /usr/share/logstash/config/log4j2.properties. Using default config which logs errors to the console
[WARN ] 2019-07-05 10:09:59.423 [LogStash::Runner] multilocal - Ignoring the 'pipelines.yml' file because modules or command line options are specified
Configuration OK
[INFO ] 2019-07-05 10:10:27.993 [LogStash::Runner] runner - Using config.test_and_exit mode. Config Validation Result: OK. Exiting Logstash
3)修改日志文件的权限并重启logstash
[root@linux-elk1 ~]# ll /var/log/messages
-rw-------. 1 root root 786219 7月   5 10:10 /var/log/messages
#这里可以看到该日志文件是600权限,而elasticsearch是运行在elasticsearch用户下,这样elasticsearch是无法收集日志的。所以这里需要更改日志的权限,否则会报权限拒绝的错误。在日志中查看/var/log/logstash/logstash-plain.log 是否有错误。
[root@linux-elk1 ~]# chmod 644 /var/log/messages
[root@linux-elk1 ~]# systemctl  restart logstash
4)elasticsearch界面查看并查询


5)kibana界面创建索引并查看


ELK快速入门二-通过logstash收集日志
说明
这里的环境接着上面的ELK快速入门-基本部署文章继续下面的操作。
收集多个日志文件
1)logstash配置文件编写
[root@linux-elk1 ~]# vim /etc/logstash/conf.d/system-log.conf
input {
    file {
        path => "/var/log/messages"
        type => "systemlog"
        start_position => "beginning"
        stat_interval => "3"
    }
    file {
        path => "/var/log/secure"
        type => "securelog"
        start_position => "beginning"
        stat_interval => "3"
    }
}

output {
    if [type] == "systemlog" {
        elasticsearch {
            hosts => ["192.168.1.31:9200"]
            index => "system-log-%{+YYYY.MM.dd}"
        }
    }
    if [type] == "securelog" {
        elasticsearch {
            hosts => ["192.168.1.31:9200"]
            index => "secure-log-%{+YYYY.MM.dd}"
        }
    }
}
2)给日志文件赋予可读权限并重启logstash
[root@linux-elk1 ~]# chmod 644 /var/log/secure
[root@linux-elk1 ~]# chmod 644 /var/log/messages
[root@linux-elk1 ~]# systemctl restart logstash
3)向被收集的文件中写入数据;是为了马上能在elasticsearch的web界面和klbana的web界面里面查看到数据。
[root@linux-elk1 ~]# echo "test" >> /var/log/secure
[root@linux-elk1 ~]# echo "test" >> /var/log/messages
4)在kibana界面添加system-log索引模式


5)在kibana界面添加secure-log索引模式


6)kibana查看日志

收集tomcat和java日志
收集Tomcat服务器的访问日志以及Tomcat错误日志进行实时统计,在kibana页面进行搜索展示,每台Tomcat服务器需要安装logstash负责收集日志,然后将日志发给elasticsearch进行分析,在通过kibana在前端展示。
部署tomcat服务
说明,我这里在linux-elk2节点上面装tomcat
1)下载并安装tomcat
[root@linux-elk2 ~]# cd /usr/local/
[root@linux-elk2 local]# wget http://mirrors.tuna.tsinghua.edu.cn/apache/tomcat/tomcat-9/v9.0.21/bin/apache-tomcat-9.0.21.tar.gz
[root@linux-elk2 local]# tar xvzf apache-tomcat-9.0.21.tar.gz
[root@linux-elk2 local]# ln -s /usr/local/apache-tomcat-9.0.21 /usr/local/tomcat
2)测试页面准备
[root@linux-elk2 local]# cd /usr/local/tomcat/webapps/
[root@linux-elk2 webapps]# mkdir webdir
[root@linux-elk2 webapps]# echo "<h1>Welcome to Tomcat</h1>"  > /usr/local/tomcat/webapps/webdir/index.html
3)tomcat日志转json
[root@linux-elk2 tomcat]# vim /usr/local/tomcat/conf/server.xml
<Valve className="org.apache.catalina.valves.AccessLogValve" directory="logs"
prefix="localhost_access_log" suffix=".txt"
pattern="{"clientip":"%h","ClientUser":"%l","authenticated":"%u","AccessTime":"%t","method":"%r","status":"%s","SendBytes":"%b","Query?string":"%q","partner":"%{Referer}i","AgentVersion":"%{User-Agent}i"}"/>
4)启动tomcat,并进行访问测试生成日志
[root@linux-elk2 tomcat]# /usr/local/tomcat/bin/startup.sh
[root@linux-elk2 tomcat]# ss -nlt |grep 8080
LISTEN     0      100         :::8080                    :::*
[root@linux-elk2 tomcat]# ab -n100 -c100 http://192.168.1.32:8080/webdir/

[root@linux-elk2 ~]# tailf /usr/local/tomcat/logs/localhost_access_log.2019-07-05.log
{"clientip":"192.168.1.32","ClientUser":"-","authenticated":"-","AccessTime":"[05/Jul/2019:16:39:18 +0800]","method":"GET /webdir/ HTTP/1.0","status":"200","SendBytes":"27","Query?string":"","partner":"-","AgentVersion":"ApacheBench/2.3"}
{"clientip":"192.168.1.32","ClientUser":"-","authenticated":"-","AccessTime":"[05/Jul/2019:16:39:18 +0800]","method":"GET /webdir/ HTTP/1.0","status":"200","SendBytes":"27","Query?string":"","partner":"-","AgentVersion":"ApacheBench/2.3"}
{"clientip":"192.168.1.32","ClientUser":"-","authenticated":"-","AccessTime":"[05/Jul/2019:16:39:18 +0800]","method":"GET /webdir/ HTTP/1.0","status":"200","SendBytes":"27","Query?string":"","partner":"-","AgentVersion":"ApacheBench/2.3"}
{"clientip":"192.168.1.32","ClientUser":"-","authenticated":"-","AccessTime":"[05/Jul/2019:16:39:18 +0800]","method":"GET /webdir/ HTTP/1.0","status":"200","SendBytes":"27","Query?string":"","partner":"-","AgentVersion":"ApacheBench/2.3"}
{"clientip":"192.168.1.32","ClientUser":"-","authenticated":"-","AccessTime":"[05/Jul/2019:16:39:18 +0800]","method":"GET /webdir/ HTTP/1.0","status":"200","SendBytes":"27","Query?string":"","partner":"-","AgentVersion":"ApacheBench/2.3"}
{"clientip":"192.168.1.32","ClientUser":"-","authenticated":"-","AccessTime":"[05/Jul/2019:16:39:18 +0800]","method":"GET /webdir/ HTTP/1.0","status":"200","SendBytes":"27","Query?string":"","partner":"-","AgentVersion":"ApacheBench/2.3"}
{"clientip":"192.168.1.32","ClientUser":"-","authenticated":"-","AccessTime":"[05/Jul/2019:16:39:18 +0800]","method":"GET /webdir/ HTTP/1.0","status":"200","SendBytes":"27","Query?string":"","partner":"-","AgentVersion":"ApacheBench/2.3"}
{"clientip":"192.168.1.32","ClientUser":"-","authenticated":"-","AccessTime":"[05/Jul/2019:16:39:18 +0800]","method":"GET /webdir/ HTTP/1.0","status":"200","SendBytes":"27","Query?string":"","partner":"-","AgentVersion":"ApacheBench/2.3"}
5)验证日志是否为json格式,http://www.kjson.com/

配置logstash收集tomcat日志
说明:如果是需要收集别的服务器上面的tomcat日志,那么在所需要收集的服务器上面都得安装logstash。此处是在linux-elk2节点上面部署的tomcat,之前安装过logstash。
1)配置logstash
[root@linux-elk2 ~]# vim /etc/logstash/conf.d/tomcat.conf
input {
    file {
        path => "/usr/local/tomcat/logs/localhost_access_log.*.log"
        type => "tomcat-access-log"
        start_position => "beginning"
        stat_interval => "2"
    }
}

output {
    elasticsearch {
        hosts => ["192.168.1.31:9200"]
        index => "logstash-tomcat-132-accesslog-%{+YYYY.MM.dd}"
    }
    file {
        path => "/tmp/logstash-tomcat-132-accesslog-%{+YYYY.MM.dd}"
    }
}
2)检测配置文件语法,并重启logstash
[root@linux-elk2 ~]# /usr/share/logstash/bin/logstash -f /etc/logstash/conf.d/tomcat.conf -tWARNING: Could not find logstash.yml which is typically located in $LS_HOME/config or /etc/logstash. You can specify the path using --path.settings. Continuing using the defaults
Could not find log4j2 configuration at path /usr/share/logstash/config/log4j2.properties. Using default config which logs errors to the console
[WARN ] 2019-07-05 17:04:34.583 [LogStash::Runner] multilocal - Ignoring the 'pipelines.yml' file because modules or command line options are specified
Configuration OK

[root@linux-elk2 ~]# /usr/share/logstash/bin/system-install /etc/logstash/startup.options systemd
[root@linux-elk2 ~]# systemctl start logstash
3)权限修改,不然elasticsearch界面和kibana界面是无法查看到的
[root@linux-elk2 ~]# ll /usr/local/tomcat/logs/ -d
drwxr-xr-x 2 root root 197 7月   5 16:36 /usr/local/tomcat/logs/
[root@linux-elk2 ~]# ll /usr/local/tomcat/logs/
总用量 64
-rw-r----- 1 root root 14228 7月   5 16:36 catalina.2019-07-05.log
-rw-r----- 1 root root 14228 7月   5 16:36 catalina.out
-rw-r----- 1 root root     0 7月   5 16:25 host-manager.2019-07-05.log
-rw-r----- 1 root root  1074 7月   5 16:36 localhost.2019-07-05.log
-rw-r----- 1 root root 26762 7月   5 17:23 localhost_access_log.2019-07-05.log
-rw-r----- 1 root root     0 7月   5 16:25 manager.2019-07-05.log
[root@linux-elk2 ~]# chown logstash.logstash /usr/local/tomcat/logs/ -R
[root@linux-elk2 ~]# ll /usr/local/tomcat/logs/
总用量 64
-rw-r----- 1 logstash logstash 14228 7月   5 16:36 catalina.2019-07-05.log
-rw-r----- 1 logstash logstash 14228 7月   5 16:36 catalina.out
-rw-r----- 1 logstash logstash     0 7月   5 16:25 host-manager.2019-07-05.log
-rw-r----- 1 logstash logstash  1074 7月   5 16:36 localhost.2019-07-05.log
-rw-r----- 1 logstash logstash 26762 7月   5 17:23 localhost_access_log.2019-07-05.log
-rw-r----- 1 logstash logstash     0 7月   5 16:25 manager.2019-07-05.log
4)访问elasticsearch界面验证插件

数据浏览

5)在kibana上添加索引模式


6)kibana验证数据

配置logstash收集java日志
使用codec的multiline插件实现多行匹配,这是一个可以将多行进行合并的插件,而且可以使用what指定将匹配到的行与前面的行合并还是和后面的行合并,https://www.elastic.co/guide/en/logstash/current/plugins-codecs-multiline.html
语法格式:
input {
    stdin {
        codec => multiline {
            pattern => "^\["    #当遇到[开头的行时候将多行进行合并
            negate => true      #true为匹配成功进行操作,false为不成功进行操
            what => "previous"  #与上面的行合并,如果是下面的行合并就是
        }
    }
}
命令行测试输入输出:
[root@linux-elk2 ~]# /usr/share/logstash/bin/logstash -e 'input { stdin { codec => multiline { pattern => "^\[" negate => true what => "previous" } } } output { stdout { codec => rubydebug }}'
WARNING: Could not find logstash.yml which is typically located in $LS_HOME/config or /etc/logstash. You can specify the path using --path.settings. Continuing using the defaults
Could not find log4j2 configuration at path /usr/share/logstash/config/log4j2.properties. Using default config which logs errors to the console
[WARN ] 2019-07-08 15:28:04.938 [LogStash::Runner] multilocal - Ignoring the 'pipelines.yml' file because modules or command line options are specified
[INFO ] 2019-07-08 15:28:04.968 [LogStash::Runner] runner - Starting Logstash {"logstash.version"=>"6.8.1"}
[INFO ] 2019-07-08 15:28:19.167 [Converge PipelineAction::Create<main>] pipeline - Starting pipeline {:pipeline_id=>"main", "pipeline.workers"=>1, "pipeline.batch.size"=>125, "pipeline.batch.delay"=>50}
[INFO ] 2019-07-08 15:28:19.918 [Converge PipelineAction::Create<main>] pipeline - Pipeline started successfully {:pipeline_id=>"main", :thread=>"#<Thread:0xc8dd9a1 run>"}
The stdin plugin is now waiting for input:
111111
222222
aaaaaa
[44444
{
    "@timestamp" => 2019-07-08T07:34:48.063Z,
          "tags" => [
        [0] "multiline"
    ],
      "@version" => "1",
       "message" => "[12\n111111\n222222\naaaaaa",
          "host" => "linux-elk2.exmaple.com"
}

444444
aaaaaa
[77777
{
    "@timestamp" => 2019-07-08T07:35:51.522Z,
          "tags" => [
        [0] "multiline"
    ],
      "@version" => "1",
       "message" => "[44444\n444444\naaaaaa",
          "host" => "linux-elk2.exmaple.com"
}
示例:收集ELK集群日志
1)观察日志文件,elk集群日志都是以"["开头并且每一个信息都是如此。
[root@linux-elk2 ~]# tailf /elk/logs/ELK-Cluster.log
[2019-07-08T11:26:37,774][INFO ][o.e.c.m.MetaDataIndexTemplateService] [elk-node2] adding template [kibana_index_template:.kibana] for index patterns [.kibana]
[2019-07-08T11:26:47,664][INFO ][o.e.c.m.MetaDataIndexTemplateService] [elk-node2] adding template [kibana_index_template:.kibana] for index patterns [.kibana]
[2019-07-08T11:33:55,150][INFO ][o.e.c.m.MetaDataIndexTemplateService] [elk-node2] adding template [kibana_index_template:.kibana] for index patterns [.kibana]
[2019-07-08T11:33:55,197][INFO ][o.e.c.m.MetaDataMappingService] [elk-node2] [.kibana_1/yRee-8HYS8KiVwnuADXAbA] update_mapping [doc]
[2019-07-08T11:33:55,822][INFO ][o.e.c.m.MetaDataIndexTemplateService] [elk-node2] adding template [kibana_index_template:.kibana] for index patterns [.kibana]
[2019-07-08T11:33:55,905][INFO ][o.e.c.m.MetaDataMappingService] [elk-node2] [.kibana_1/yRee-8HYS8KiVwnuADXAbA] update_mapping [doc]
[2019-07-08T11:33:57,026][INFO ][o.e.c.m.MetaDataIndexTemplateService] [elk-node2] adding template [kibana_index_template:.kibana] for index patterns [.kibana]
[2019-07-08T11:43:20,262][WARN ][o.e.m.j.JvmGcMonitorService] [elk-node2] [gc][young][8759][66] duration [1.3s], collections [1]/[1.7s], total [1.3s]/[4s], memory [176mb]->[111.6mb]/[1.9gb], all_pools {[young] [64.8mb]->[706.4kb]/[66.5mb]}{[survivor] [3.3mb]->[3mb]/[8.3mb]}{[old] [107.8mb]->[107.8mb]/[1.9gb]}
[2019-07-08T11:43:20,388][WARN ][o.e.m.j.JvmGcMonitorService] [elk-node2] [gc][8759] overhead, spent [1.3s] collecting in the last [1.7s]
[2019-07-08T11:44:42,955][INFO ][o.e.x.m.p.NativeController] [elk-node2] Native controller process has stopped - no new native processes can be started
2)配置logstash
[root@linux-elk2 ~]# vim /etc/logstash/conf.d/java.conf
input {
    file {
        path => "/elk/logs/ELK-Cluster.log"
        type => "java-elk-cluster-log"
        start_position => "beginning"
        stat_interval => "2"
        code => multiline {
            pattern => "^\["    #以"["开头进行正则匹配,匹配规则
            negate => "true"  #正则匹配成功,false匹配不成功
            what => "previous"  #和前面的内容进行合并,如果是和下面的合并就是next
        }
    }
}

output {
    if [type] == "java-elk-cluster-log" {
        elasticsearch {
            hosts => ["192.168.1.31:9200"]
            index => "java-elk-cluster-log-%{+YYYY.MM.dd}"
        }
    }
}
3)检查配置文件语法是否有误并重启logstash
[root@linux-elk2 ~]# /usr/share/logstash/bin/logstash -f /etc/logstash/conf.d/java.conf -t
WARNING: Could not find logstash.yml which is typically located in $LS_HOME/config or /etc/logstash. You can specify the path using --path.settings. Continuing using the defaults
Could not find log4j2 configuration at path /usr/share/logstash/config/log4j2.properties. Using default config which logs errors to the console
[WARN ] 2019-07-08 15:49:51.996 [LogStash::Runner] multilocal - Ignoring the 'pipelines.yml' file because modules or command line options are specified
Configuration OK
[INFO ] 2019-07-08 15:50:04.438 [LogStash::Runner] runner - Using config.test_and_exit mode. Config Validation Result: OK. Exiting Logstash

[root@linux-elk2 ~]# systemctl restart logstash
4)访问elasticsearch界面验证数据

5)在kibana上添加索引验证模式


6)kibana验证数据

收集Nginx访问日志
收集nginx的json访问日志,这里为了测试,是在一台新的服务器上面安装了nginx和logstash
1)安装nginx并准备一个测试页面
[root@node01 ~]# yum -y install nginx
[root@node01 ~]# echo "<h1>whelcom to nginx server</h1>" > /usr/share/nginx/html/index.html
[root@node01 ~]# systemctl start nginx
[root@node01 ~]# curl localhost
<h1>whelcom to nginx server</h1>
2)将nginx日志转换成json格式
[root@node01 ~]# vim /etc/nginx/nginx.conf
    log_format access_json '{"@timestamp":"$time_iso8601",'
                           '"host":"$server_addr",'
                           '"clientip":"$remote_addr",'
                           '"size":$body_bytes_sent,'
                           '"responsetime":$request_time,'
                           '"upstreamtime":"$upstream_response_time",'
                           '"upstreamhost":"$upstream_addr",'
                           '"http_host":"$host",'
                           '"url":"$uri",'
                           '"domain":"$host",'
                           '"xff":"$http_x_forwarded_for",'
                           '"referer":"$http_referer",'
                           '"status":"$status"}';

    access_log  /var/log/nginx/access.log  access_json;

[root@node01 ~]# nginx -t
nginx: the configuration file /etc/nginx/nginx.conf syntax is ok
nginx: configuration file /etc/nginx/nginx.conf test is successful
[root@node01 ~]# systemctl restart nginx
3)访问一次,确认日志为json格式

[root@node01 ~]# tail /var/log/nginx/access.log
{"@timestamp":"2019-07-09T11:21:28+08:00","host":"192.168.1.30","clientip":"192.168.1.144","size":33,"responsetime":0.000,"upstreamtime":"-","upstreamhost":"-","http_host":"192.168.1.30","url":"/index.html","domain":"192.168.1.30","xff":"-","referer":"-","status":"200"}
4)安装logstash并配置收集nginx日志
#将logstash软件包copy到nginx服务器上
[root@linux-elk1 ~]# scp logstash-6.8.1.rpm 192.168.1.30:/root/
#安装logstash
[root@node01 ~]# yum -y localinstall logstash-6.8.1.rpm
#生成logstash.service启动文件
[root@node01 ~]# /usr/share/logstash/bin/system-install /etc/logstash/startup.options systemd
#将logstash启动用户更改为root,不然可能会导致收集不到日志
[root@node01 ~]# vim /etc/systemd/system/logstash.service
User=root
Group=root
[root@node01 ~]# systemctl daemon-reload

[root@node01 ~]# vim /etc/logstash/conf.d/nginx.conf
input {
    file {
        path => "/var/log/nginx/access.log"
        type => "nginx-accesslog"
        start_position => "beginning"
        stat_interval => "2"
        codec => json
    }
}

output {
    if [type] == "nginx-accesslog" {
        elasticsearch {
        hosts => ["192.168.1.31:9200"]
        index => "logstash-nginx-accesslog-30-%{+YYYY.MM.dd}"
        }
    }
}
5)检查配置文件语法是否有误并重启logstash
[root@node01 ~]# /usr/share/logstash/bin/logstash -f /etc/logstash/conf.d/nginx.conf -t
WARNING: Could not find logstash.yml which is typically located in $LS_HOME/config or /etc/logstash. You can specify the path using --path.settings. Continuing using the defaults
Could not find log4j2 configuration at path /usr/share/logstash/config/log4j2.properties. Using default config which logs errors to the console
[WARN ] 2019-07-09 11:26:04.277 [LogStash::Runner] multilocal - Ignoring the 'pipelines.yml' file because modules or command line options are specified
Configuration OK
[INFO ] 2019-07-09 11:26:09.055 [LogStash::Runner] runner - Using config.test_and_exit mode. Config Validation Result: OK. Exiting Logstash

[root@node01 ~]# systemctl restart logstash
6)在kibana上添加索引验证模式


7)在kibana上验证数据,可以通过添加筛选,让日志更加了然名目

收集TCP/UDP日志
通过logstash的tcp/udp插件收集日志,通常用于在向elasticsearch日志补录丢失的部分日志,可以将丢失的日志通过一个TCP端口直接写入到elasticsearch服务器。
进行收集测试
1)logstash配置
[root@linux-elk1 ~]# vim /etc/logstash/conf.d/tcp.conf
input {
    tcp {
        port => 9889
        type => "tcplog"
        mode => "server"
    }
}

output {
    stdout {
        codec => rubydebug
    }
}
2)验证端口是否启动成功
[root@linux-elk1 ~]# /usr/share/logstash/bin/logstash -f /etc/logstash/conf.d/tcp.conf
WARNING: Could not find logstash.yml which is typically located in $LS_HOME/config or /etc/logstash. You can specify the path using --path.settings. Continuing using the defaults
Could not find log4j2 configuration at path /usr/share/logstash/config/log4j2.properties. Using default config which logs errors to the console
[WARN ] 2019-07-09 18:12:07.538 [LogStash::Runner] multilocal - Ignoring the 'pipelines.yml' file because modules or command line options are specified
[INFO ] 2019-07-09 18:12:07.551 [LogStash::Runner] runner - Starting Logstash {"logstash.version"=>"6.8.1"}
[INFO ] 2019-07-09 18:12:14.416 [Converge PipelineAction::Create<main>] pipeline - Starting pipeline {:pipeline_id=>"main", "pipeline.workers"=>2, "pipeline.batch.size"=>125, "pipeline.batch.delay"=>50}
[INFO ] 2019-07-09 18:12:14.885 [Converge PipelineAction::Create<main>] pipeline - Pipeline started successfully {:pipeline_id=>"main", :thread=>"#<Thread:0x240c27a6 sleep>"}
[INFO ] 2019-07-09 18:12:14.911 [[main]<tcp] tcp - Starting tcp input listener {:address=>"0.0.0.0:9889", :ssl_enable=>"false"}
[INFO ] 2019-07-09 18:12:14.953 [Ruby-0-Thread-1: /usr/share/logstash/lib/bootstrap/environment.rb:6] agent - Pipelines running {:count=>1, :running_pipelines=>[:main], :non_running_pipelines=>[]}
[INFO ] 2019-07-09 18:12:15.223 [Api Webserver] agent - Successfully started Logstash API endpoint {:port=>9600}


# 新开一个终端验证端口
[root@linux-elk1 ~]# netstat -nlutp |grep 9889
tcp6       0      0 :::9889                 :::*                    LISTEN      112455/java
3)在别的服务器通过nc命令进行测试,查看logstash是否收到数据
# echo "nc test" | nc 192.168.1.31 9889    #在另外一台服务器上执行

# 在上面启动logstash的那个终端查看
{
       "message" => "nc test",
          "host" => "192.168.1.30",
          "type" => "tcplog",
      "@version" => "1",
    "@timestamp" => 2019-07-09T10:16:48.139Z,
          "port" => 37102
}
4)通过nc命令发送一个文件,查看logstash收到的数据
# nc 192.168.1.31 9889 < /etc/passwd    #同样在上面执行nc那台服务器上执行

# 同样还是在上面启动logstash的那个终端查看
{
       "message" => "mysql:x:27:27:MariaDB Server:/var/lib/mysql:/sbin/nologin",
          "host" => "192.168.1.30",
          "type" => "tcplog",
      "@version" => "1",
    "@timestamp" => 2019-07-09T10:18:29.186Z,
          "port" => 37104
}
{
       "message" => "logstash:x:989:984:logstash:/usr/share/logstash:/sbin/nologin",
          "host" => "192.168.1.30",
          "type" => "tcplog",
      "@version" => "1",
    "@timestamp" => 2019-07-09T10:18:29.187Z,
          "port" => 37104
}
5)通过伪设备的方式发送消息:
在类Unix操作系统中,设备节点并不一定要对应物理设备。没有这种对应关系的设备是伪设备。操作系统运用了它们提供的多种功能,tcp只是dev下面众多伪设备当中的一种设备。
# echo "伪设备" >/dev/tcp/192.168.1.31/9889    #同样在上面执行nc那台服务器上执行

# 同样还是在上面启动logstash的那个终端查看
{
       "message" => "伪设备",
          "host" => "192.168.1.30",
          "type" => "tcplog",
      "@version" => "1",
    "@timestamp" => 2019-07-09T10:21:32.487Z,
          "port" => 37106
}
6)将输出更改到elasticsearch
[root@linux-elk1 ~]# vim /etc/logstash/conf.d/tcp.conf
input {
    tcp {
        port => 9889
        type => "tcplog"
        mode => "server"
    }
}

output {
    elasticsearch {
        hosts => ["192.168.1.31:9200"]
        index => "logstash-tcp-log-%{+YYYY.MM.dd}"
    }
}
7)通过nc命令或伪设备输入日志
# echo "伪设备 1" >/dev/tcp/192.168.1.31/9889
# echo "伪设备 2" >/dev/tcp/192.168.1.31/9889
8)在kibana界面创建索引模式


9)验证数据

ELK快速入门三-logstash收集日志写入redis
用一台服务器部署redis服务,专门用于日志缓存使用,一般用于web服务器产生大量日志的场景。
这里是使用一台专门用于部署redis ,一台专门部署了logstash,在linux-elk1ELK集群上面进行日志收集存到了redis服务器上面,然后通过专门的logstash服务器去redis服务器里面取出数据在放到kibana上面进行展示
部署redis
下载安装redis
[root@linux-redis ~]# wget http://download.redis.io/releases/redis-5.0.0.tar.gz
[root@linux-redis ~]# tar -xvzf redis-5.0.0.tar.gz
[root@linux-redis ~]# mv redis-5.0.0 /usr/local/src/
[root@linux-redis ~]# ln -sv /usr/local/src/redis-5.0.0 /usr/local/redis
"/usr/local/redis" -> "/usr/local/src/redis-5.0.0"
[root@linux-redis ~]# cd /usr/local/redis/
[root@linux-redis ~]# make distclean
[root@linux-redis ~]# make
配置redis
[root@linux-redis redis]# vim redis.conf
daemonize yes
bind 192.168.1.30
requirepass 123321

[root@linux-redis redis]# cp /usr/local/redis/src/redis-server /usr/bin/
[root@linux-redis redis]# cp /usr/local/redis/src/redis-cli /usr/bin/
[root@linux-redis redis]# redis-server /usr/local/redis/redis.conf
4007:C 10 Jul 2019 12:24:30.367 # oO0OoO0OoO0Oo Redis is starting oO0OoO0OoO0Oo
4007:C 10 Jul 2019 12:24:30.367 # Redis version=5.0.0, bits=64, commit=00000000, modified=0, pid=4007, just started
4007:C 10 Jul 2019 12:24:30.367 # Configuration loaded

[root@linux-redis redis]# netstat -nlutp |grep 6379
tcp        0      0 192.168.1.30:6379       0.0.0.0:*               LISTEN      4008/redis-server 1
测试redis
[root@linux-redis redis]# redis-cli -h 192.168.1.30
192.168.1.30:6379> AUTH 123321
OK
192.168.1.30:6379> ping
PONG
192.168.1.30:6379> KEYS *
(empty list or set)
192.168.1.30:6379> quit
配置logstash将日志写入redis
将系统日志的通过logstash收集之后写入redis,然后通过另外的logstash将redis服务器的数据取出来。
配置logstash的配置文件
[root@linux-elk1 ~]# vim /etc/logstash/conf.d/system.conf
input {
    file {
        path => "/var/log/messages"
        type => "systemlog"
        start_position => "beginning"
        stat_interval => "2"
    }
}

output {
    if [type] == "systemlog" {
        redis {
            data_type => "list"
            host => "192.168.1.30"
            password => "123321"
            port => "6379"
            db => "0"
            key => "systemlog"
        }
    }
}
检查logstash配置语法是否正确
[root@linux-elk1 ~]# /usr/share/logstash/bin/logstash -f /etc/logstash/conf.d/system.conf -t
WARNING: Could not find logstash.yml which is typically located in $LS_HOME/config or /etc/logstash. You can specify the path using --path.settings. Continuing using the defaults
Could not find log4j2 configuration at path /usr/share/logstash/config/log4j2.properties. Using default config which logs errors to the console
[WARN ] 2019-07-10 14:46:46.324 [LogStash::Runner] multilocal - Ignoring the 'pipelines.yml' file because modules or command line options are specified
Configuration OK

[root@linux-elk1 ~]# systemctl restart logstash
写入messages日志测试
[root@linux-elk1 ~]# echo "redis-test" >> /var/log/messages
[root@linux-elk1 ~]# echo "systemlog" >> /var/log/messages
登录redis进行查看
[root@linux-redis ~]# redis-cli -h 192.168.1.30
192.168.1.30:6379> AUTH 123321
OK
192.168.1.30:6379> SELECT 0
OK
192.168.1.30:6379> KEYS *
1) "systemlog"
192.168.1.30:6379> LLEN systemlog
(integer) 126
配置logstash从redis中取出数据到elasticsearch
配置专门logstash服务器从redis服务器读取指定的key的数据,并写入到elasticsearch
编辑logstash配置文件
[root@logstash ~]# vim /etc/logstash/conf.d/redis-read.conf
input {
redis {
data_type => "list"
host => "192.168.1.30"
password => "123321"
port => "6379"
db => "0"
key => "systemlog"
}
}
output {
elasticsearch {
hosts => ["192.168.1.31:9200"]
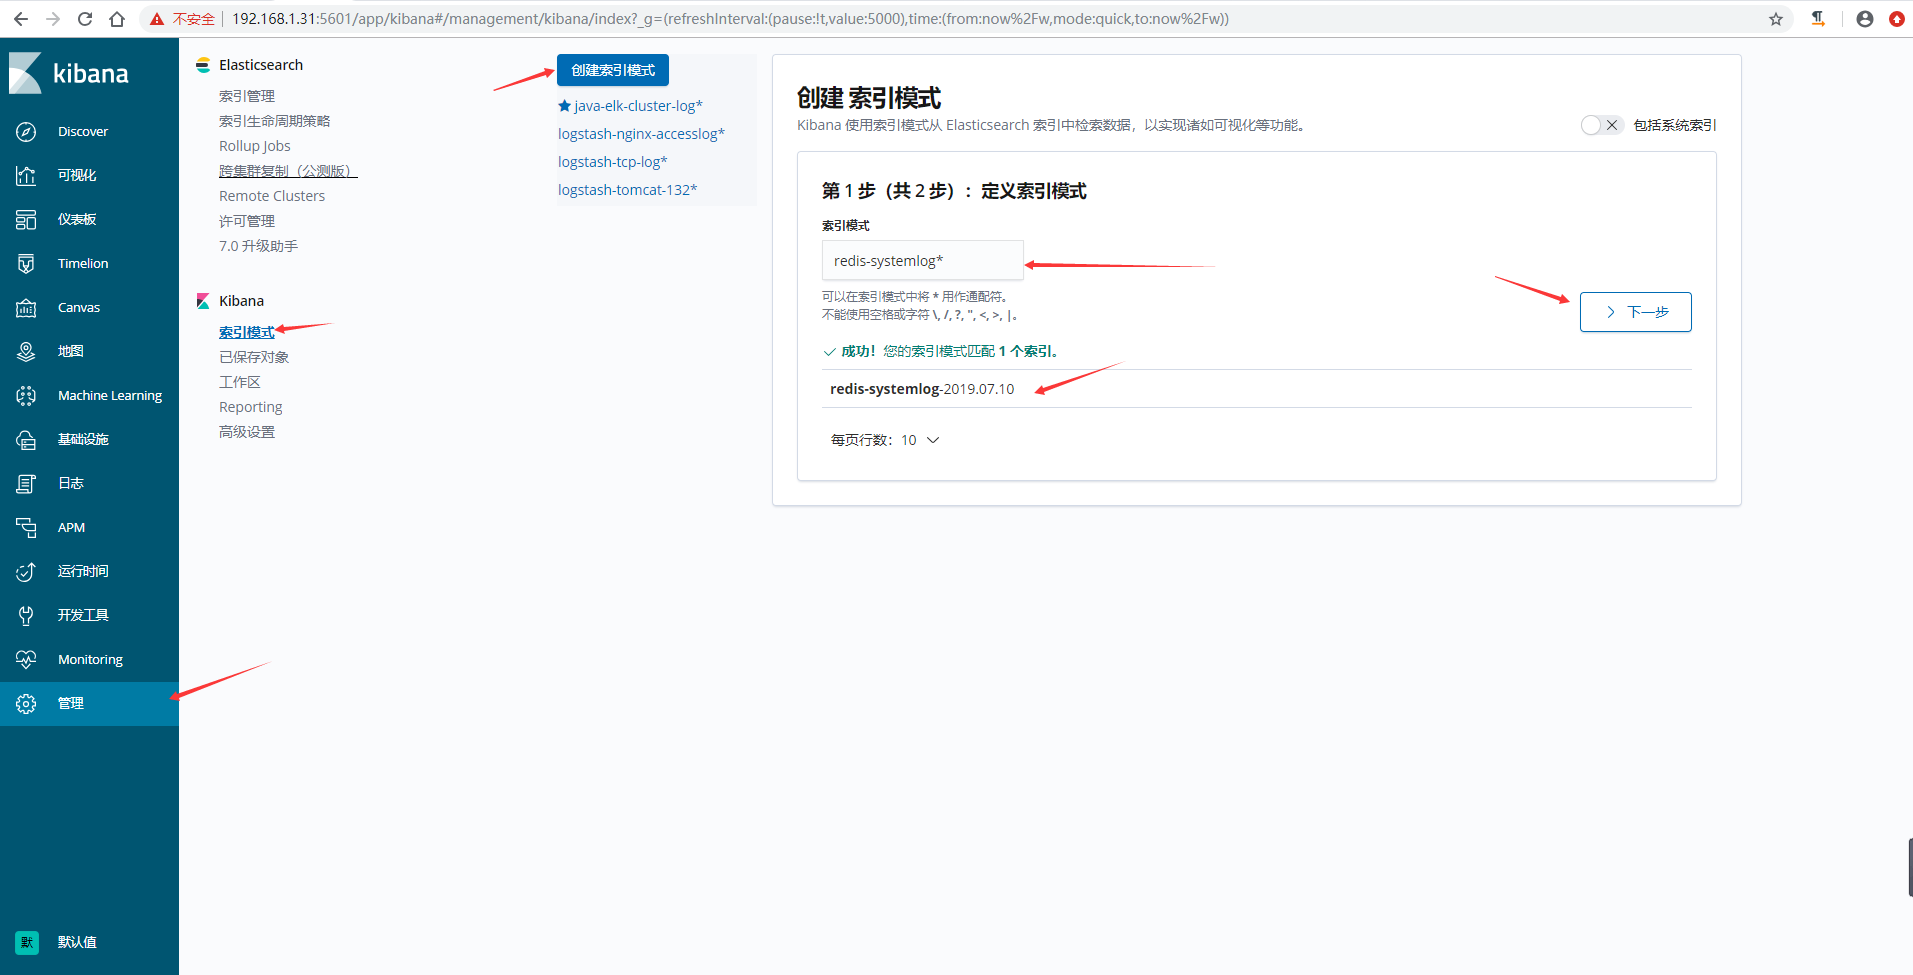
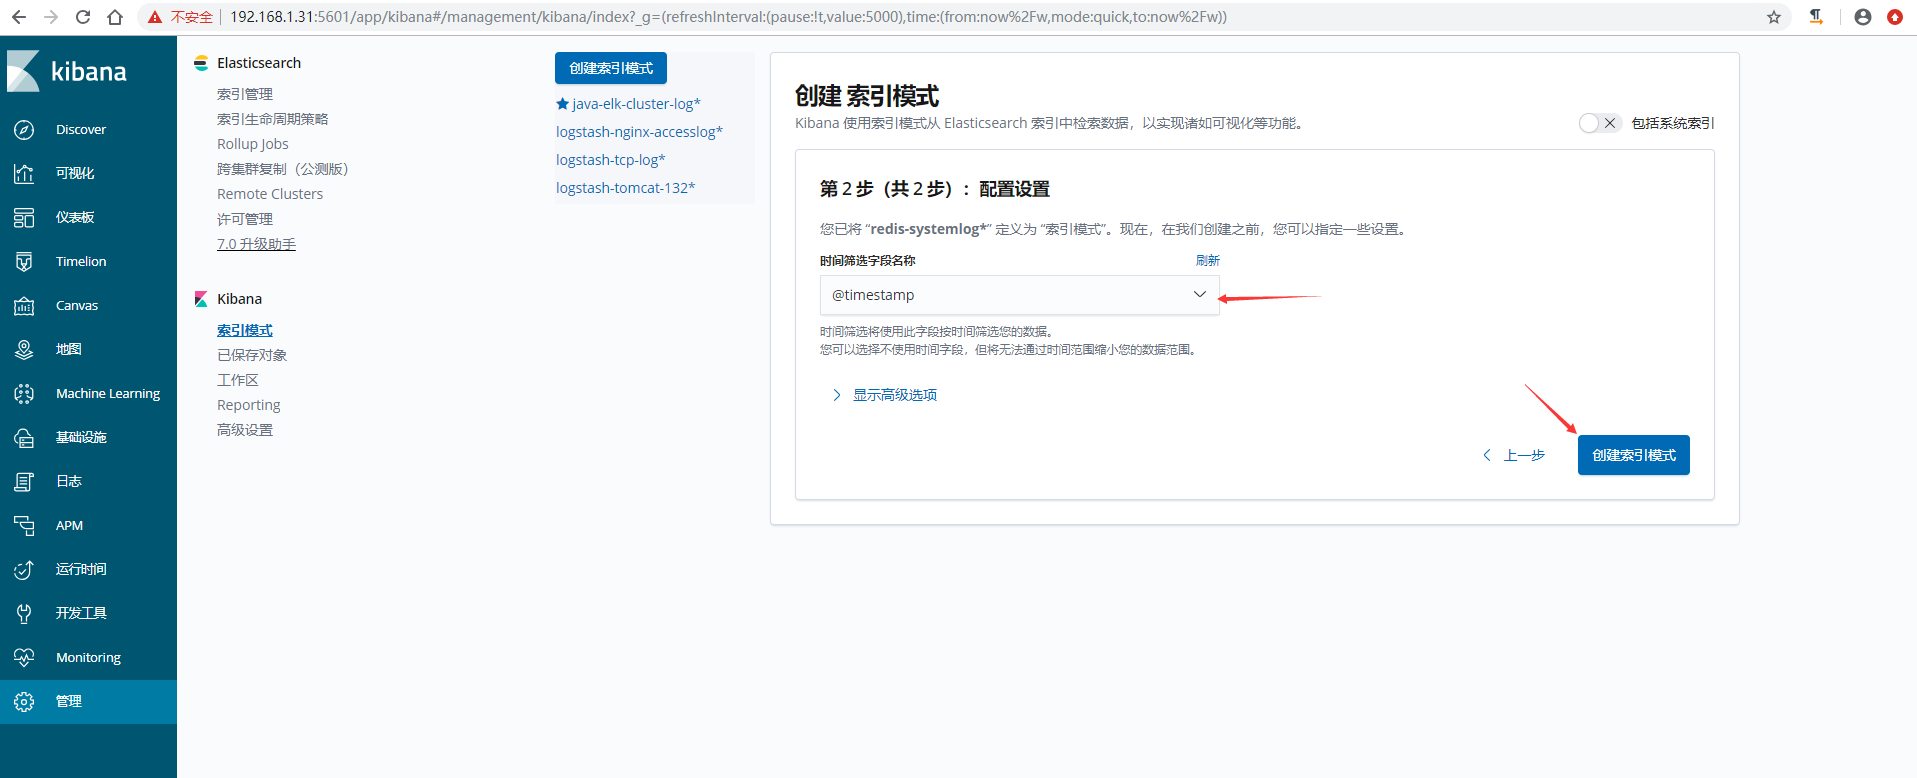
index => "redis-systemlog-%{+YYYY.MM.dd}"
}
}
测试logstash配置是否正确
[root@logstash ~]# /usr/share/logstash/bin/logstash -f /etc/logstash/conf.d/redis-read.conf -t
OpenJDK 64-Bit Server VM warning: If the number of processors is expected to increase from one, then you should configure the number of parallel GC threads appropriately using -XX:ParallelGCThreads=N
WARNING: Could not find logstash.yml which is typically located in $LS_HOME/config or /etc/logstash. You can specify the path using --path.settings. Continuing using the defaults
Could not find log4j2 configuration at path /usr/share/logstash/config/log4j2.properties. Using default config which logs errors to the console
[INFO ] 2019-07-10 16:41:50.576 [main] writabledirectory - Creating directory {:setting=>"path.queue", :path=>"/usr/share/logstash/data/queue"}
[INFO ] 2019-07-10 16:41:50.649 [main] writabledirectory - Creating directory {:setting=>"path.dead_letter_queue", :path=>"/usr/share/logstash/data/dead_letter_queue"}
[WARN ] 2019-07-10 16:41:51.498 [LogStash::Runner] multilocal - Ignoring the 'pipelines.yml' file because modules or command line options are specified
Configuration OK

[root@logstash ~]# systemctl restart logstash
验证redis的数据是否被取出
[root@linux-redis ~]# redis-cli -h 192.168.1.30
192.168.1.30:6379> AUTH 123321
OK
192.168.1.30:6379> SELECT 0
OK
192.168.1.30:6379> KEYS *
(empty list or set)     #这里数据已经为空
192.168.1.30:6379> SELECT 1
OK
192.168.1.30:6379[1]> KEYS *
(empty list or set)     #这里数据已经为空
head插件上验证数据

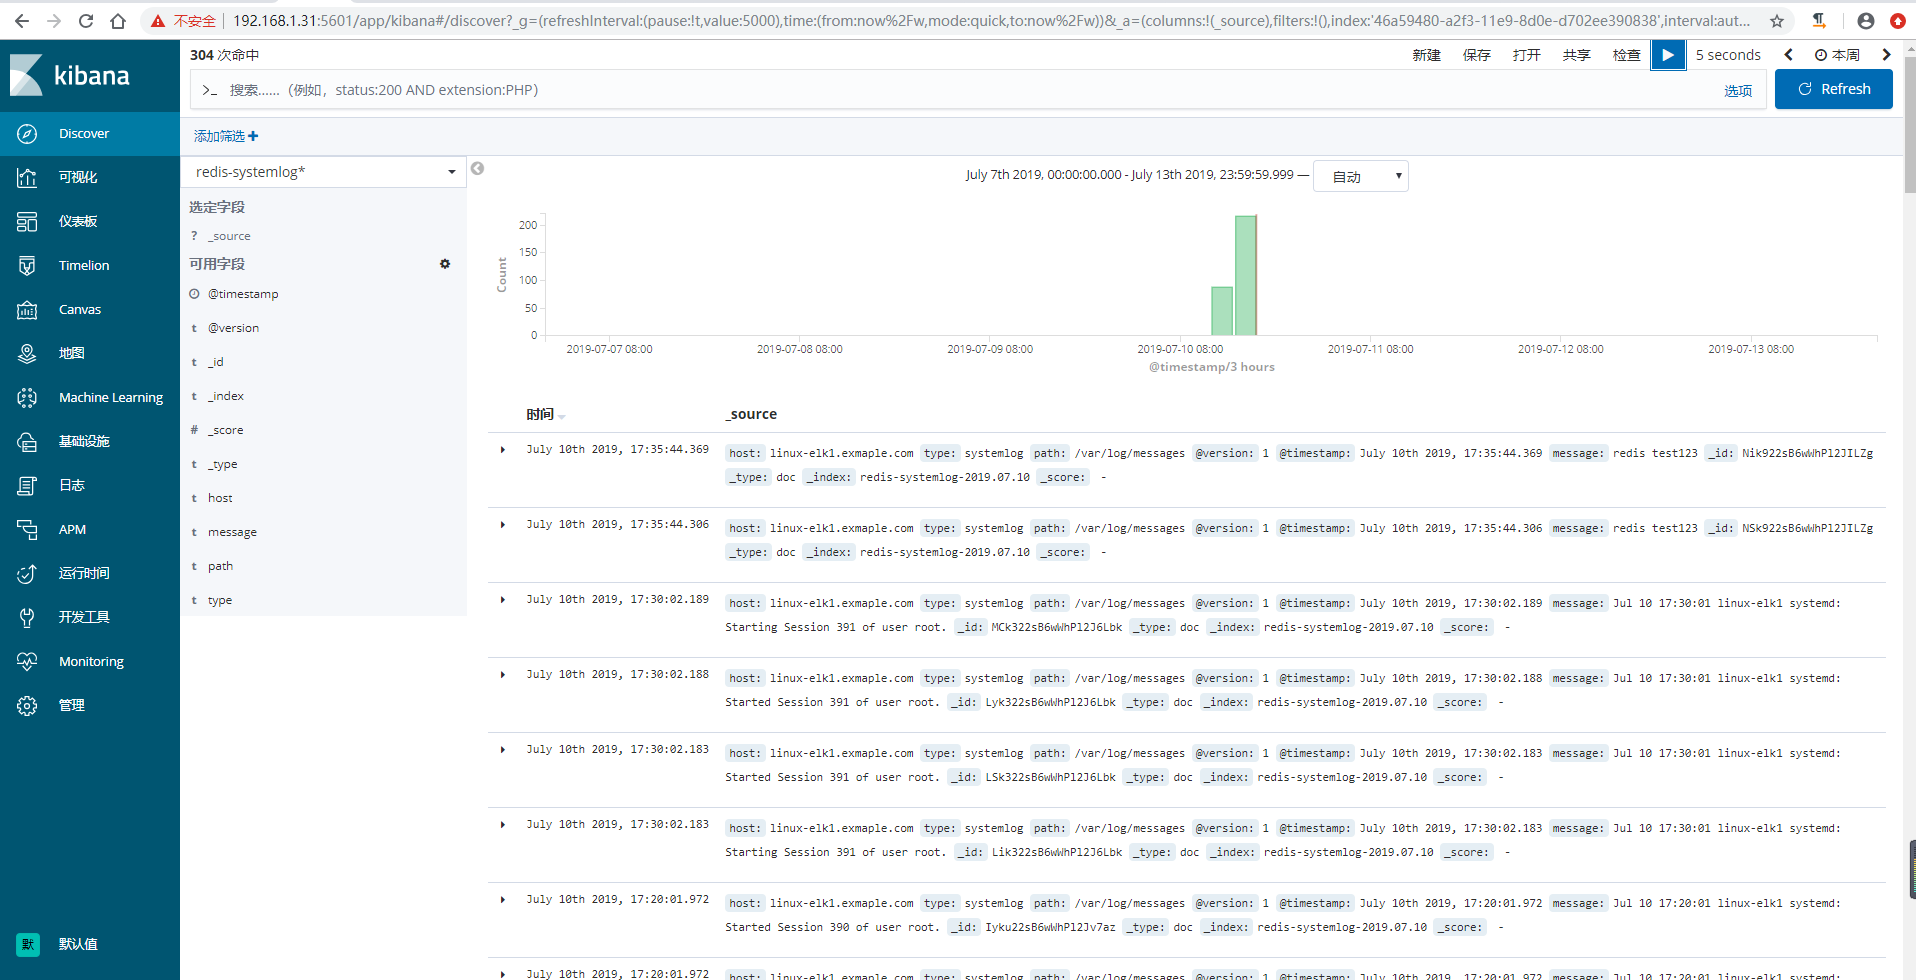
kibana界面创建索引模式并查看数据
ELK快速入门四-filebeat替代logstash收集日志
filebeat简介
Filebeat是轻量级单用途的日志收集工具,用于在没有安装java的服务器上专门收集日志,可以将日志转发到logstash、elasticsearch或redis等场景中进行下一步处理。
官网下载地址:https://www.elastic.co/cn/downloads/past-releases#filebeat
官方文档:https://www.elastic.co/guide/en/beats/filebeat/current/configuring-howto-filebeat.html
filebeat安装配置
1)下载filebeat
# 这里是在logstash服务器上面做的,为了测试,所以先将logstash停止。
[root@logstash ~]# systemctl stop logstash
[root@logstash ~]# wget https://artifacts.elastic.co/downloads/beats/filebeat/filebeat-6.8.1-x86_64.rpm
2)安装filebeat
[root@logstash ~]# yum -y localinstall filebeat-6.8.1-x86_64.rpm
配置filebeat收集系统日志输出到文件
1)编辑filebeat配置文件
[root@logstash ~]# cp /etc/filebeat/filebeat.yml{,.bak}
[root@logstash ~]# grep -v "#" /etc/filebeat/filebeat.yml |grep -v "^$"
filebeat.inputs:
- type: log    # 默认值 log ,表示一个日志读取源
  enabled: true    # 该配置是否生效,如果设置为 false 将不会收集该配置的日志
  paths:
    - /var/log/messages   # 要抓取的日志路径,写绝对路径,可以多个
    - /var/log/*.log
filebeat.config.modules:
  path: ${path.config}/modules.d/*.yml
  reload.enabled: false
setup.template.settings:
  index.number_of_shards: 3
setup.kibana:
output.file:
  path: "/tmp"
  filename: "filebeat.txt"
processors:
  - add_host_metadata: ~
  - add_cloud_metadata: ~

[root@logstash ~]# systemctl start filebeat
2)测试验证数据
[root@logstash ~]# echo "test" >> /var/log/messages

[root@logstash ~]# tail /tmp/filebeat.txt
{"@timestamp":"2019-07-11T02:18:10.331Z","@metadata":{"beat":"filebeat","type":"doc","version":"6.8.1"},"prospector":{"type":"log"},"input":{"type":"log"},"beat":{"name":"logstash","hostname":"logstash","version":"6.8.1"},"host":{"architecture":"x86_64","os":{"platform":"centos","version":"7 (Core)","family":"redhat","name":"CentOS Linux","codename":"Core"},"id":"12bcfdc379904e4eb20173a568ecd7df","containerized":false,"name":"logstash"},"source":"/var/log/messages","offset":53643,"log":{"file":{"path":"/var/log/messages"}},"message":"Jul 11 10:18:10 node01 systemd: Stopping Filebeat sends log files to Logstash or directly to Elasticsearch...."}
{"@timestamp":"2019-07-11T02:18:13.324Z","@metadata":{"beat":"filebeat","type":"doc","version":"6.8.1"},"prospector":{"type":"log"},"beat":{"version":"6.8.1","name":"logstash","hostname":"logstash"},"host":{"name":"logstash","architecture":"x86_64","os":{"family":"redhat","name":"CentOS Linux","codename":"Core","platform":"centos","version":"7 (Core)"},"id":"12bcfdc379904e4eb20173a568ecd7df","containerized":false},"log":{"file":{"path":"/var/log/messages"}},"message":"Jul 11 10:18:10 node01 systemd: Started Filebeat sends log files to Logstash or directly to Elasticsearch..","source":"/var/log/messages","offset":53754,"input":{"type":"log"}}
{"@timestamp":"2019-07-11T02:18:13.324Z","@metadata":{"beat":"filebeat","type":"doc","version":"6.8.1"},"host":{"architecture":"x86_64","name":"logstash","os":{"codename":"Core","platform":"centos","version":"7 (Core)","family":"redhat","name":"CentOS Linux"},"id":"12bcfdc379904e4eb20173a568ecd7df","containerized":false},"source":"/var/log/messages","offset":53862,"log":{"file":{"path":"/var/log/messages"}},"message":"Jul 11 10:18:10 node01 systemd: Starting Filebeat sends log files to Logstash or directly to Elasticsearch....","prospector":{"type":"log"},"input":{"type":"log"},"beat":{"name":"logstash","hostname":"logstash","version":"6.8.1"}}
{"@timestamp":"2019-07-11T02:18:48.328Z","@metadata":{"beat":"filebeat","type":"doc","version":"6.8.1"},"offset":53973,"log":{"file":{"path":"/var/log/messages"}},"message":"test","input":{"type":"log"},"prospector":{"type":"log"},"beat":{"name":"logstash","hostname":"logstash","version":"6.8.1"},"host":{"name":"logstash","os":{"version":"7 (Core)","family":"redhat","name":"CentOS Linux","codename":"Core","platform":"centos"},"id":"12bcfdc379904e4eb20173a568ecd7df","containerized":false,"architecture":"x86_64"},"source":"/var/log/messages"}
配置filebeat收集系统日志输出redis
1)编辑filebeat配置文件,修改输出
[root@logstash ~]# grep -v "#" /etc/filebeat/filebeat.yml |grep -v "^$"
filebeat.inputs:
- type: log
  enabled: true
  paths:
    - /var/log/messages
    - /var/log/*.log
filebeat.config.modules:
  path: ${path.config}/modules.d/*.yml
  reload.enabled: false
setup.template.settings:
  index.number_of_shards: 3
setup.kibana:
output.redis:
  hosts: ["192.168.1.30:6379"]    #redis服务器及端口
  key: "system-log-33"    #这里自定义key的名称,为了后期处理
  db: 1    #使用第几个库
  timeout: 5    #超时时间
  password: 123321    #redis 密码
processors:
  - add_host_metadata: ~
  - add_cloud_metadata: ~

[root@logstash ~]# systemctl restart filebeat
2)验证redis中是否有数据
[root@linux-redis ~]# redis-cli -h 192.168.1.30
192.168.1.30:6379> AUTH 123321
OK
192.168.1.30:6379> SELECT 1
OK
192.168.1.30:6379[1]> KEYS *
1) "system-log-33"
192.168.1.30:6379[1]> LLEN system-log-33
(integer) 3
3)logstash服务器上面配置从redis服务器中取数据
[root@linux-elk1 ~]# cat /etc/logstash/conf.d/redis-filebeat.conf
input {
redis {
data_type => "list"
host => "192.168.1.30"
password => "123321"
port => "6379"
db => "1"
key => "system-log-33"
}
}
output {
elasticsearch {
hosts => ["192.168.1.31:9200"]
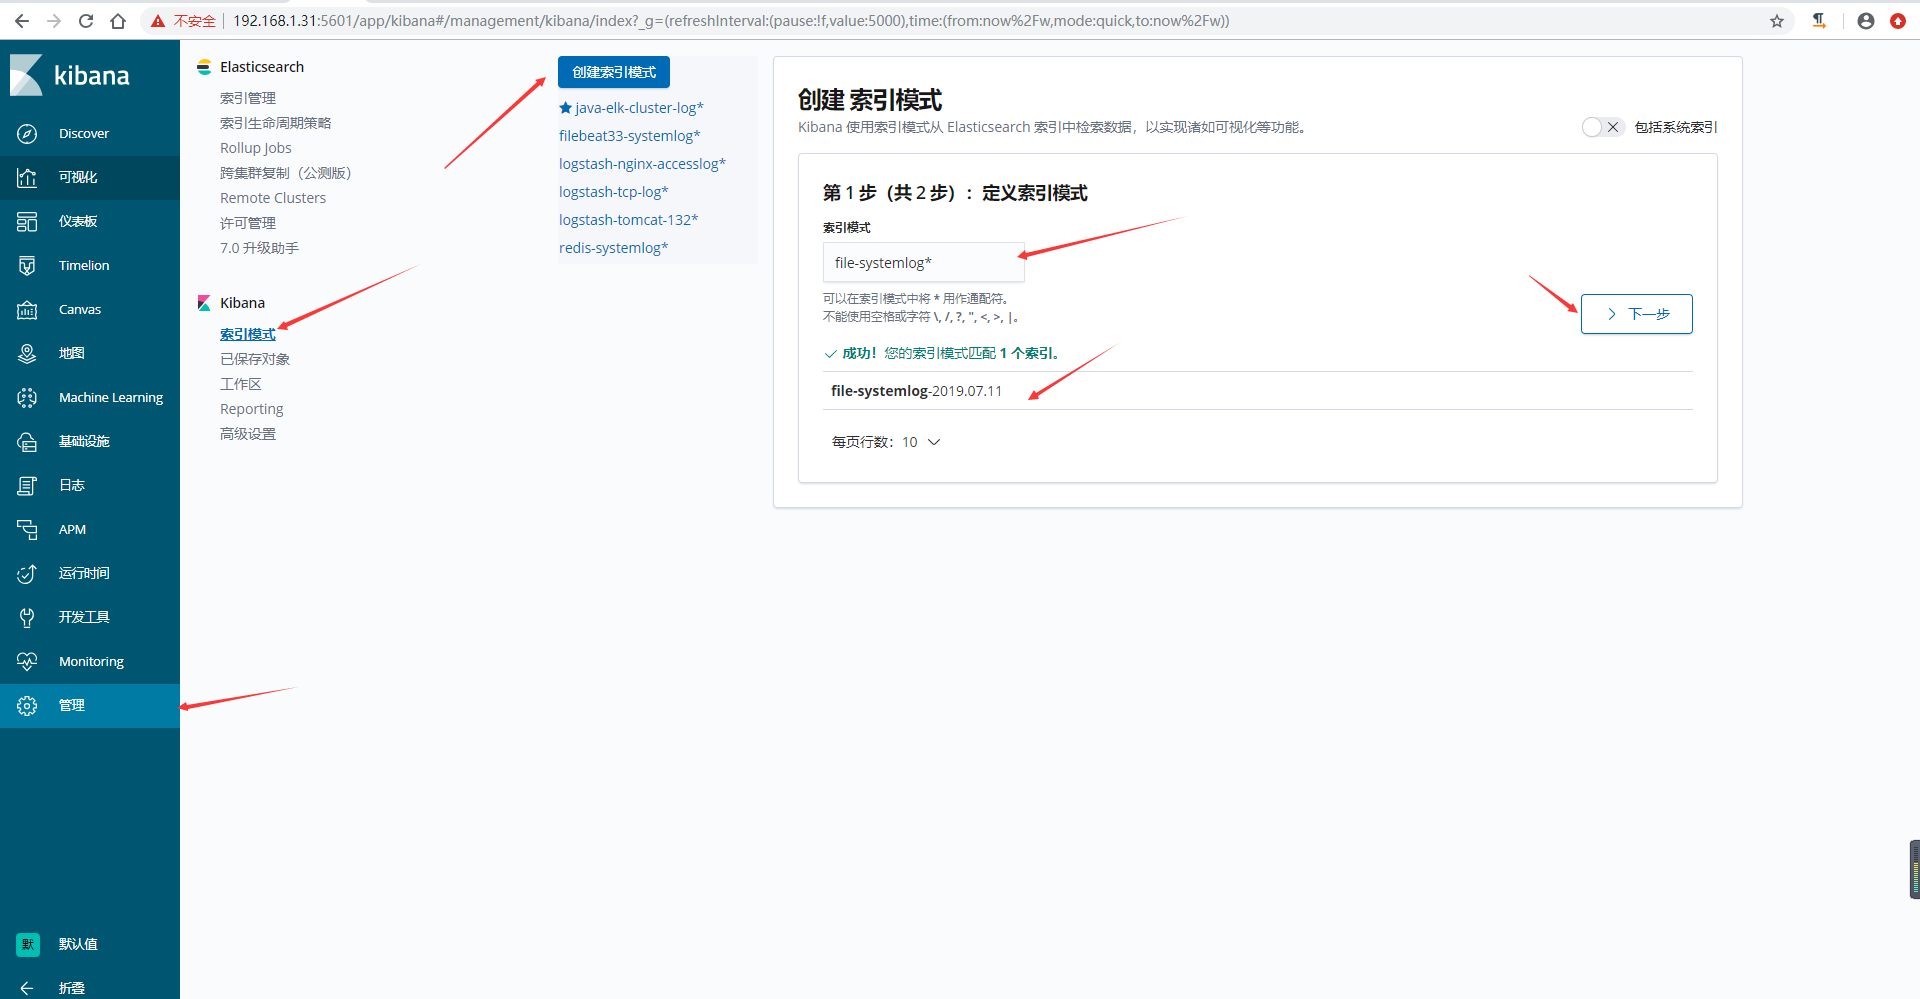
index => "file-systemlog-%{+YYYY.MM.dd}"
}
}
[root@linux-elk1 ~]# systemctl restart logstash
4)输入测试数据到日志文件里
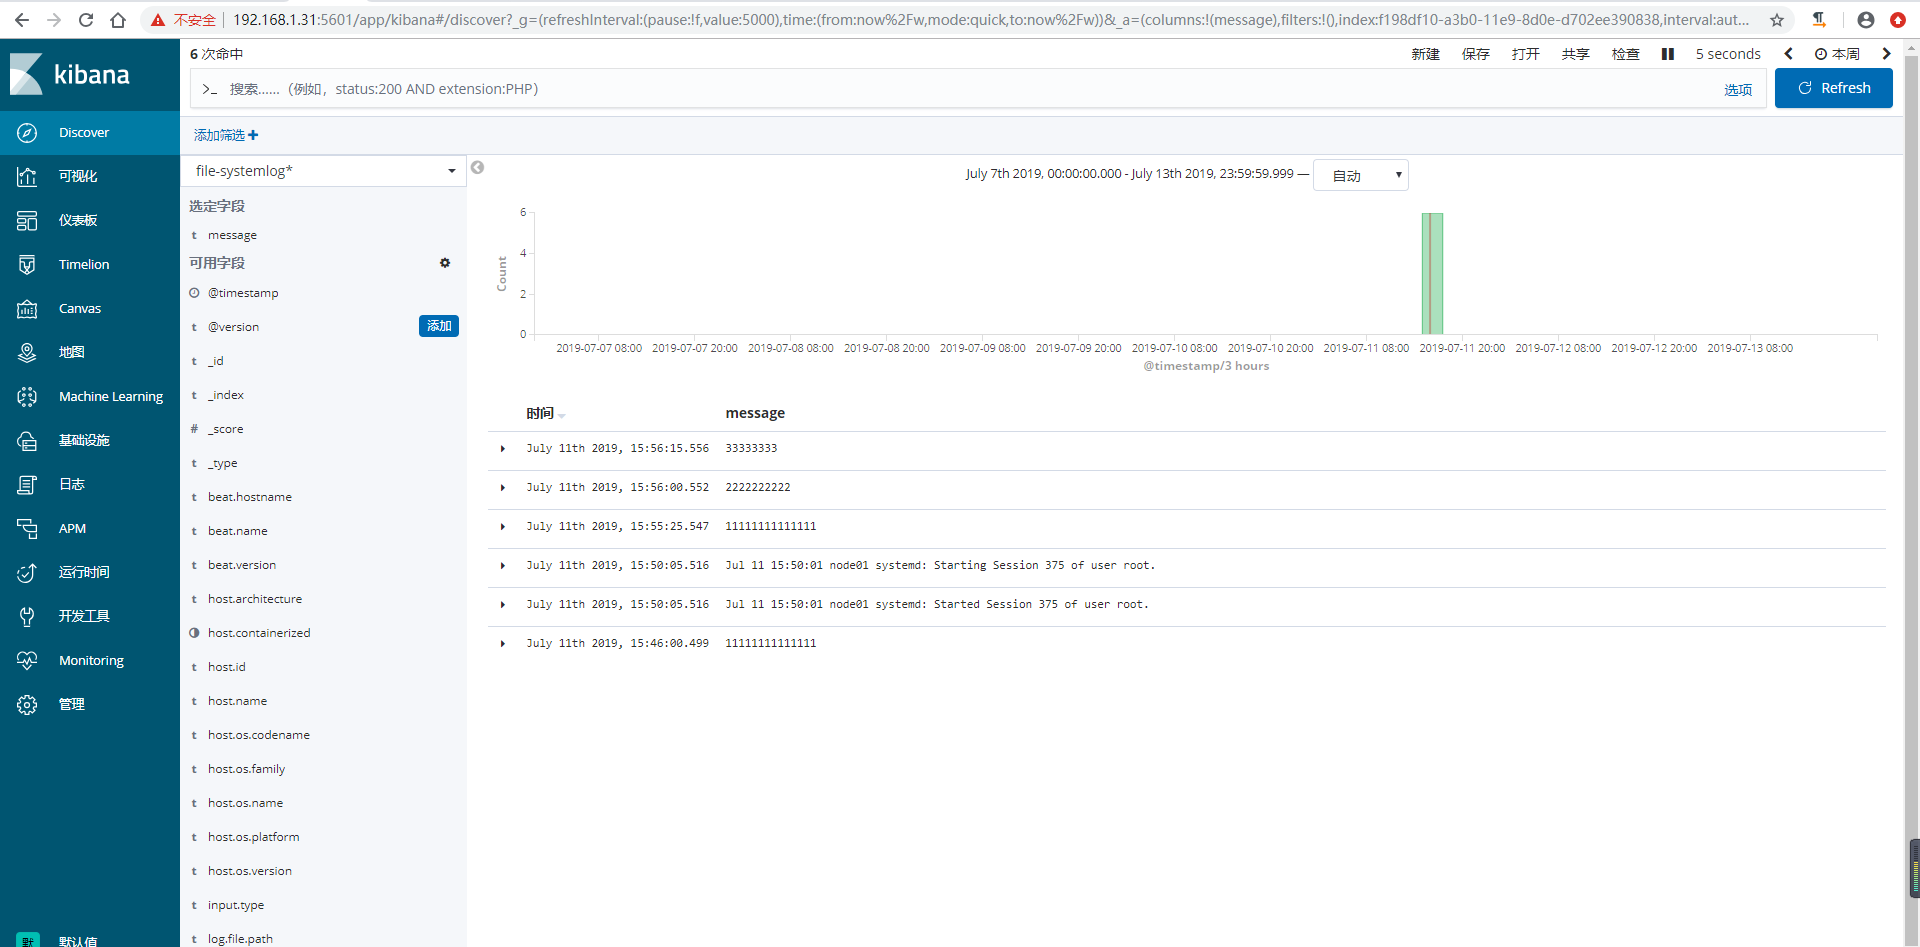
[root@logstash ~]# echo "11111111111111" >> /var/log/messages
[root@logstash ~]# echo "2222222222" >> /var/log/messages
[root@logstash ~]# echo "33333333" >> /var/log/messages
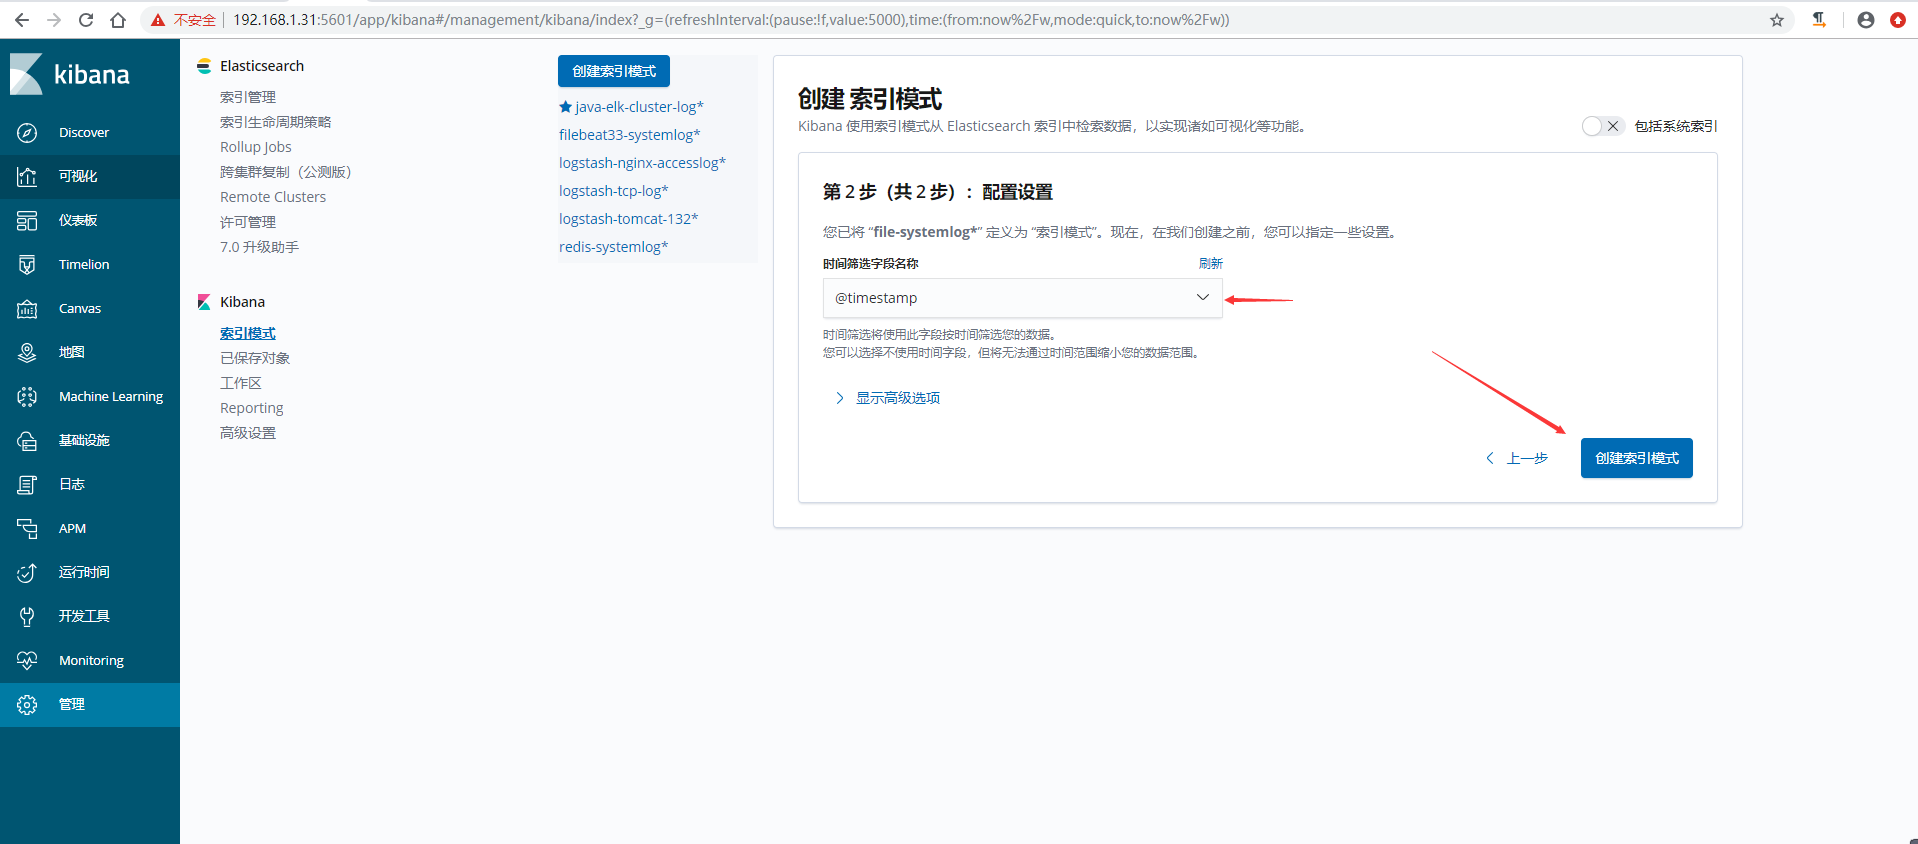
5)kibana界面创建索引模式
6)验证数据
ELK快速入门五-配置nginx代理kibana
由于kibana界面默认没有安全认证界面,为了保证安全,通过nginx进行代理并设置访问认证。
配置kibana
[root@linux-elk1 ~]# vim /etc/kibana/kibana.yml
server.host: "127.0.0.1"    #将监听地址更改为127.0.0.1
[root@linux-elk1 ~]# systemctl restart kibana
[root@linux-elk1 ~]# netstat -nlutp |grep 5601
tcp        0      0 127.0.0.1:5601          0.0.0.0:*               LISTEN      72068/node
部署nginx
1)安装nginx
[root@linux-elk1 ~]# yum -y install nginx httpd-tools
2)配置nginx
[root@linux-elk1 ~]# vim /etc/nginx/conf.d/kibana.conf
upstream kibana_server {
    server 127.0.0.1:5601 weight=1 max_fails=3 fail_timeout=60;
}

server {
    listen 80;
    server_name www.kibana.com;
    auth_basic "Restricted Access";
    auth_basic_user_file /etc/nginx/conf.d/htpasswd.users;
    location / {
        proxy_pass http://kibana_server;
        proxy_http_version 1.1;
        proxy_set_header Upgrade $http_upgrade;
        proxy_set_header Connection 'upgrade';
        proxy_set_header Host $host;
        proxy_cache_bypass $http_upgrade;
    }
}

[root@linux-elk1 ~]# htpasswd -bc /etc/nginx/conf.d/htpasswd.users admin 123456
Adding password for user admin
[root@linux-elk1 ~]# cat /etc/nginx/conf.d/htpasswd.users
admin:$apr1$ro5tQZp9$grhByziZtm3ZpZCsSFzsQ1
[root@linux-elk1 ~]# systemctl start nginx
3)windows上添加hosts, 路径C:\Windows\System32\drivers\etc\hosts
192.168.1.31 www.kibana.com
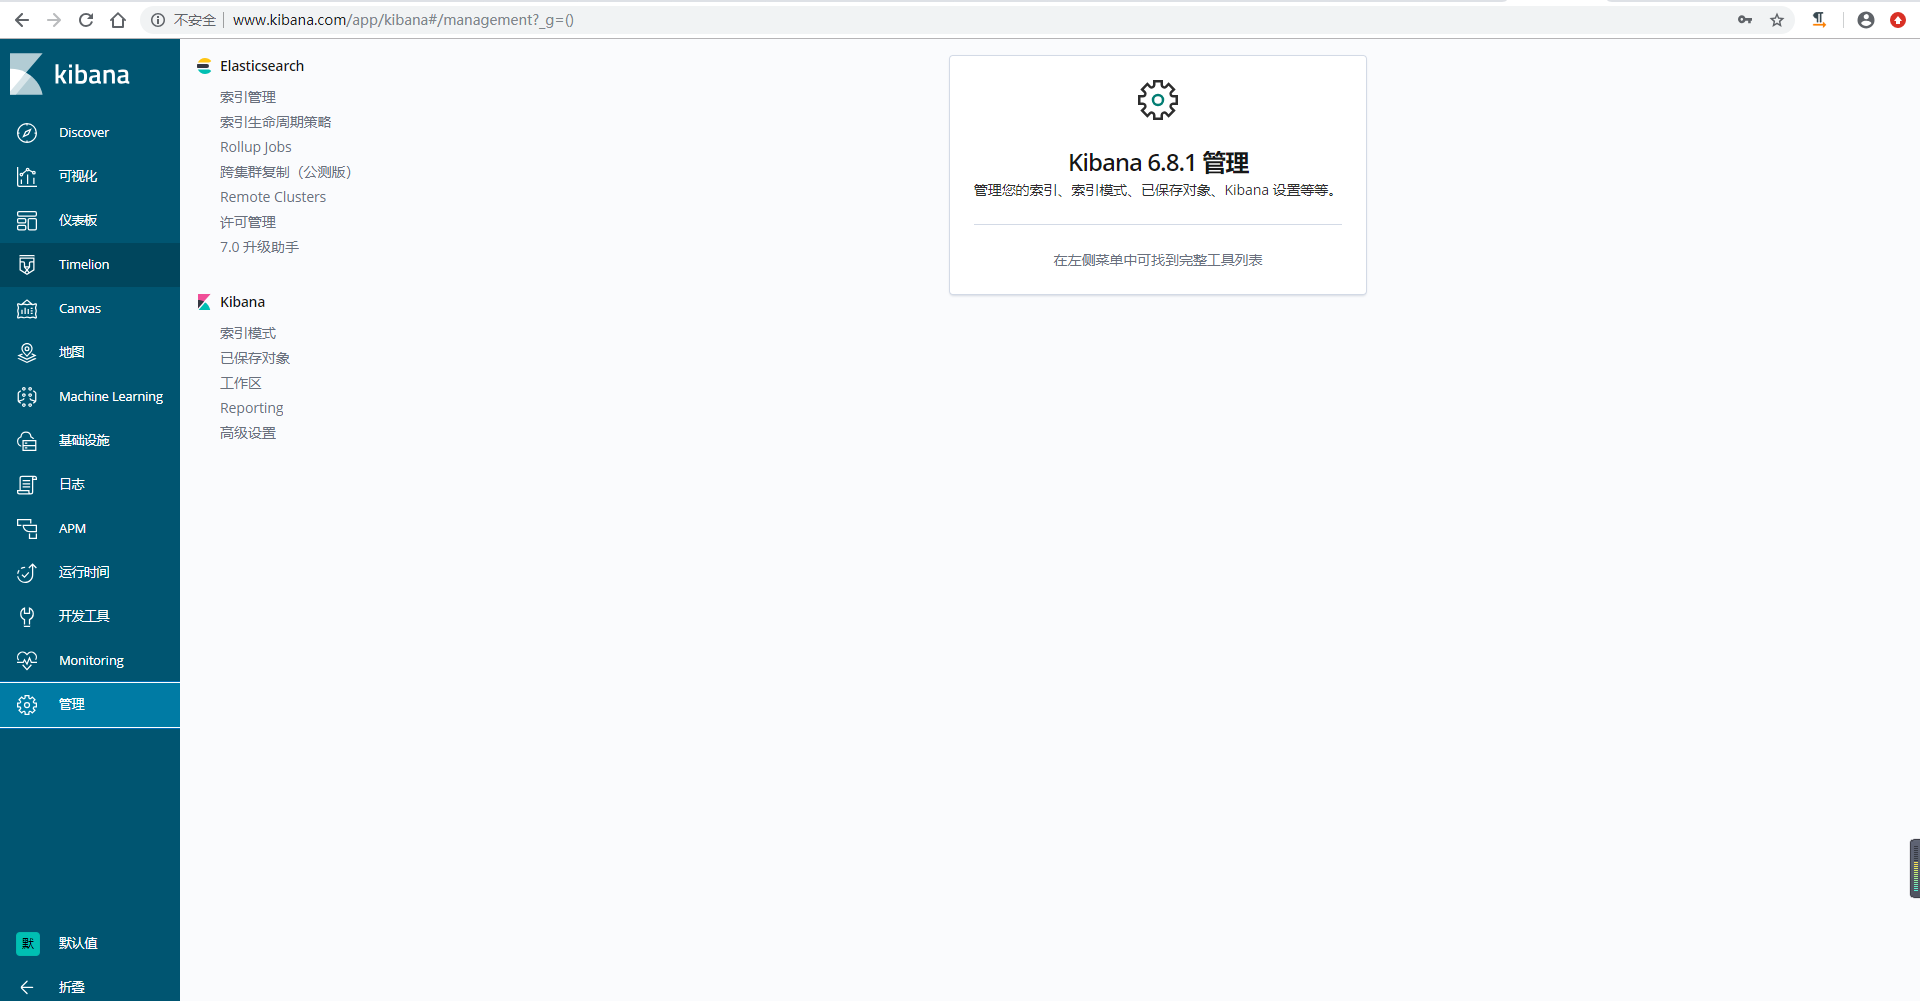
4)测试验证

-----------------------------------------------------------------------------
原文地址1:https://www.cnblogs.com/yanjieli/p/11187430.html
原文地址2:https://www.cnblogs.com/yanjieli/p/11187573.html
原文地址3:https://www.cnblogs.com/yanjieli/p/11187623.html
原文地址4:https://www.cnblogs.com/yanjieli/p/11187663.html
原文地址5:https://www.cnblogs.com/yanjieli/p/11187689.html


 2128
2128


 被折叠的 条评论
为什么被折叠?
被折叠的 条评论
为什么被折叠?
 到【灌水乐园】发言


