


前言:Node.js 提供了 trace event 的机制,在 Node.js 内核代码里,静态地埋了一些点,比如同步文件 IO 耗时,DNS 解析耗时等。每次执行这些代码时,Node.js 就会执行这些点的钩子,从而收集相应的数据。不过这个能力默认是关闭的,毕竟对性能会产生影响。我们可以通过 trace_events 模块打开这个功能。trace_events 模块会源源不断地把数据写到一个到多个文件中。除了通过 trace_events 模块之外,Node.js 也实现了通过 Inspector 协议收集 trace event 数据,本文介绍基于 inspector 协议收集 trace event 数据的实现。
首先看一下如何使用这种方式。
const { Session } = require('inspector');
const session = new Session();
session.connect();
function post(message, data) {
  return new Promise((resolve, reject) => {
    session.post(message, data, (err, result) => {
      if (err)
        reject(new Error(JSON.stringify(err)));
      else
        resolve(result);
    });
  });
}

async function test() {
	session.on('NodeTracing.dataCollected', (data) => {
	  console.log(data.params.value);
	});

	session.on('NodeTracing.tracingComplete', () => {
		console.log('done');
	});
	const { categories } = await post('NodeTracing.getCategories');
	const traceConfig = { includedCategories: categories };
	await post('NodeTracing.start', { traceConfig });
	setTimeout(() => {
		post('NodeTracing.stop');
	}, 1000);
}

test();
使用方式比较固定,也比较简单,trace event 是基于类型的,比如同步文件 IO,DNS 解析。所以第一步首先设置需要收集的模块类型,也可以通过 NodeTracing.getCategories 命令获取当前支持的模块类型。接着通过 NodeTracing.start 开启数据收集,收集一段时间后,通过 NodeTracing.stop 停止数据的收集,在这个过程中,收集的数据会通过 NodeTracing.dataCollected 事件源源不断地流向用户侧,我们可以保存这些数据后续进行分析,收集完毕后会触发 NodeTracing.tracingComplete 事件,从而完成整个过程。下面我们来看一下这些命令的实现。首先看一下整体的架构。
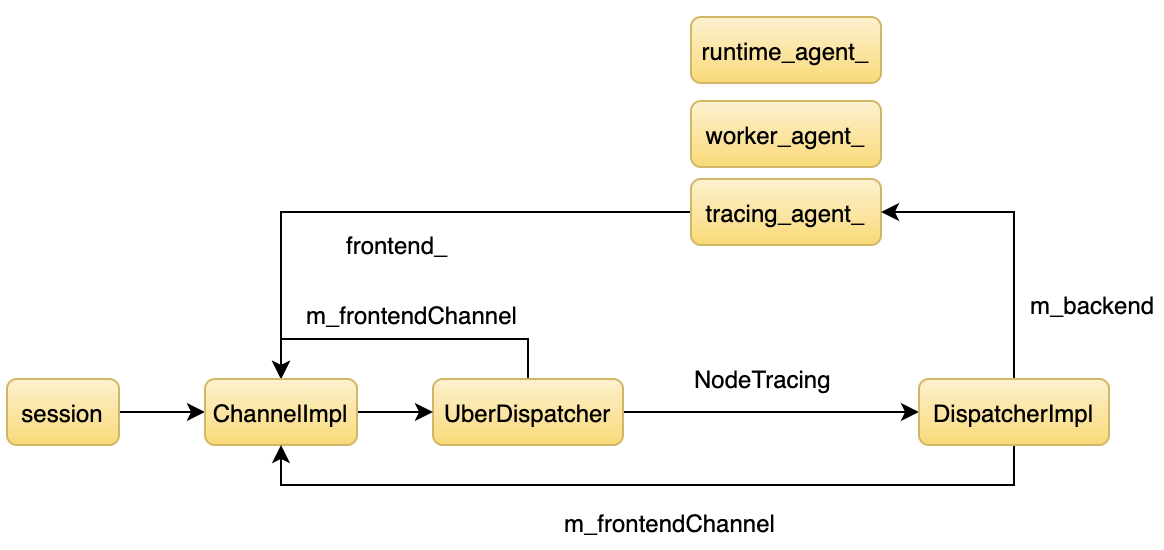
之前介绍过 Node.js Inspector 的架构,本文就不再具体展开介绍。简单来说,当我们通过 js 层的 session 发送命令时,代码流程从图的左边到右边,收集到数据时,代码流程从右往左回调 js 层。首先来看一下 NodeTracing.start。Node.js 的 Inspector 框架采用两级路由的机制,首先通过 NodeTracing 找到一级路由,在 inspetor 里叫 Domain,然后再通过 start 找到二级路由。
来看一下每个路由对应的函数。
m_dispatchMap["NodeTracing.getCategories"] = &DispatcherImpl::getCategories;
m_dispatchMap["NodeTracing.start"] = &DispatcherImpl::start;
m_dispatchMap["NodeTracing.stop"] = &DispatcherImpl::stop;
我们只关注 start 和 stop 的逻辑。
void DispatcherImpl::start(int callId, const String& method, const ProtocolMessage& message, std::unique_ptr<DictionaryValue> requestMessageObject, ErrorSupport* errors)
{
    protocol::DictionaryValue* object = DictionaryValue::cast(requestMessageObject->get("params"));
    protocol::Value* traceConfigValue = object ? object->get("traceConfig") : nullptr;
    std::unique_ptr<protocol::NodeTracing::TraceConfig> in_traceConfig = ValueConversions<protocol::NodeTracing::TraceConfig>::fromValue(traceConfigValue, errors);

    std::unique_ptr<DispatcherBase::WeakPtr> weak = weakPtr();
    DispatchResponse response = m_backend->start(std::move(in_traceConfig));
    if (weak->get())
        weak->get()->sendResponse(callId, response);
    return;
}
start 里调用了 m_backend->start,根据架构图可知道 m_backend 的值是 TracingAgent 对象。
DispatchResponse TracingAgent::start(std::unique_ptr<protocol::NodeTracing::TraceConfig> traceConfig) {

  std::set<std::string> categories_set;
  protocol::Array<std::string>* categories = traceConfig->getIncludedCategories();
  for (size_t i = 0; i < categories->length(); i++)
    categories_set.insert(categories->get(i));

  tracing::AgentWriterHandle* writer = GetTracingAgentWriter();
  if (writer != nullptr) {
    trace_writer_ =
        writer->agent()->AddClient(categories_set,
                                   std::make_unique<InspectorTraceWriter>(
                                       frontend_object_id_, main_thread_),
                                   tracing::Agent::kIgnoreDefaultCategories);
  }
  return DispatchResponse::OK();
}
最终通过 AddClient 往 tracing 系统注册了一个消费者。当tracing 系统产生数据时,就会通过 InspectorTraceWriter 进行消费,看一下这个 InspectorTraceWriter 对象的核心逻辑。
 void AppendTraceEvent(
      v8::platform::tracing::TraceObject* trace_event) override {
    if (!json_writer_)
      json_writer_.reset(TraceWriter::CreateJSONTraceWriter(stream_, "value"));
    json_writer_->AppendTraceEvent(trace_event);
  }

  void Flush(bool) override {
    if (!json_writer_)
      return;
    json_writer_.reset();
    std::ostringstream result(
        "{\"method\":\"NodeTracing.dataCollected\",\"params\":",
        std::ostringstream::ate);
    result << stream_.str();
    result << "}";
    main_thread_->Post(std::make_unique<SendMessageRequest>(frontend_object_id_,
                                                            result.str()));
    stream_.str("");
  }
tracing 系统调用 AppendTraceEvent 进行数据的消费,不过这些数据会先缓存到内存,然后再调用 Flush 通知真正的消费者,在 Flush 函数里我们可以看到,通过发送一个 SendMessageRequest 触发了 NodeTracing.dataCollected 事件。接着看一下 SendMessageRequest 的逻辑。
void Call(MainThreadInterface* thread) override {
  DeletableFrontendWrapper* frontend_wrapper = static_cast<DeletableFrontendWrapper*>(thread->GetObjectIfExists(object_id_));
  if (frontend_wrapper == nullptr) return;
  auto frontend = frontend_wrapper->get();
  if (frontend != nullptr) {
    frontend->sendRawJSONNotification(message_);
  }
}

void Frontend::sendRawJSONNotification(String notification)
{
    m_frontendChannel->sendProtocolNotification(InternalRawNotification::fromJSON(std::move(notification)));
}
Call 又调用了 m_frontendChannel->sendRawJSONNotification,根据架构图,m_frontendChannel 的值是 ChannelImpl。最后通过 ChannelImpl 通知用户侧。
接着看 stop 的逻辑。
DispatchResponse TracingAgent::stop() {
  trace_writer_.reset();
  frontend_->tracingComplete();
  return DispatchResponse::OK();
}
首先看一下 trace_writer_.reset()。
void AgentWriterHandle::reset() {
  if (agent_ != nullptr)
    agent_->Disconnect(id_);
  agent_ = nullptr;
}

void Agent::Disconnect(int client) {
  if (client == kDefaultHandleId) return;
  {
    Mutex::ScopedLock lock(initialize_writer_mutex_);
    to_be_initialized_.erase(writers_[client].get());
  }
  ScopedSuspendTracing suspend(tracing_controller_.get(), this);
  writers_.erase(client);
  categories_.erase(client);
}
接着看 ScopedSuspendTracing。
ScopedSuspendTracing(TracingController* controller, Agent* agent,
                       bool do_suspend = true)
    : controller_(controller), agent_(do_suspend ? agent : nullptr) {
    if (do_suspend) {
      CHECK(agent_->started_);
      controller->StopTracing();
    }
}

void TracingController::StopTracing() {
 base::MutexGuard lock(mutex_.get());
 trace_buffer_->Flush();
}
把所有数据 Flush 到用户侧后触发 tracingComplete 事件。
void Frontend::tracingComplete()
{
    if (!m_frontendChannel)
        return;
    m_frontendChannel->sendProtocolNotification(InternalResponse::createNotification("NodeTracing.tracingComplete"));
}
时间关系,大概介绍到这。


 429
429


 被折叠的 条评论
为什么被折叠?
被折叠的 条评论
为什么被折叠?
 到【灌水乐园】发言


