


前言:CPU Profiler 是应用性能诊断和优化的利器,本文介绍 V8 中关于这部分的实现,细节比较多也比较复杂,大致分析一下原理,代码来自 V8 10.2。
开始分析前,先来看一下对象的关系图(从左往右看),这个对后面的分析比较重要,因为他们的关系错综复杂。
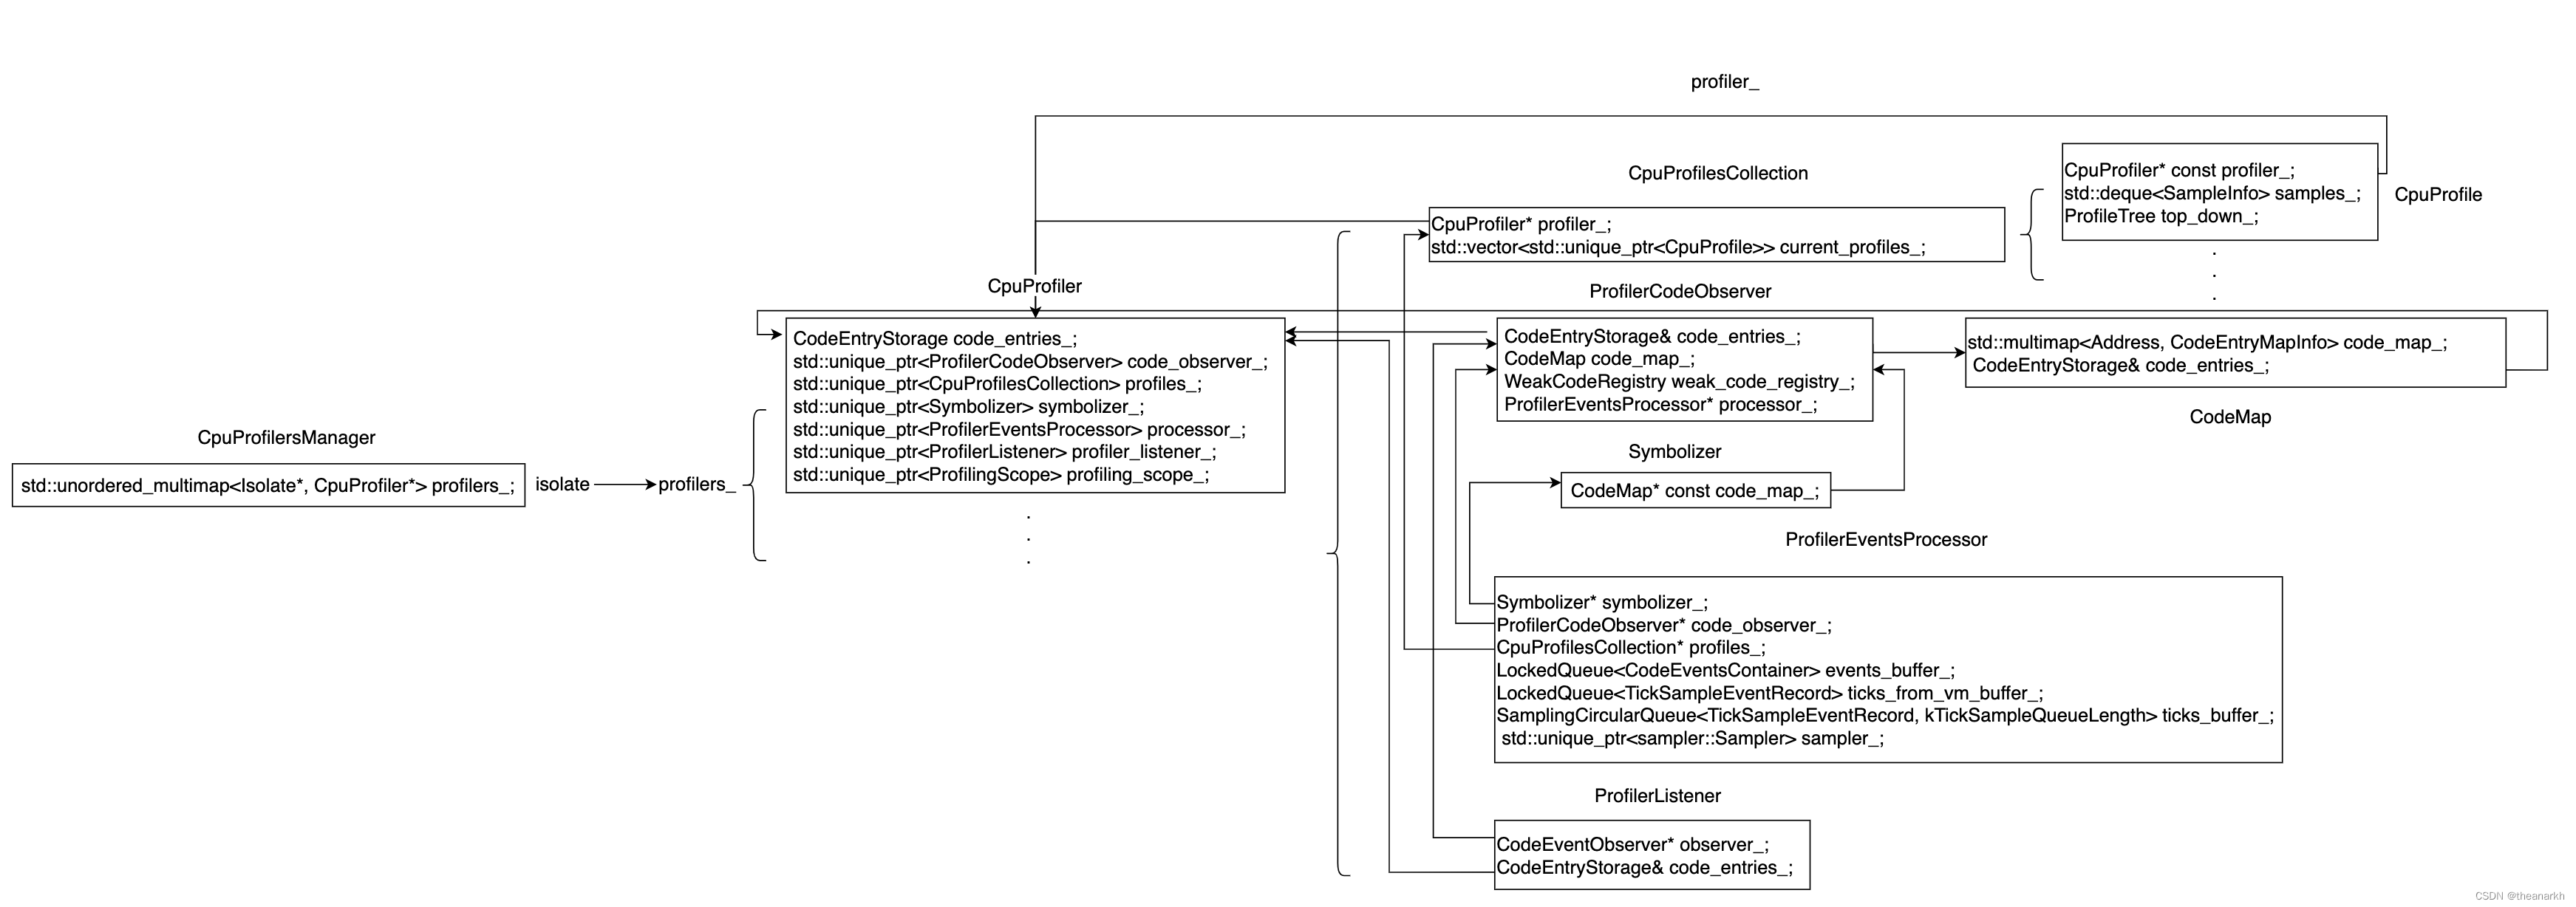
下面开始分析。入口对象为 CpuProfiler。CpuProfiler 负责管理多个 CpuProfile,而我们进行一次 CPU Profile 时对应的就是一个 CpuProfile 对象。首先看一下 CpuProfiler 的构造函数。
CpuProfiler::CpuProfiler(Isolate* isolate, CpuProfilingNamingMode naming_mode,
                         CpuProfilingLoggingMode logging_mode)
    : CpuProfiler(isolate, naming_mode, logging_mode,
                  new CpuProfilesCollection(isolate), nullptr, nullptr,
                  new ProfilerCodeObserver(isolate, code_entries_)) {}

CpuProfiler::CpuProfiler(Isolate* isolate, CpuProfilingNamingMode naming_mode,
                         CpuProfilingLoggingMode logging_mode,
                         CpuProfilesCollection* test_profiles,
                         Symbolizer* test_symbolizer,
                         ProfilerEventsProcessor* test_processor,
                         ProfilerCodeObserver* test_code_observer)
    : isolate_(isolate),
      // 多久采样一次,可以通过命令行和代码设置
      base_sampling_interval_(base::TimeDelta::FromMicroseconds(
          FLAG_cpu_profiler_sampling_interval)),
      code_observer_(test_code_observer),
      profiles_(test_profiles),
      symbolizer_(test_symbolizer),
      processor_(test_processor),
      is_profiling_(false) {
  profiles_->set_cpu_profiler(this);
  GetProfilersManager()->AddProfiler(isolate, this);

  if (logging_mode == kEagerLogging) EnableLogging();
}
构造函数的逻辑比较简单,只是进行一些初始化操作。然后看一下当开始采集时的逻辑。
CpuProfilingResult CpuProfiler::StartProfiling(
    const char* title, CpuProfilingOptions options,
    std::unique_ptr<DiscardedSamplesDelegate> delegate) {
  CpuProfilingResult result =
      profiles_->StartProfiling(title, options, std::move(delegate));

  if (result.status == CpuProfilingStatus::kStarted ||
      result.status == CpuProfilingStatus::kAlreadyStarted) {
    AdjustSamplingInterval();
    StartProcessorIfNotStarted();
  }

  return result;
}
首先调了 CpuProfilesCollection 对象的 StartProfiling。
CpuProfilingResult CpuProfilesCollection::StartProfiling(
    ProfilerId id, const char* title, CpuProfilingOptions options,
    std::unique_ptr<DiscardedSamplesDelegate> delegate) {
  current_profiles_semaphore_.Wait();
  // 判断 profile 次数是否超过阈值
  if (static_cast<int>(current_profiles_.size()) >= kMaxSimultaneousProfiles) {
    current_profiles_semaphore_.Signal();
    return {
        0,
        CpuProfilingStatus::kErrorTooManyProfilers,
    };
  }
  // 是否重复了
  for (const std::unique_ptr<CpuProfile>& profile : current_profiles_) {
    if ((profile->title() != nullptr && title != nullptr &&
         strcmp(profile->title(), title) == 0) ||
        profile->id() == id) {

      current_profiles_semaphore_.Signal();
      return {
          profile->id(),
          CpuProfilingStatus::kAlreadyStarted,
      };
    }
  }
  // 新建一个 CpuProfile 对象存到 current_profiles_ 数组中
  CpuProfile* profile =
      new CpuProfile(profiler_, id, title, options, std::move(delegate));
  current_profiles_.emplace_back(profile);
  current_profiles_semaphore_.Signal();

  return {
      profile->id(),
      CpuProfilingStatus::kStarted,
  };
}
StartProfiling 会新建一个 CpuProfile 来表示一次 CPU Profile 操作,从 CpuProfilesCollection 命名也可以看出,该对象用于管理多个 CPU Profile 对象。新建完后执行 StartProcessorIfNotStarted 开始 Profile。
void CpuProfiler::StartProcessorIfNotStarted() {
  // 如果已经创建了 profile 线程则不再创建,并把当前的栈记录下来
  if (processor_) {
    processor_->AddCurrentStack();
    return;
  }
  // 代码处理相关
  if (!symbolizer_) {
    symbolizer_ = std::make_unique<Symbolizer>(code_observer_->code_map());
  }
  // 计算采集时间间隔
  base::TimeDelta sampling_interval = ComputeSamplingInterval();
  // 创建采集线程
  processor_.reset(new SamplingEventsProcessor(
      isolate_, symbolizer_.get(), code_observer_.get(), profiles_.get(),
      sampling_interval, use_precise_sampling_));
  is_profiling_ = true;

  // 记录当前栈信息
  processor_->AddCurrentStack();
  // 启动线程,阻塞等待线程创建成功
  /*
      bool StartSynchronously() {
        start_semaphore_ = new Semaphore(0);
        if (!Start()) return false;
        start_semaphore_->Wait();
        delete start_semaphore_;
        start_semaphore_ = nullptr;
        return true;
      }

  */
  processor_->StartSynchronously();
}
接着看采集线程 SamplingEventsProcessor 的实现。
class SamplingEventsProcessor
    : public ProfilerEventsProcessor {}

class ProfilerEventsProcessor : public base::Thread,
                                public CodeEventObserver {}
从继承关系可以看到创建 SamplingEventsProcessor 对象会创建一个线程对象,但是这个线程不会自动启动,需要主动调用 Start 函数,具体调用时机在 StartSynchronously 函数中,接下来看一下 SamplingEventsProcessor 的构造函数。
SamplingEventsProcessor::SamplingEventsProcessor(
    Isolate* isolate, Symbolizer* symbolizer,
    ProfilerCodeObserver* code_observer, CpuProfilesCollection* profiles,
    base::TimeDelta period, bool use_precise_sampling)
    : ProfilerEventsProcessor(isolate, symbolizer, code_observer, profiles),
      sampler_(new CpuSampler(isolate, this)),
      period_(period),
      use_precise_sampling_(use_precise_sampling) {
  sampler_->Start();
}
SamplingEventsProcessor 对象中新建了一个 CpuSampler 对象,这是非常核心的对象,它负责采集。来看一下 CpuSampler 的 Start 函数做了什么。
void Sampler::Start() {
  SetActive(true);
  // 使用信号机制进行采样
#if defined(USE_SIGNALS)
  SignalHandler::IncreaseSamplerCount();
  SamplerManager::instance()->AddSampler(this);
#endif
}
非 Windows 平台采用的是定时给主线程发送 SIGPROF 信号进行采样,所以需要先注册信号处理函数,看一下 IncreaseSamplerCount。
 static void IncreaseSamplerCount() {
    base::MutexGuard lock_guard(mutex_.Pointer());
    if (++client_count_ == 1) Install();
 }

 static void Install() {
    struct sigaction sa;
    sa.sa_sigaction = &HandleProfilerSignal;
    sigemptyset(&sa.sa_mask);
#if V8_OS_QNX
    sa.sa_flags = SA_SIGINFO | SA_ONSTACK;
#else
    sa.sa_flags = SA_RESTART | SA_SIGINFO | SA_ONSTACK;
#endif
    signal_handler_installed_ =
        (sigaction(SIGPROF, &sa, &old_signal_handler_) == 0);
  }
注册 SIGPROF 信号的处理函数是 HandleProfilerSignal,我们一会再分析。注册完信号把 Sampler 对象加入到 SamplerManager。SamplerManager 以线程 id 为键,值是一个 Sample 队列。注册完信号和初始化完 Sampler 后,就等待线程发送的定时信号。接下来看一下采集线程的逻辑。
void SamplingEventsProcessor::Run() {
  base::MutexGuard guard(&running_mutex_);
  while (running_.load(std::memory_order_relaxed)) {
    base::TimeTicks nextSampleTime = base::TimeTicks::Now() + period_;
    base::TimeTicks now;
    SampleProcessingResult result;
    do {
      // 处理采集的信息
      result = ProcessOneSample();
      // 处理 Code Event
      if (result == FoundSampleForNextCodeEvent) {
        ProcessCodeEvent();
      }
      now = base::TimeTicks::Now();
      // 没有数据可以处理或者下一次采集时间到则退出
    } while (result != NoSamplesInQueue && now < nextSampleTime);
    // 是否因为没有数据处理而退出上面的循环
    if (nextSampleTime > now) {
      {
        // 还没有下一次采集时间,等待时间到
        while (now < nextSampleTime &&
               running_cond_.WaitFor(&running_mutex_, nextSampleTime - now)) {
          if (!running_.load(std::memory_order_relaxed)) {
            break;
          }
          now = base::TimeTicks::Now();
        }
      }
    }

    // 进行一次采集
    sampler_->DoSample();
  }

  // Process remaining tick events.
  do {
    SampleProcessingResult result;
    do {
      result = ProcessOneSample();
    } while (result == OneSampleProcessed);
  } while (ProcessCodeEvent());
}
```c
线程的逻辑分为两个部分,一部分是处理数据,一部分是发起采集,即发送 SIGPROF 信号,我们先看发起采集。
```c
void Sampler::DoSample() {
  // 是否注册了信号处理函数
  if (!SignalHandler::Installed()) return;
  // 设置自己为需要采集状态,SamplerManager 里会判断
  SetShouldRecordSample();
  // 给线程发送 SIGPROF 信号
  pthread_kill(platform_data()->vm_tid(), SIGPROF);
}
发送完信号后看一下信号处理函数的逻辑。
void SignalHandler::HandleProfilerSignal(int signal, siginfo_t* info, void* context) {
  if (signal != SIGPROF) return;
  v8::RegisterState state;
  // 记录用户执行上下文
  FillRegisterState(context, &state);
  // 开始采集
  SamplerManager::instance()->DoSample(state);
}
看一下 FillRegisterState。
void SignalHandler::FillRegisterState(void* context, RegisterState* state) {
  // context 保存了信号中断前用户执行的上下文信息
  ucontext_t* ucontext = reinterpret_cast<ucontext_t*>(context);
  // 这部分信息是平台独立的,比如我的电脑是对应以下字段
  mcontext_t& mcontext = ucontext->uc_mcontext;
  state->pc = reinterpret_cast<void*>(mcontext->__ss.__rip);
  state->sp = reinterpret_cast<void*>(mcontext->__ss.__rsp);
  state->fp = reinterpret_cast<void*>(mcontext->__ss.__rbp);
拿到当前执行上下文后调用 DoSample 开始采集。
void SamplerManager::DoSample(const v8::RegisterState& state) {
  AtomicGuard atomic_guard(&samplers_access_counter_, false);
  if (!atomic_guard.is_success()) return;
  pthread_t thread_id = pthread_self();
  auto it = sampler_map_.find(thread_id);
  if (it == sampler_map_.end()) return;
  SamplerList& samplers = it->second;
  // 遍历 sampler 对象,判断是否需要采集,每个 sampler 时间间隔不一样
  for (Sampler* sampler : samplers) {
    if (!sampler->ShouldRecordSample()) continue;
    Isolate* isolate = sampler->isolate();
    sampler->SampleStack(state);
  }
}
DoSample 找出需要采集的 sampler,然后执行其 SampleStack 函数。
void SampleStack(const v8::RegisterState& regs) override {
    Isolate* isolate = reinterpret_cast<Isolate*>(this->isolate());

    /*
        template<typename T, unsigned L>
        T* SamplingCircularQueue<T, L>::StartEnqueue() {
          base::SeqCst_MemoryFence();
          if (base::Acquire_Load(&enqueue_pos_->marker) == kEmpty) {
            return &enqueue_pos_->record;
          }
          return nullptr;
        }

        TickSample* SamplingEventsProcessor::StartTickSample() {
          void* address = ticks_buffer_.StartEnqueue();
          if (address == nullptr) return nullptr;
          TickSampleEventRecord* evt =
              new (address) TickSampleEventRecord(last_code_event_id_);
          return &evt->sample;
        }
    */
    TickSample* sample = processor_->StartTickSample();

    // the sample is created in the buffer.
    sample->Init(isolate, regs, TickSample::kIncludeCEntryFrame,
                 /* update_stats */ true,
                 /* use_simulator_reg_state */ true, processor_->period());

    processor_->FinishTickSample();
  }
SampleStack 首先从循环队列里找到一个空闲的项,然后记录采集的信息在里面,接着看 sample->Init。
void TickSample::Init(Isolate* v8_isolate,
const RegisterState& reg_state,
RecordCEntryFrame record_c_entry_frame,
bool update_stats,
bool use_simulator_reg_state,
base::TimeDelta sampling_interval) {
update_stats_ = update_stats;
SampleInfo info;
RegisterState regs = reg_state;
GetStackSample(v8_isolate, ®s, record_c_entry_frame, stack,
kMaxFramesCount, &info, &state,
use_simulator_reg_state)
if (state != StateTag::EXTERNAL) {
state = info.vm_state;
}
pc = regs.pc;
frames_count = static_cast<unsigned>(info.frames_count);
has_external_callback = info.external_callback_entry != nullptr;
context = info.context;
embedder_context = info.embedder_context;
embedder_state = info.embedder_state;
// ...
sampling_interval_ = sampling_interval;
timestamp = base::TimeTicks::Now();
}
sample->Init 通过 GetStackSample 采集信息。
bool TickSample::GetStackSample(Isolate* v8_isolate, RegisterState* regs,
                                RecordCEntryFrame record_c_entry_frame,
                                void** frames, size_t frames_limit,
                                v8::SampleInfo* sample_info,
                                StateTag* out_state,
                                bool use_simulator_reg_state) {
  i::Isolate* isolate = reinterpret_cast<i::Isolate*>(v8_isolate);
  sample_info->frames_count = 0;
  sample_info->vm_state = isolate->current_vm_state();
  sample_info->external_callback_entry = nullptr;
  sample_info->embedder_state = EmbedderStateTag::EMPTY;
  sample_info->embedder_context = nullptr;
  sample_info->context = nullptr;

  if (sample_info->vm_state == GC) return true;

  EmbedderState* embedder_state = isolate->current_embedder_state();
  if (embedder_state != nullptr) {
    sample_info->embedder_context =
        reinterpret_cast<void*>(embedder_state->native_context_address());
    sample_info->embedder_state = embedder_state->GetState();
  }

  Context top_context = isolate->context();
  if (top_context.ptr() != i::Context::kNoContext &&
      top_context.ptr() != i::Context::kInvalidContext) {
    NativeContext top_native_context = top_context.native_context();
    sample_info->context = reinterpret_cast<void*>(top_native_context.ptr());
  }

  i::Address js_entry_sp = isolate->js_entry_sp();
  if (js_entry_sp == 0) return true;  // Not executing JS now.

  // ...

  // 记录调用栈信息在 frames 中
  i::SafeStackFrameIterator it(isolate, reinterpret_cast<i::Address>(regs->pc),
                               reinterpret_cast<i::Address>(regs->fp),
                               reinterpret_cast<i::Address>(regs->sp),
                               reinterpret_cast<i::Address>(regs->lr),
                               js_entry_sp);

  if (it.done()) return true;

  size_t i = 0;
  if (record_c_entry_frame == kIncludeCEntryFrame &&
      (it.top_frame_type() == internal::StackFrame::EXIT ||
       it.top_frame_type() == internal::StackFrame::BUILTIN_EXIT)) {
    frames[i] = reinterpret_cast<void*>(isolate->c_function());
    i++;
  }

  for (; !it.done() && i < frames_limit; it.Advance()) {
    if (i == frames_limit) break;

    if (it.frame()->is_interpreted()) {
      // For interpreted frames use the bytecode array pointer as the pc.
      i::InterpretedFrame* frame =
          static_cast<i::InterpretedFrame*>(it.frame());
      // Since the sampler can interrupt execution at any point the
      // bytecode_array might be garbage, so don't actually dereference it. We
      // avoid the frame->GetXXX functions since they call BytecodeArray::cast,
      // which has a heap access in its DCHECK.
      i::Address bytecode_array = base::Memory<i::Address>(
          frame->fp() + i::InterpreterFrameConstants::kBytecodeArrayFromFp);
      i::Address bytecode_offset = base::Memory<i::Address>(
          frame->fp() + i::InterpreterFrameConstants::kBytecodeOffsetFromFp);

      // If the bytecode array is a heap object and the bytecode offset is a
      // Smi, use those, otherwise fall back to using the frame's pc.
      if (HAS_STRONG_HEAP_OBJECT_TAG(bytecode_array) &&
          HAS_SMI_TAG(bytecode_offset)) {
        frames[i++] = reinterpret_cast<void*>(
            bytecode_array + i::Internals::SmiValue(bytecode_offset));
        continue;
      }
    }
    // For arm64, the PC for the frame sometimes doesn't come from the stack,
    // but from the link register instead. For this reason, we skip
    // authenticating it.
    frames[i++] = reinterpret_cast<void*>(it.frame()->unauthenticated_pc());
  }
  sample_info->frames_count = i;
  return true;
}
至此采集的逻辑就分析完了,数据保存在 SamplingEventsProcessor 对象的 ticks_buffer_ 字段中。在 Profile 线程中会进行处理,前面提到的 ProcessOneSample 函数。
ProfilerEventsProcessor::SampleProcessingResult
SamplingEventsProcessor::ProcessOneSample() {
  TickSampleEventRecord record1;
  if (ticks_from_vm_buffer_.Peek(&record1) &&
      (record1.order == last_processed_code_event_id_)) {
    TickSampleEventRecord record;
    ticks_from_vm_buffer_.Dequeue(&record);
    SymbolizeAndAddToProfiles(&record);
    return OneSampleProcessed;
  }
  // 处理 ticks_buffer_ 的数据
  const TickSampleEventRecord* record = ticks_buffer_.Peek();
  if (record == nullptr) {
    if (ticks_from_vm_buffer_.IsEmpty()) return NoSamplesInQueue;
    return FoundSampleForNextCodeEvent;
  }
  if (record->order != last_processed_code_event_id_) {
    return FoundSampleForNextCodeEvent;
  }
  SymbolizeAndAddToProfiles(record);
  ticks_buffer_.Remove();
  return OneSampleProcessed;
}
我们只关注 SymbolizeAndAddToProfiles。
void SamplingEventsProcessor::SymbolizeAndAddToProfiles(
    const TickSampleEventRecord* record) {
  const TickSample& tick_sample = record->sample;
  // 进行数据处理,转成 JS 层的信息
  Symbolizer::SymbolizedSample symbolized =
      symbolizer_->SymbolizeTickSample(tick_sample);
  // 记录转换的结果
  profiles_->AddPathToCurrentProfiles(
      tick_sample.timestamp, symbolized.stack_trace, symbolized.src_line,
      tick_sample.update_stats_, tick_sample.sampling_interval_,
      tick_sample.state, tick_sample.embedder_state,
      reinterpret_cast<Address>(tick_sample.context),
      reinterpret_cast<Address>(tick_sample.embedder_context));
}
symbolizer_ 负责把底层的数据转成 JS 成的信息。
Symbolizer::SymbolizedSample Symbolizer::SymbolizeTickSample(
    const TickSample& sample) {
  ProfileStackTrace stack_trace;

  stack_trace.reserve(sample.frames_count + 3);

  const int no_line_info = v8::CpuProfileNode::kNoLineNumberInfo;
  int src_line = no_line_info;
  bool src_line_not_found = true;

  if (sample.pc != nullptr) {
    if (sample.has_external_callback && sample.state == EXTERNAL) {
      stack_trace.push_back(
          {FindEntry(reinterpret_cast<Address>(sample.external_callback_entry)),
           no_line_info});
    } else {
      Address attributed_pc = reinterpret_cast<Address>(sample.pc);
      Address pc_entry_instruction_start = kNullAddress;
      CodeEntry* pc_entry = FindEntry(attributed_pc, &pc_entry_instruction_start);

      if (!pc_entry && !sample.has_external_callback) {
        attributed_pc = reinterpret_cast<Address>(sample.tos);
        pc_entry = FindEntry(attributed_pc, &pc_entry_instruction_start);
      }

      if (pc_entry) {
        int pc_offset = static_cast<int>(attributed_pc - pc_entry_instruction_start);

        src_line = pc_entry->GetSourceLine(pc_offset);
        if (src_line == v8::CpuProfileNode::kNoLineNumberInfo) {
          src_line = pc_entry->line_number();
        }
        src_line_not_found = false;
        stack_trace.push_back({pc_entry, src_line});

        if (pc_entry->builtin() == Builtin::kFunctionPrototypeApply ||
            pc_entry->builtin() == Builtin::kFunctionPrototypeCall) {
          if (!sample.has_external_callback) {
            ProfilerStats::Instance()->AddReason(
                ProfilerStats::Reason::kInCallOrApply);
            stack_trace.push_back(
                {CodeEntry::unresolved_entry(), no_line_info});
          }
        }
      }
    }

    for (unsigned i = 0; i < sample.frames_count; ++i) {
      Address stack_pos = reinterpret_cast<Address>(sample.stack[i]);
      Address instruction_start = kNullAddress;
      CodeEntry* entry = FindEntry(stack_pos, &instruction_start);
      int line_number = no_line_info;
      if (entry) {
        int pc_offset = static_cast<int>(stack_pos - instruction_start);

        const std::vector<CodeEntryAndLineNumber>* inline_stack =
            entry->GetInlineStack(pc_offset);
        if (inline_stack) {
          int most_inlined_frame_line_number = entry->GetSourceLine(pc_offset);
          for (auto inline_stack_entry : *inline_stack) {
            stack_trace.push_back(inline_stack_entry);
          }

          size_t index = stack_trace.size() - inline_stack->size();
          stack_trace[index].line_number = most_inlined_frame_line_number;
        }

        if (src_line_not_found) {
          src_line = entry->GetSourceLine(pc_offset);
          if (src_line == v8::CpuProfileNode::kNoLineNumberInfo) {
            src_line = entry->line_number();
          }
          src_line_not_found = false;
        }
        line_number = entry->GetSourceLine(pc_offset);
        if (inline_stack) continue;
      }
      stack_trace.push_back({entry, line_number});
    }
  }

  return SymbolizedSample{stack_trace, src_line};
}
SymbolizeTickSample 的逻辑非常复杂,不过我们大概能看得出来它的作用。转换完之后需要通知所有的 profile 对象。
void CpuProfilesCollection::AddPathToCurrentProfiles(...) {

  current_profiles_semaphore_.Wait();
  const ProfileStackTrace empty_path;
  // 遍历 profile 对象
  for (const std::unique_ptr<CpuProfile>& profile : current_profiles_) {
    // ...
    profile->AddPath(timestamp, accepts_context ? path : empty_path, src_line,
                     update_stats, sampling_interval, state,
                     accepts_embedder_context ? embedder_state_tag
                                              : EmbedderStateTag::EMPTY);
  }
  current_profiles_semaphore_.Signal();
}
接着看 profile->AddPath。
void CpuProfile::AddPath(base::TimeTicks timestamp,
                         const ProfileStackTrace& path, int src_line,
                         bool update_stats, base::TimeDelta sampling_interval,
                         StateTag state_tag,
                         EmbedderStateTag embedder_state_tag) {

  ProfileNode* top_frame_node =
      top_down_.AddPathFromEnd(path, src_line, update_stats, options_.mode());

  bool should_record_sample =
      !timestamp.IsNull() && timestamp >= start_time_ &&
      (options_.max_samples() == CpuProfilingOptions::kNoSampleLimit ||
       samples_.size() < options_.max_samples());

  if (should_record_sample) {
    samples_.push_back(
        {top_frame_node, timestamp, src_line, state_tag, embedder_state_tag});
  }
}
Profile 数据就被记录到 samples_ 字段了。最后通过 Stop 停止采集时,就会返回这个 Profile 对象,从而拿到 Profile 的数据。


 4201
4201


 被折叠的 条评论
为什么被折叠?
被折叠的 条评论
为什么被折叠?
 到【灌水乐园】发言


