


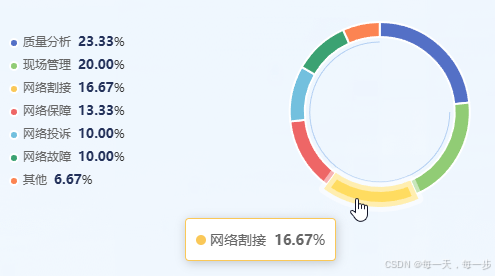
效果如上图所示,代码如下:
export async function drawPieFun(params) {
const { chartId, data } = params;
if (!document.getElementById(chartId)) {
return false;
}
echarts.init(document.getElementById(chartId)).dispose(); // 销毁实例
let option = {
tooltip: {
trigger: 'item',
formatter: (params) => params.marker + params.name + ` ` + `<span style="font-weight:bold;">${params.value}</span>` + '%',
},
legend: {
orient: 'vertical',
top: 'center',
left: '0%',
icon: 'circle', // 图例形状为圆形
itemWidth: 8,
itemHeight: 8,
formatter: function (name) {
let value = data.find(item => item.name === name).value;
return `{name|${name}} {value|${value}}%`; // 使用rich定义的样式标签
},
textStyle: {
rich: {
name: {
color: '#666',
fontSize: 12,
},
value: {
color: '#223059',
fontSize: 13,
fontWeight: 'bold',
}
}
}
},
series: [
{
type: 'pie',
center: ['75%', '50%'],
radius: ['50%', '60%'],
avoidLabelOverlap: false,
itemStyle: {
borderColor: '#fff',
borderWidth: 2
},
label: {
show: false,
position: 'center'
},
emphasis: {
itemStyle: {
borderColor: 'rgba(255, 255, 255,0.5)', // 边框颜色
borderWidth: 10 // 边框宽度
}
},
labelLine: {
show: false
},
data
},
{
// 内层圆环
name: '',
type: 'gauge',
splitNumber: 180, // 刻度数量
radius: '47%', // 图表尺寸
center: ['75%', '50%'],
startAngle: 0,
endAngle: -270,
axisLine: {
show: true,
lineStyle: {
width: 1,
shadowBlur: 0,
color: [[1, '#005BD240']]
}
},
axisTick: {
show: false
},
splitLine: {
show: false
},
axisLabel: {
show: false
}
},
]
};
let myChart = echarts.init(document.getElementById(chartId));
myChart.setOption(option, true);
document.getElementById(chartId).removeEventListener;
window.addEventListener("resize", () => { myChart.resize(); });
}
方法调用:
drawPieFun({
  chartId: 'pie_chart',
  data: []
});


 被折叠的 条评论
为什么被折叠?
被折叠的 条评论
为什么被折叠?
 到【灌水乐园】发言


