


最近准备在OC项目中使用charts,怕以后忘记、记录一下使用步骤。charts是一个功能强大的图表组件,使用的是swift语言编写,所以就涉及到混编的一些操作配置。
charts下载地址:https://github.com/danielgindi/Charts
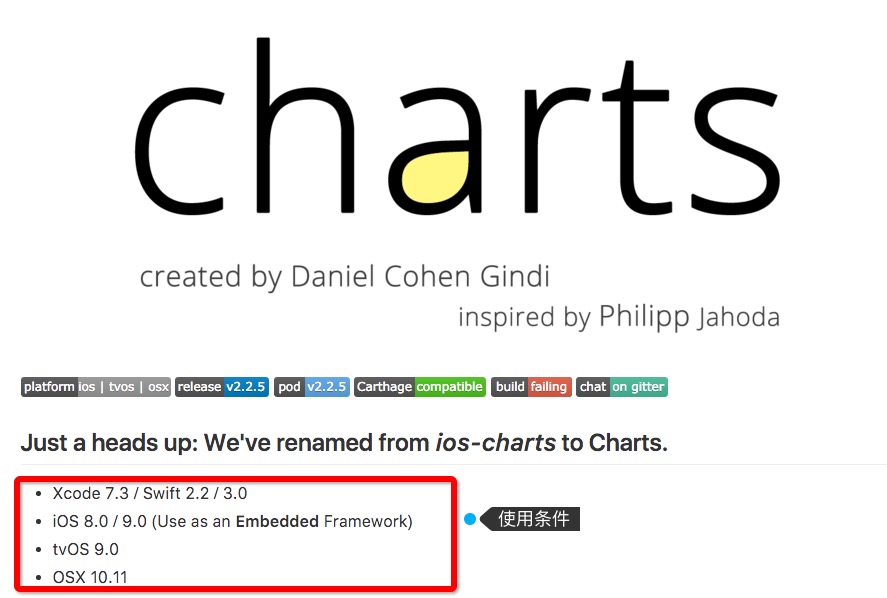
使用条件:
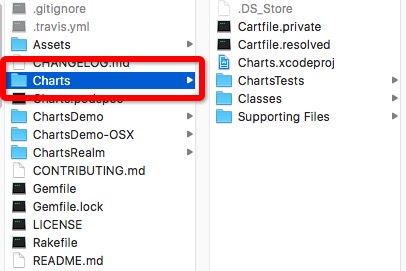
下载完成解压后主要使用charts文件夹:
配置步骤:
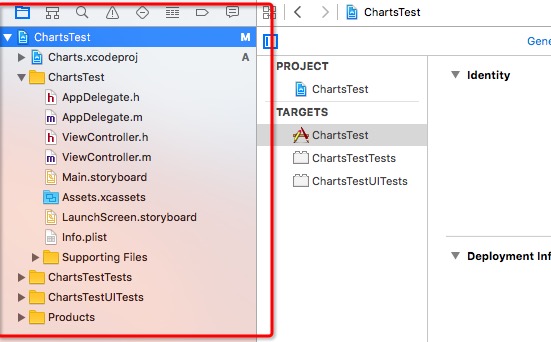
1、首先新建一个项目(我这里把工程命名为ChartsTest),把之前下载好的Charts文件夹拖到工程主目录下。
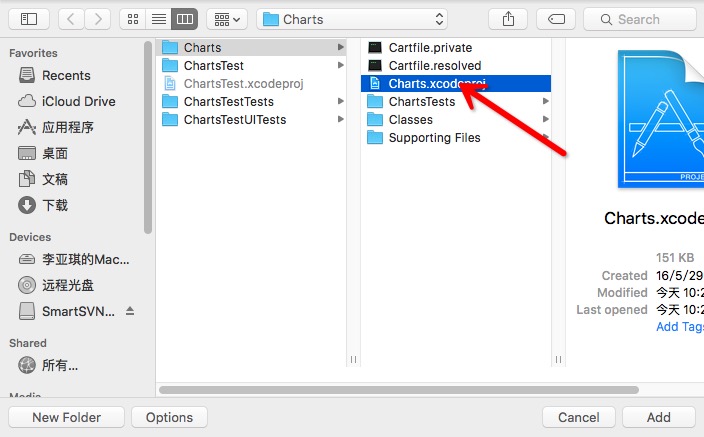
2、右击项目,选择-》Add Files to”xx”,在弹出的选择文件框中选择”Charts.xcodeproj”(注意:不要选择文件夹)。
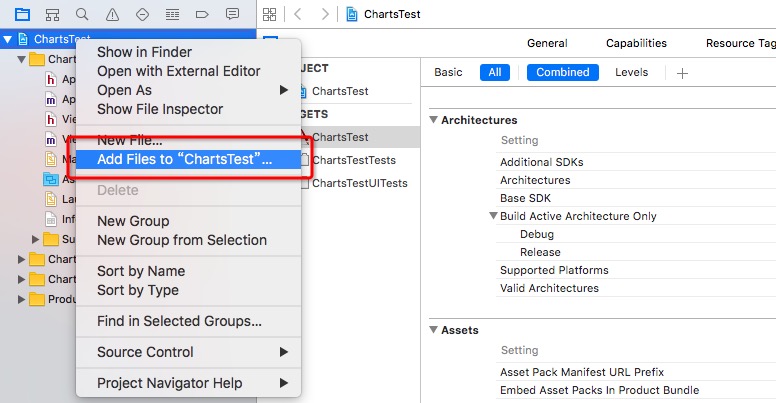
现在项目变成了这个样子
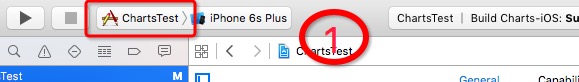
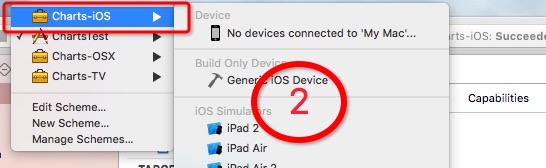
3、编译Charts-ios。
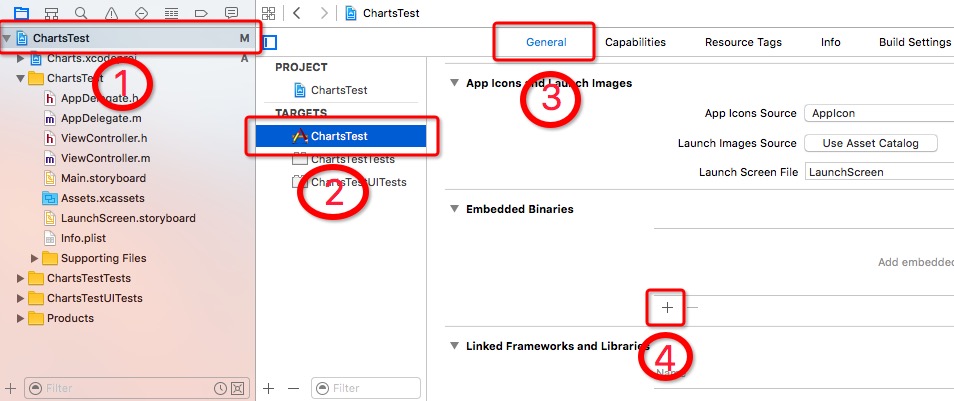
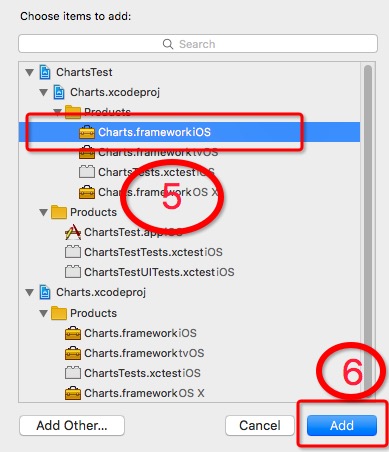
4、添加Charts.framework到项目中。
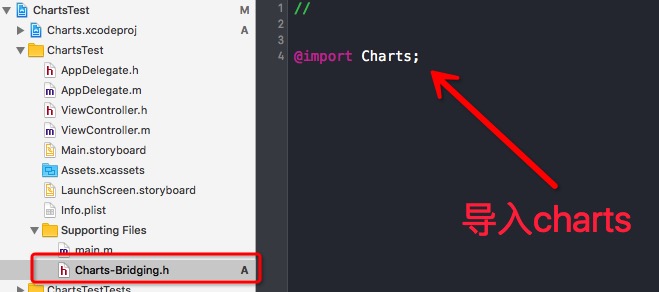
5、创建用于oc和swift混编的桥接文件(*.h文件)(我这里命名为:Charts-Bridging.h),并在桥接文件里面导入Charts。
当然建立这个桥接文件也有一个便利的方法,就是直接在项目中新建一个(*.swift)的文件,系统会弹出提示询问你是否要新建桥接文件,选择创建就行了。这里我就不做截图了有兴趣的自己去试一下。
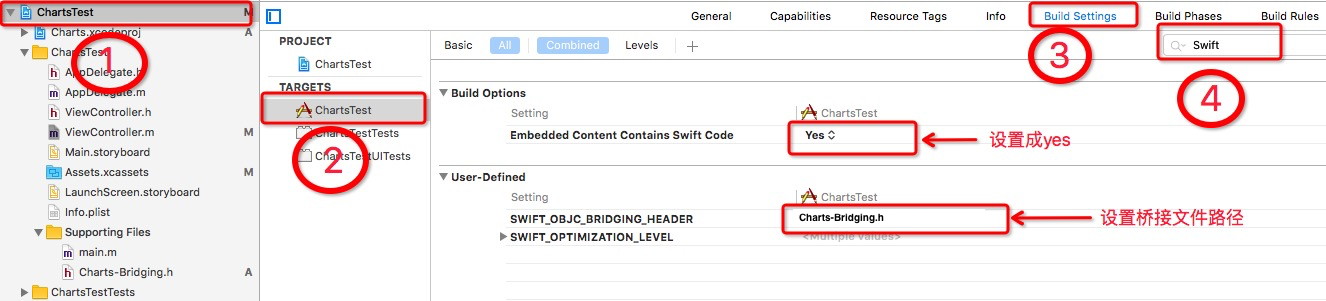
6、桥接文件和开启混编配置。
到此为止我们的配置就完成了,接下来我说一下在项目使用图表控件。
使用步骤:
1、在ViewController中导入下面两个文件。
#import "Charts-Bridging.h"
#import "ChartsTest-Swift.h"
2、在ViewController中添加如下代码。
@interface ViewController ()<ChartViewDelegate>
@property(nonatomic,strong)LineChartView *chartView;
@property(nonatomic,retain)LineChartData *lineChartData;
@end
@implementation ViewController
- (void)viewDidLoad {
[super viewDidLoad];
// Do any additional setup after loading the view, typically from a nib.
_chartView = [[LineChartView alloc]init];
[self.view addSubview:_chartView];
_chartView.frame = CGRectMake(0, 40, self.view.frame.size.width, self.view.frame.size.height - 80);
_chartView.descriptionText = @"xxx描述";
_chartView.noDataText = @"没有数据";
_chartView.noDataTextDescription = @"没有更多的数据详细描述";
_chartView.dragEnabled = YES;//设置图表里能不能被拖动
[_chartView setScaleEnabled:YES];//设置图表能不能被放大
_chartView.pinchZoomEnabled = NO;
_chartView.drawGridBackgroundEnabled = YES;
_chartView.delegate = self;
_chartView.xAxis.labelPosition = XAxisLabelPositionBottom;//设置x轴在下面显示,默认是在上面
_chartView.data = self.lineChartData;//设置数据
}
-(LineChartData *)lineChartData{
NSMutableArray *xVals = [[NSMutableArray alloc]initWithCapacity:12];
for (int i = 0; i < 12; i++)
{
[xVals addObject:[NSString stringWithFormat:@"%d月",i+1]];
}
NSMutableArray *yVals = [[NSMutableArray alloc] init];
for (int i = 0; i < 12; i++)
{
double mult = (12 + 1);
double val = (double) (arc4random_uniform(mult)) + 3;
[yVals addObject:[[ChartDataEntry alloc] initWithValue:val xIndex:i]];
}
NSMutableArray *yVals2 = [[NSMutableArray alloc] init];
for (int i = 0; i < 12; i++)
{
double mult = (12 + 1);
double val = (double) (arc4random_uniform(mult)) + 13;
[yVals2 addObject:[[ChartDataEntry alloc] initWithValue:val xIndex:i]];
}
LineChartDataSet *set1 = nil;
LineChartDataSet *set2 = nil;
if (_chartView.data.dataSetCount > 0)
{
set1 = (LineChartDataSet *)_chartView.data.dataSets[0];
set1.yVals = yVals;
_chartView.data.xValsObjc = xVals;
[_chartView notifyDataSetChanged];
}
else
{
set1 = [[LineChartDataSet alloc] initWithYVals:yVals label:@"lineChartData 1"];
//set1.lineDashLengths = @[@5.f, @2.5f];
//set1.highlightLineDashLengths = @[@5.f, @2.5f];
[set1 setColor:UIColor.blackColor];
[set1 setCircleColor:UIColor.blackColor];
set1.lineWidth = 1.0;
set1.circleRadius = 3.0;
set1.drawCircleHoleEnabled = NO;
set1.valueFont = [UIFont systemFontOfSize:9.f];
//set1.fillAlpha = 65/255.0;
//set1.fillColor = UIColor.blackColor;
NSArray *gradientColors = @[
(id)[ChartColorTemplates colorFromString:@"#00ff0000"].CGColor,
(id)[ChartColorTemplates colorFromString:@"#ffff0000"].CGColor
];
CGGradientRef gradient = CGGradientCreateWithColors(nil, (CFArrayRef)gradientColors, nil);
set1.fillAlpha = 1.f;
set1.fill = [ChartFill fillWithLinearGradient:gradient angle:90.f];
set1.drawFilledEnabled = YES;
CGGradientRelease(gradient);
set2 = [[LineChartDataSet alloc] initWithYVals:yVals2 label:@"lineChartData 2"];
// set2.lineDashLengths = @[@5.f, @2.5f];
// set2.highlightLineDashLengths = @[@5.f, @2.5f];
[set2 setColor:UIColor.yellowColor];//设置set2线条的颜色
[set2 setCircleColor:UIColor.purpleColor];//设置set2的小圆圈的颜色
set2.lineWidth = 1.0;
set2.circleRadius = 3.0;
set2.drawCircleHoleEnabled = NO;
set2.valueFont = [UIFont systemFontOfSize:9.f];
_lineChartData = [[LineChartData alloc] initWithXVals:xVals dataSets:@[set1,set2]];
}
return _lineChartData;
}
- (void)didReceiveMemoryWarning {
[super didReceiveMemoryWarning];
// Dispose of any resources that can be recreated.
}
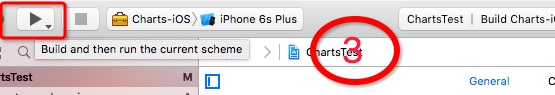
@end3、编译运行
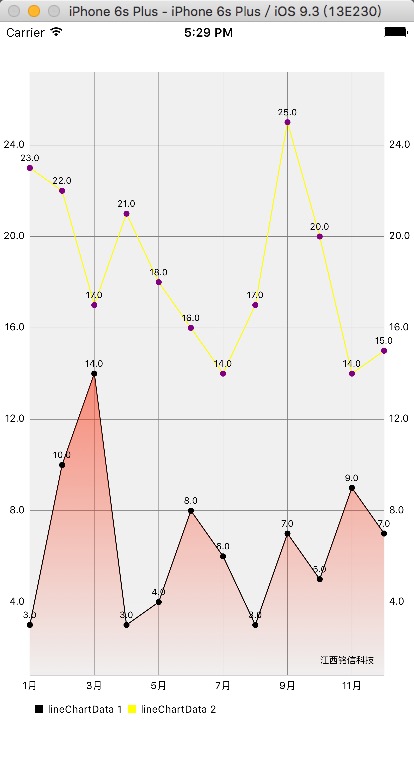
出现上面图的这个结果说明你已经成功了。
如果有使用api方面的问题可以参考 MPAndroidChart。


 389
389

 被折叠的 条评论
为什么被折叠?
被折叠的 条评论
为什么被折叠?
 到【灌水乐园】发言


