


需要画黑白图,但是又有几条线在一张图上,就需要有区分度。点的效果又不太好,糊成一片。可以用dash line,查了一些链接,最终也没成功。为什么呢。写的很清楚:
In gnuplot version 5 the dash pattern (dashtype) is a seperate property associated with each line, analogous to linecolor or linewidth.
那就升级版本吧。
$ tar xzf gnuplot-5.0.1.tar.gz
$ cd gnuplot-5.0.1
$ ./configure
$ make
$ sudo make install
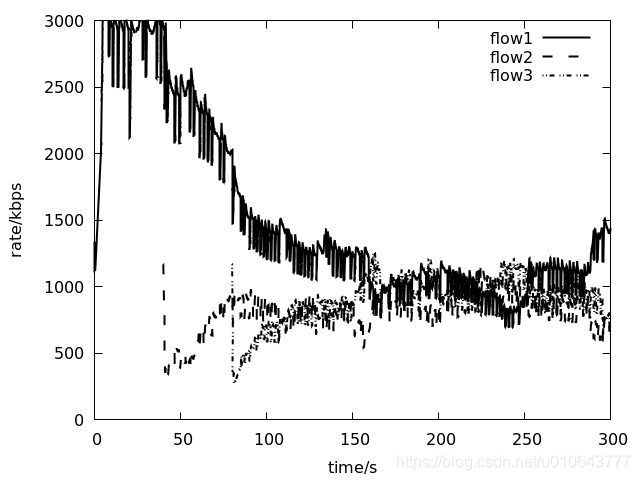
画图脚本,black_plot.sh
#! /bin/sh
instance=1
file1=1_bw.txt
file2=2_bw.txt
file3=3_bw.txt
output=bw_pic
gnuplot<<!
set xlabel "time/s"
set ylabel "rate/kbps"
set xrange [0:300]
set yrange [0:3000]
set terminal png monochrome dashed
set output "${output}_bw.png"
plot "${file1}" u 1:2 title "flow1"  with lines  lw 2,\
"${file2}" u 1:2 title "flow2" with lines  lw 2,\
"${file3}" u 1:2 title "flow3" with lines dashtype '..-' lw 2
set output
exit
!
效果:
[1] https://stackoverflow.com/questions/29526044/installing-gnuplot-5-0-on-ubuntu
[2] gnuplot dash lines http://gnuplot.sourceforge.net/demo/dashtypes.html


 被折叠的 条评论
为什么被折叠?
被折叠的 条评论
为什么被折叠?
 到【灌水乐园】发言


