


一、问题描述
生产环境cpu过高问题,排查虽然不易,但是是有一定的套路,可以加快问题定位从而排查的。
二、步骤
1.查看cpu占用高的进程
top2. ps -ef或者jps进一步定位,得知是一个怎么样的一个后台程序
3.查看对应进程下,每个线程的运行情况
ps -mp pid -o THREAD,tid,time
例如
ps -mp 29556 -o THREAD,tid,time
ps -mp 11823 -o THREAD,tid,time
4.将占用资源夺得线程threadpid:进制转换,2HEX
printf "%x\n" threadpid5.查看对应线程存在的问题
jstack 进程ID | grep tid(16进制线程ID小写英文) -A60
三、编写cpu高消耗代码并且部署服务器
1.java代码
package com.ray.cpu;

public class cpuOccupy {


    public void cpuCircle() {

        int num = 0;
        long start = System.currentTimeMillis() / 1000;
        while (true) {
            num = num + 1;

            if (num == Integer.MAX_VALUE) {
                System.out.println("reset");
                num = 0;
            }

            if ((System.currentTimeMillis() / 1000) - start > 1000) {
                return;
            }
        }
    }


    public static void main(String[] args) {
        new cpuOccupy().cpuCircle();
    }
}
2.配置maven相关配置:打jar包并且指定运行主类
<?xml version="1.0" encoding="UTF-8"?>
<project xmlns="http://maven.apache.org/POM/4.0.0"
xmlns:xsi="http://www.w3.org/2001/XMLSchema-instance"
xsi:schemaLocation="http://maven.apache.org/POM/4.0.0 http://maven.apache.org/xsd/maven-4.0.0.xsd">
<modelVersion>4.0.0</modelVersion>
<groupId>com.ray.cpu</groupId>
<artifactId>occupied</artifactId>
<version>1.0-SNAPSHOT</version>
<dependencies>
</dependencies>
<build>
<!--<pluginManagement><!– lock down plugins versions to avoid using Maven defaults (may be moved to parent pom) –>-->
<plugins>
<plugin>
<!--<groupId>org.apache.maven.plugins</groupId>-->
<artifactId>maven-compiler-plugin</artifactId>
<version>2.3.2</version>
<configuration>
<source>1.8</source>
<target>1.8</target>
</configuration>
</plugin>
<plugin>
<artifactId>maven-assembly-plugin </artifactId>
<configuration>
<descriptorRefs>
<descriptorRef>jar-with-dependencies</descriptorRef>
</descriptorRefs>
<archive>
<manifest>
<mainClass>com.ray.cpu.cpuOccupy</mainClass>
</manifest>
</archive>
</configuration>
<executions>
<execution>
<id>make-assembly</id>
<phase>package</phase>
<goals>
<goal>single</goal>
</goals>
</execution>
</executions>
</plugin>
</plugins>
<!--</pluginManagement>-->
</build>
</project>
关键点:打包jar包插件,以及指定主类
3.打包

4.上传linux服务器并且运行

# java -jar occupied-1.0-SNAPSHOT-jar-with-dependencies.jar
四、排查问题
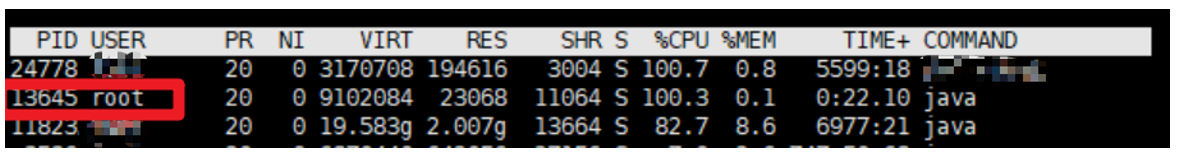
1. top查看占用cpu资源较多的程序PID:13645
2. 查看对应进程下,每个线程的运行情况
[root@cloudera ~]# ps -mp 13645 -o THREAD,tid,time
USER     %CPU PRI SCNT WCHAN  USER SYSTEM   TID     TIME
root     98.7   -    - -         -      -     - 00:00:36
root      0.0  19    - futex_    -      - 13645 00:00:00
root     98.6  19    - -         -      - 13648 00:00:36
root      0.0  19    - futex_    -      - 13650 00:00:00
root      0.0  19    - futex_    -      - 13651 00:00:00
root      0.0  19    - futex_    -      - 13653 00:00:00
root      0.0  19    - futex_    -      - 13655 00:00:00
root      0.0  19    - futex_    -      - 13658 00:00:00
root      0.0  19    - futex_    -      - 13664 00:00:00
root      0.0  19    - futex_    -      - 13665 00:00:00
root      0.0  19    - futex_    -      - 13666 00:00:00
root      0.0  19    - futex_    -      - 13669 00:00:00
root      0.0  19    - futex_    -      - 13670 00:00:00
root      0.0  19    - futex_    -      - 13673 00:00:00
root      0.0  19    - futex_    -      - 13674 00:00:00
root      0.0  19    - futex_    -      - 13678 00:00:00
root      0.0  19    - futex_    -      - 13679 00:00:00
root      0.0  19    - futex_    -      - 13680 00:00:00
root      0.0  19    - futex_    -      - 13685 00:00:00
root      0.0  19    - futex_    -      - 13687 00:00:00
root      0.0  19    - futex_    -      - 13688 00:00:00
3. 将占用资源夺得线程threadpid:进制转换16进制,2HEX
[root@cloudera ~]# printf "%x\n" 13648
3550
4.定位线程问题
jstack 13645 | grep 3550 -A60
5.定位java程序位置(非常详细)

五、参考
1. Java CPU 占用高模拟及排查
https://blog.csdn.net/jiankunking/article/details/79749836
2.排查Java的CPU性能问题
https://blog.csdn.net/jiankunking/article/details/80297136


 866
866


 被折叠的 条评论
为什么被折叠?
被折叠的 条评论
为什么被折叠?
 到【灌水乐园】发言


