


标签
PostgreSQL , 离散扫描 , IoT , append only , 类聚簇 , index include
背景
https://use-the-index-luke.com/blog/2019-04/include-columns-in-btree-indexes
当一次SQL请求需要返回较多行,或者需要扫描较多行(即使使用索引)时,如果这些行在HEAP表中并非密集存储,而是非常离散的存储,那么扫描的记录数越多,访问的BLOCK就越多,性能会比较差。
优化思路:
1、cluster ,密集存储
让数据按索引的顺序密集存储,减少回表时IO放大
2、聚簇表
表的顺序与索引顺序一致,类似的还有index only scan(索引中包含所有需要搜索的字段,不回表)
3、预聚合
预先将需要访问的多条数据聚合成一条,例如轨迹数据,按目标对象聚合(例如单车ID),原始数据为点记录(多表),聚合成轨迹(单条)
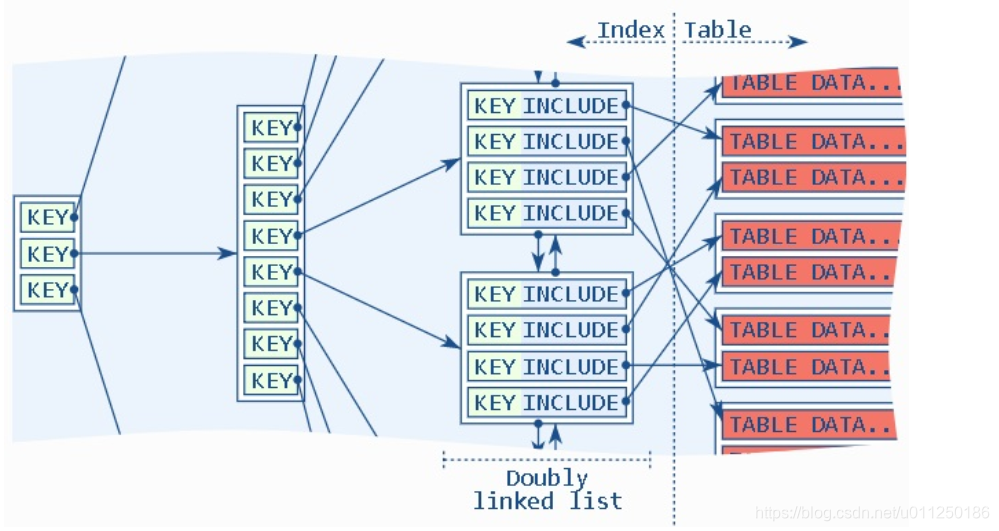
4、index include
在索引中,放入额外属性内容,搜索时不需要回表,例如
create index idx_t1_1 on t1 (id) include(c1,c2,c3,info,crt_time);

create index idx_t2_1 on t2 (id,c1,c2,c3,info,crt_time);
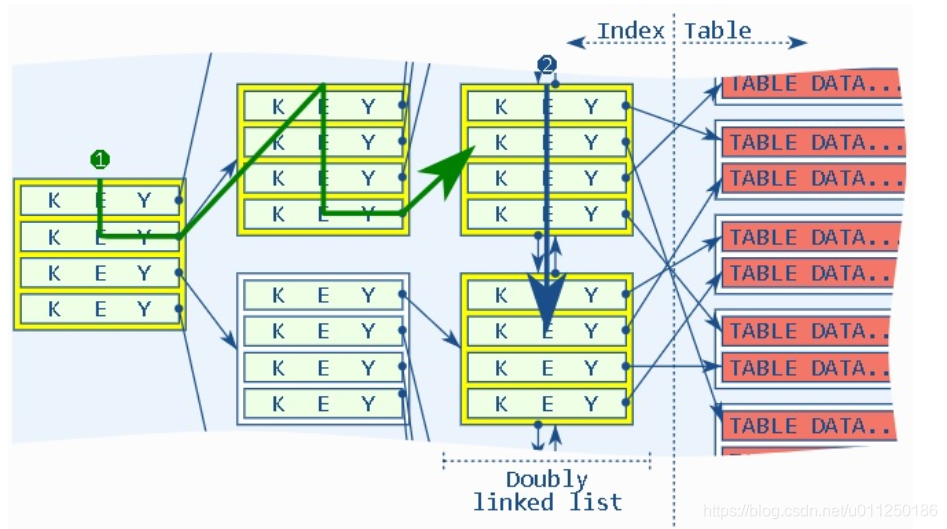
以上两个索引的差异在哪里?
索引1,KEY是ID,在叶子节点中,存入KEY与(c1,c2,c3,info,crt_time)的内容。
索引2,KEY是(id,c1,c2,c3,info,crt_time),在所有节点中,存储的都是所有字段的值,比索引1要重,包括空间,索引维护,更新等。
应用举例:
《PostgreSQL IoT,车联网 - 实时轨迹、行程实践 2 - (含index only scan类聚簇表效果)》
《PostgreSQL IoT,车联网 - 实时轨迹、行程实践 1》
index include例子
对比三种情况(index , index only (full index) , index only (include) )的性能。
写入1000万数据,1000个KEY值,平均每个KEY值对应10000条数据,并且这1万行离散存储。
例如共享单车的轨迹,每个轨迹都是独立的点组成,同时有很多的单车在活动,所以存储到数据库时,每个单车的同一个轨迹的所有点实际上是离散存储在HEAP BLOCK中的。与本文涉及的内容相似。
1、include
create table t1 (id int, c1 int, c2 int, c3 int, info text, crt_time timestamp);

create index idx_t1_1 on t1 (id) include(c1,c2,c3,info,crt_time);

postgres=# insert into t1 select (1000*random())::int,1,1,1,'test',now() from generate_series(1,10000000);
INSERT 0 10000000
Time: 40343.081 ms (00:40.343)
2、full index
create table t2(like t1);
create index idx_t2_1 on t2 (id,c1,c2,c3,info,crt_time);

postgres=# insert into t2 select * from t1;
INSERT 0 10000000
Time: 52042.389 ms (00:52.042)
3、index
create table t3(like t1);
create index idx_t3_1 on t3(id);
postgres=# insert into t3 select * from t1;
INSERT 0 10000000
Time: 32631.633 ms (00:32.632)
vacuum analyze t1;
vacuum analyze t2;
vacuum analyze t3;
4、查询效率
postgres=# explain (analyze,verbose,timing,costs,buffers) select id,c1,c2,c3,info,crt_time from t1 where id=1;
                                                            QUERY PLAN
-----------------------------------------------------------------------------------------------------------------------------------
 Index Only Scan using idx_t1_1 on public.t1  (cost=0.43..236.40 rows=9901 width=29) (actual time=0.011..1.292 rows=10040 loops=1)
   Output: id, c1, c2, c3, info, crt_time
   Index Cond: (t1.id = 1)
   Heap Fetches: 0
   Buffers: shared hit=62
 Planning Time: 0.030 ms
 Execution Time: 1.833 ms
(7 rows)
postgres=# explain (analyze,verbose,timing,costs,buffers) select id,c1,c2,c3,info,crt_time from t2 where id=1;
                                                            QUERY PLAN
-----------------------------------------------------------------------------------------------------------------------------------
 Index Only Scan using idx_t2_1 on public.t2  (cost=0.56..238.42 rows=9946 width=29) (actual time=0.031..1.504 rows=10040 loops=1)
   Output: id, c1, c2, c3, info, crt_time
   Index Cond: (t2.id = 1)
   Heap Fetches: 0
   Buffers: shared hit=63
 Planning Time: 0.078 ms
 Execution Time: 2.077 ms
(7 rows)
postgres=# explain (analyze,verbose,timing,costs,buffers) select id,c1,c2,c3,info,crt_time from t3 where id=1;
                                                        QUERY PLAN
--------------------------------------------------------------------------------------------------------------------------
 Bitmap Heap Scan on public.t3  (cost=107.26..10153.94 rows=9952 width=29) (actual time=3.061..17.160 rows=10040 loops=1)
   Output: id, c1, c2, c3, info, crt_time
   Recheck Cond: (t3.id = 1)
   Heap Blocks: exact=9392
   Buffers: shared hit=9420
   ->  Bitmap Index Scan on idx_t3_1  (cost=0.00..104.78 rows=9952 width=0) (actual time=1.618..1.618 rows=10040 loops=1)
         Index Cond: (t3.id = 1)
         Buffers: shared hit=28
 Planning Time: 0.085 ms
 Execution Time: 17.768 ms
(10 rows)

Time: 18.204 ms

postgres=# set enable_bitmapscan=off;

postgres=# explain (analyze,verbose,timing,costs,buffers) select id,c1,c2,c3,info,crt_time from t3 where id=1;
                                                           QUERY PLAN
---------------------------------------------------------------------------------------------------------------------------------
 Index Scan using idx_t3_1 on public.t3  (cost=0.43..10457.29 rows=9952 width=29) (actual time=0.028..12.610 rows=10040 loops=1)
   Output: id, c1, c2, c3, info, crt_time
   Index Cond: (t3.id = 1)
   Buffers: shared hit=9420
 Planning Time: 0.087 ms
 Execution Time: 13.204 ms
(6 rows)
Time: 13.511 ms
5、高并发查询性能对比
vi test1.sql
\set id random(1,1000)
select id,c1,c2,c3,info,crt_time from t1 where id=:id;

vi test2.sql
\set id random(1,1000)
select id,c1,c2,c3,info,crt_time from t2 where id=:id;

vi test3.sql
\set id random(1,1000)
select id,c1,c2,c3,info,crt_time from t3 where id=:id;


alter role all set enable_bitmapscan =off;
5.1、index only scan(index include)
%Cpu(s): 32.7 us, 30.0 sy,  0.0 ni, 37.3 id

transaction type: ./test.sql
scaling factor: 1
query mode: prepared
number of clients: 56
number of threads: 56
duration: 120 s
number of transactions actually processed: 263335
latency average = 25.519 ms
latency stddev = 7.470 ms
tps = 2193.947905 (including connections establishing)
tps = 2194.053590 (excluding connections establishing)
statement latencies in milliseconds:
         0.001  \set id random(1,1000)
        25.518  select id,c1,c2,c3,info,crt_time from t1 where id=:id;
5.2、index only scan(full index)
%Cpu(s): 32.6 us, 30.1 sy,  0.0 ni, 37.3 id

transaction type: ./test.sql
scaling factor: 1
query mode: prepared
number of clients: 56
number of threads: 56
duration: 120 s
number of transactions actually processed: 262858
latency average = 25.565 ms
latency stddev = 7.574 ms
tps = 2189.965138 (including connections establishing)
tps = 2190.073948 (excluding connections establishing)
statement latencies in milliseconds:
         0.001  \set id random(1,1000)
        25.564  select id,c1,c2,c3,info,crt_time from t2 where id=:id;
5.3、index scan(key only)
%Cpu(s): 59.4 us, 12.6 sy,  0.0 ni, 28.0 id

scaling factor: 1
query mode: prepared
number of clients: 56
number of threads: 56
duration: 120 s
number of transactions actually processed: 198793
latency average = 33.804 ms
latency stddev = 9.839 ms
tps = 1656.139982 (including connections establishing)
tps = 1656.227526 (excluding connections establishing)
statement latencies in milliseconds:
         0.001  \set id random(1,1000)
        33.803  select id,c1,c2,c3,info,crt_time from t3 where id=:id;
小结
index include 应用场景
当一次SQL请求需要返回较多行,或者需要扫描较多行(即使使用索引)时,如果这些行在HEAP表中并非密集存储,而是非常离散的存储,那么扫描的记录数越多,访问的BLOCK就越多,性能会比较差。
index include技术,将key值以外的数据存储在index leaf page中,不需要回表就可以查询到这些数据,提高整体性能(同时又不需要将所有属性都放在KEY中,使得索引臃肿)。
例如共享单车的轨迹,每个轨迹都是独立的点组成,同时有很多的单车在活动,所以存储到数据库时,每个单车的同一个轨迹的所有点实际上是离散存储在HEAP BLOCK中的。与本文涉及的内容相似。
性能对比:
| 索引 | 写入1000万耗时 | KEY值搜索qps | CPU |
|---|---|---|---|
| index(key + include) | 40.3 | 2193 | 62.7% |
| index(full index) | 52 | 2189 | 62.7% |
| index(key only) | 32.6 | 1656 | 72% |
参考
《PostgreSQL 12 preview - GiST 索引支持INCLUDE columns - 覆盖索引 - 类聚簇索引》
《PostgreSQL 10.0 preview 功能增强 - 唯一约束+附加字段组合功能索引 - 覆盖索引 - covering index》
《PostgreSQL IoT,车联网 - 实时轨迹、行程实践 2 - (含index only scan类聚簇表效果)》
《PostgreSQL IoT,车联网 - 实时轨迹、行程实践 1》
https://use-the-index-luke.com/blog/2019-04/include-columns-in-btree-indexes


 398
398


 被折叠的 条评论
为什么被折叠?
被折叠的 条评论
为什么被折叠?
 到【灌水乐园】发言


