


- 下载phpstorm2018 ,wampserver3 ,百度下载
- 安装phpstorm2018 ,wampserver3
- 下载chrom 插件,xdebug helper ,百度下载
1.xdebug helper 在谷歌浏览器安装插件
将下载的文件![]() ,修改后缀名为rar,然后解压。
,修改后缀名为rar,然后解压。
打开谷歌浏览器的菜单,扩展程序,安装插件

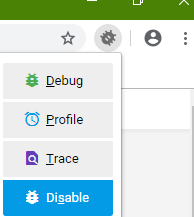
安装成功后的截图

2.打开phpStrom新建工作空间

2.配置php环境
新建部署配置图示

新建php cli interpreter 配置 ,xdebug 配置 ,此处配置,php文件可以以脚本的方式debug,无需通过web server


配置xdebug 端口 ,9000,默认为9000

配置dbgp,代理,端口为80

配置server

为apache server 的php.ini 增加 xdebug配置


; XDEBUG Extension
[xdebug]
zend_extension ="E:/Windows10/wamp64/bin/php/php5.6.25/zend_ext/php_xdebug-2.4.1-5.6-vc11-x86_64.dll"
xdebug.remote_enable=On
xdebug.idekey="PhpStorm"
xdebug.remote_host="localhost"
xdebug.remote_port=9000
xdebug.remote_handler="dbgp"
xdebug.profiler_enable = On
xdebug.profiler_enable_trigger = On
xdebug.profiler_output_name = cachegrind.out.%t.%p
xdebug.profiler_output_dir ="E:/Windows10/wamp64/tmp"
xdebug.show_local_vars=0
保存完毕,启动wampserver 即可。
新建运行配置


新建一个index.php文件测试

<?php
/**
 * Created by PhpStorm.
 * User: Administrator
 * Date: 2019/4/26
 * Time: 17:54
 */
phpinfo();
echo "Hello Wolrd";
echo "Hello Wolrd";
echo "Hello Wolrd";
?>
添加脚本执行配置,index.php


点击绿色小三角,执行

设置断点debug

按F8一步一步的执行完毕。

以上为控制台执行php。
接下来,使用web执行远程debug
添加php web page 配置


访问路径为:http://127.0.0.1/test ,此时访问报错。
<Directory "${INSTALL_DIR}/www/"></Directory>
apache server 的httpd.conf配置文件,指定webapp目录为:E:\Windows10\wamp64\www

把test项目拷贝到这个www目录下。用ide再次打开。


单击绿色小三角,执行,弹出一个页面

 以debug执行这个test项目。

此时浏览器暂停了,按F8执行。


debug执行完后,打印字符。


 267
267


 被折叠的 条评论
为什么被折叠?
被折叠的 条评论
为什么被折叠?
 到【灌水乐园】发言


