


目录
1. 安装Prometheus
Prometheus支持以下平台进行安装:
- Linux: 32位、64位和ARM。
- Max OS X: 32位和64位。
- FreeBSD: 32位、64位和ARM。
- OpenBSD: 32位、64位和ARM。
- NetBSD:32位、64位和ARM。
- Windows: 32位、64位。
- DragonFly: 64位。
在 Prometheus下载官网地址 可以下载以上所有版本。当前Linux上的最新版本是2.45.0 。
有以下安装方式:
| 单独安装 |
|
| 通过监控套件安装 |
|
| 通过配置管理工具安装 | 可用于安装Prometheus的配置管理资源,有以下各种配置管理工具的示例:
|
| 通过K8S安装 | 通过K8S安装Prometheus |
这里会介绍如何在linux上安装Prometheus。
2. 基于linux安装Prometheus
下载安装包
wget https://github.com/prometheus/prometheus/releases/download/v2.45.0/prometheus-2.45.0.linux-amd64.tar.gz将安装包放在合适的目录下
一般将安装包解压到/usr/local目录下。
tar -xzf prometheus-2.45.0.linux-amd64.tar.gz
sudo mv prometheus-2.45.0.linux-amd64 /usr/local/prometheus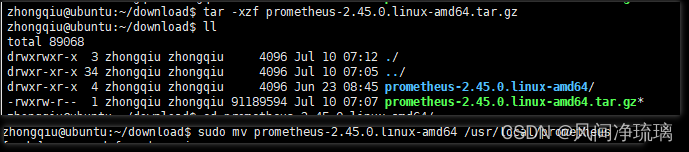
启动prometheus
可以将prometheus.yml拷贝到对应的目录下,通过参数 --config.file指定配置文件进行启动。
/usr/local/prometheus/prometheus --config.file="/usr/local/prometheus/prometheus.yml" &
访问
笔者这里没有开放9090端口供外部访问,因此需要开放下端口。
sudo iptables -I INPUT -p tcp --dport 9090 -j ACCEPT 
这里就基于linux简单搭建了prometheus了。
3. 配置Prometheus
Prometheus是通过YAML文件来配置的。当运行Prometheus二进制文件,会指定一个配置文件。Prometheus自带默认的配置文件prometheus.yml,该文件位于刚刚解压缩的目录中。
YAML配置容易出错,需要注意缩进等相关问题。可以使用YAML Lint在线方式或者在命令行使用yamllint来验证YAML配置文件。YAMLlint 在线校验YAML网站
以下是 Prometheus默认的配置文件:
# my global config
global:
  scrape_interval: 15s # Set the scrape interval to every 15 seconds. Default is every 1 minute.
  evaluation_interval: 15s # Evaluate rules every 15 seconds. The default is every 1 minute.
  # scrape_timeout is set to the global default (10s).

# Alertmanager configuration
alerting:
  alertmanagers:
    - static_configs:
        - targets:
          # - alertmanager:9093

# Load rules once and periodically evaluate them according to the global 'evaluation_interval'.
rule_files:
  # - "first_rules.yml"
  # - "second_rules.yml"

# A scrape configuration containing exactly one endpoint to scrape:
# Here it's Prometheus itself.
scrape_configs:
  # The job name is added as a label `job=<job_name>` to any timeseries scraped from this config.
  - job_name: "prometheus"

    # metrics_path defaults to '/metrics'
    # scheme defaults to 'http'.

    static_configs:
      - targets: ["localhost:9090"]
可以看见在默认配置文件中定义了4个YAML块:
- global
- alerting
- rule_files
- scrape_configs
3.1 global
顾名思义,global包含了控制Prometheus服务器行为的全局配置。
其第一个参数scrape_interval是用来制定服务抓取数据的时间间隔(默认15S)。这个值是时间序列的颗粒度,即该序列中每一个数据点所覆盖的时间段。
建议:仅设置抓取时间间隔为全局参数以保持颗粒度一致,同时确保所有时间序列具有相同的颗粒度,可以组合在一起计算。
参数 evaluation_interval 是用来指定Prometheus评估规则的频率。目前主要有两种规则:记录规则(recording rule)和警报规则(alerting rule)。
- 记录规则: 允许预先计算使用频繁且开销大的表达式,并将结果保存为一个新的时间序列数据。
- 警报规则: 允许定义警报条件。
3.2 alerting
它是用来设置Prometheus的警报。警报是由名为Alertmanager的独立工具进行管理的。Alertmanager是一个可以集群化的独立警报管理工具。
# Alertmanager configuration
alerting:
  alertmanagers:
    - static_configs:
        - targets:
          # - alertmanager:9093
在默认配置中,alerting部分包含服务器的警报配置,其中alertmanagers块会列出Prometheus服务器使用的每个Alertmanager,static_configs块表示我们要手动指定在targets数组中配置的Alertmanager。
PS: Prometheus还支持Alertmanager的服务发现功能。如可以通过查询外部源(如Consul服务器)来返回可用的Alertmanager列表,而不是单独指定每个Alertmanager。
3.3 rule_files
它是用来指定包含记录规则和警报规则的文件列表,后续文章会详细讲到。
3.4 static_configs
它是用来指定Prometheus抓取的所有目标。Prometheus将它抓取的指标的数据源称为端点。为了抓取这些端点的数据,Prometheus定义了一个目标,这个目标里包含的信息是抓取数据所必须的。如用到的标签、建立连接所需的身份验证,或者其他定义数据抓取的信息。若干目标构成的组称为作业,作业里每个目标都有一个名为实例(instance)的标签,用来唯一标识这个目标。
scrape_configs:
  - job_name: "prometheus"
    static_configs:
      - targets: ["localhost:9090"]
在默认配置中定义了一个作业prometheus,它的static_configs参数部分列出了抓取的目标,这些特定的目标被单独列出来,而不是通过自动服务发现。当然,你也可以将静态配置理解为手动或人工服务发现。
这里的作业prometheus只有一个监控目标,即Prometheus服务器自身。它从本地的9090端口抓取数据并返回服务器的健康指标。Prometheus假设抓取的指标将返回到/metrics路径下,因此它会被追加到目标中然后抓取地址 http://localhost:9090/metrics。
4. 第一个指标
Prometheus服务器运行后,可以通过浏览 http://{ip}:9090/metrics 查看正在抓取的端点和一些原始的Prometheus指标。
通过运行以下指令能看见原始指标。
# HELP go_gc_duration_seconds A summary of the pause duration of garbage collection cycles.
# TYPE go_gc_duration_seconds summary
go_gc_duration_seconds{quantile="0"} 4.9549e-05
go_gc_duration_seconds{quantile="0.25"} 8.1253e-05
go_gc_duration_seconds{quantile="0.5"} 0.000120463
go_gc_duration_seconds{quantile="0.75"} 0.000182489
go_gc_duration_seconds{quantile="1"} 0.000866808
go_gc_duration_seconds_sum 0.004768729
go_gc_duration_seconds_count 28
...
指标go_gc_duration_seconds,里面有个标签quantile="0.5",表示这衡量的是第50百分位数,后面的数字是这个指标的值。
5 表达式浏览器
直接通过上面的方式查看指标对用户不太友好,所以可以使用Prometheus的内置表达式浏览器来查看,可访问 http://{ip}:9090/graph 获得。
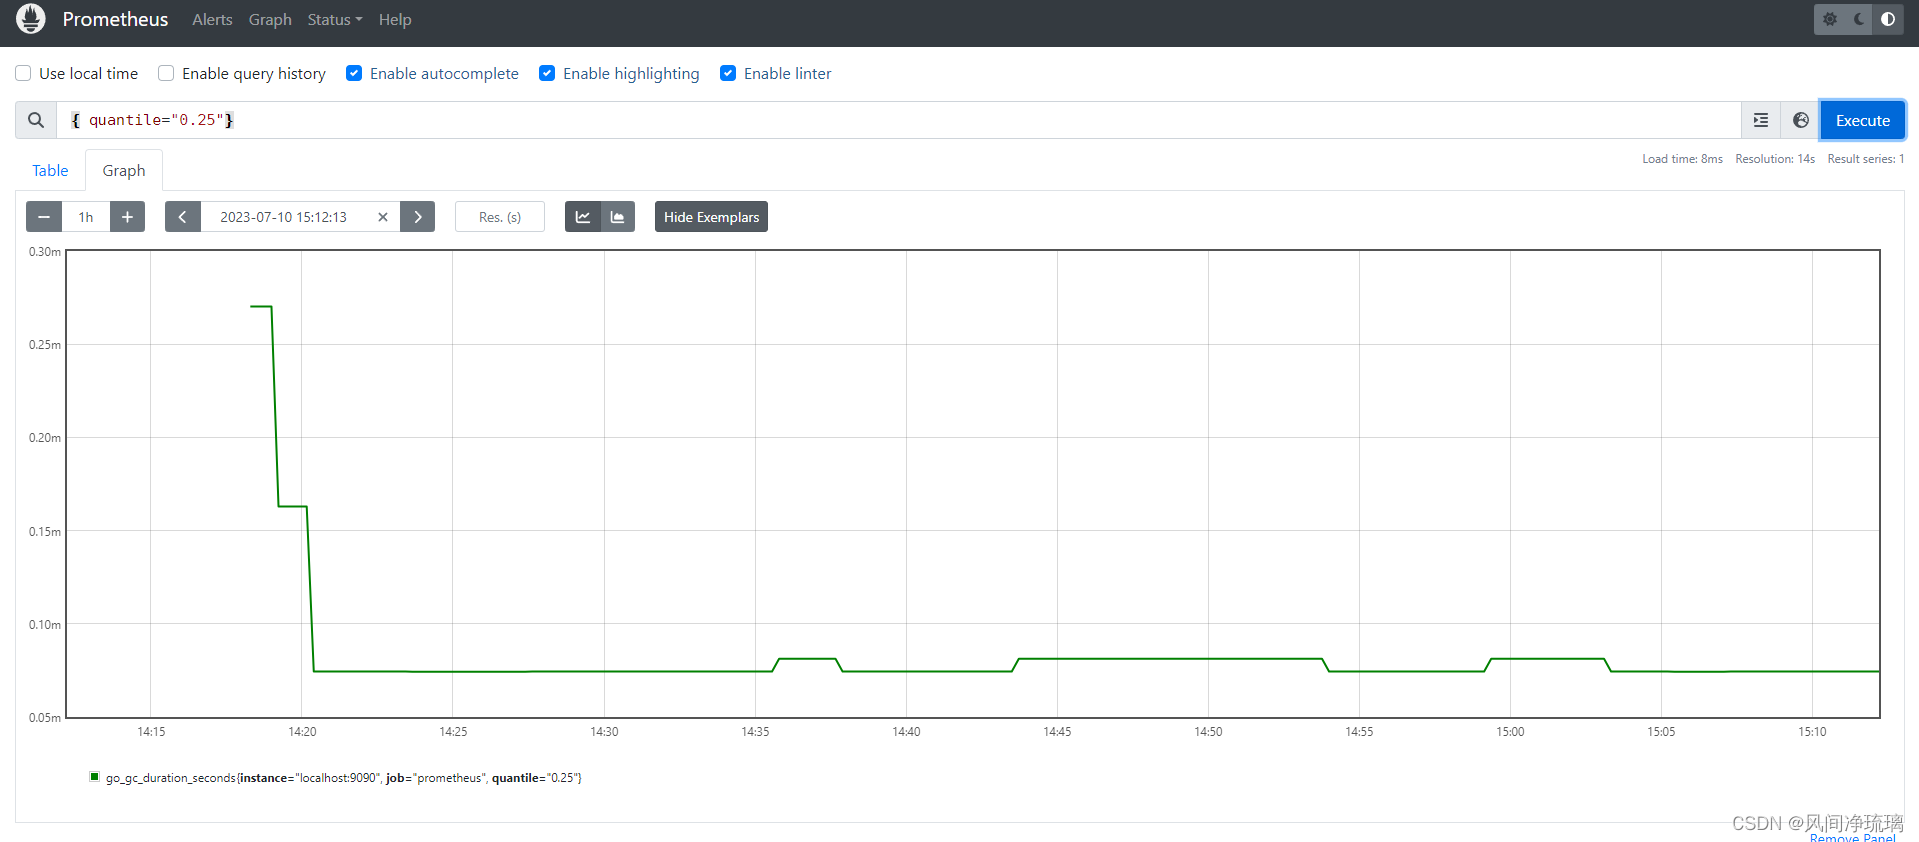
指标列表自动填充

指标名称筛选
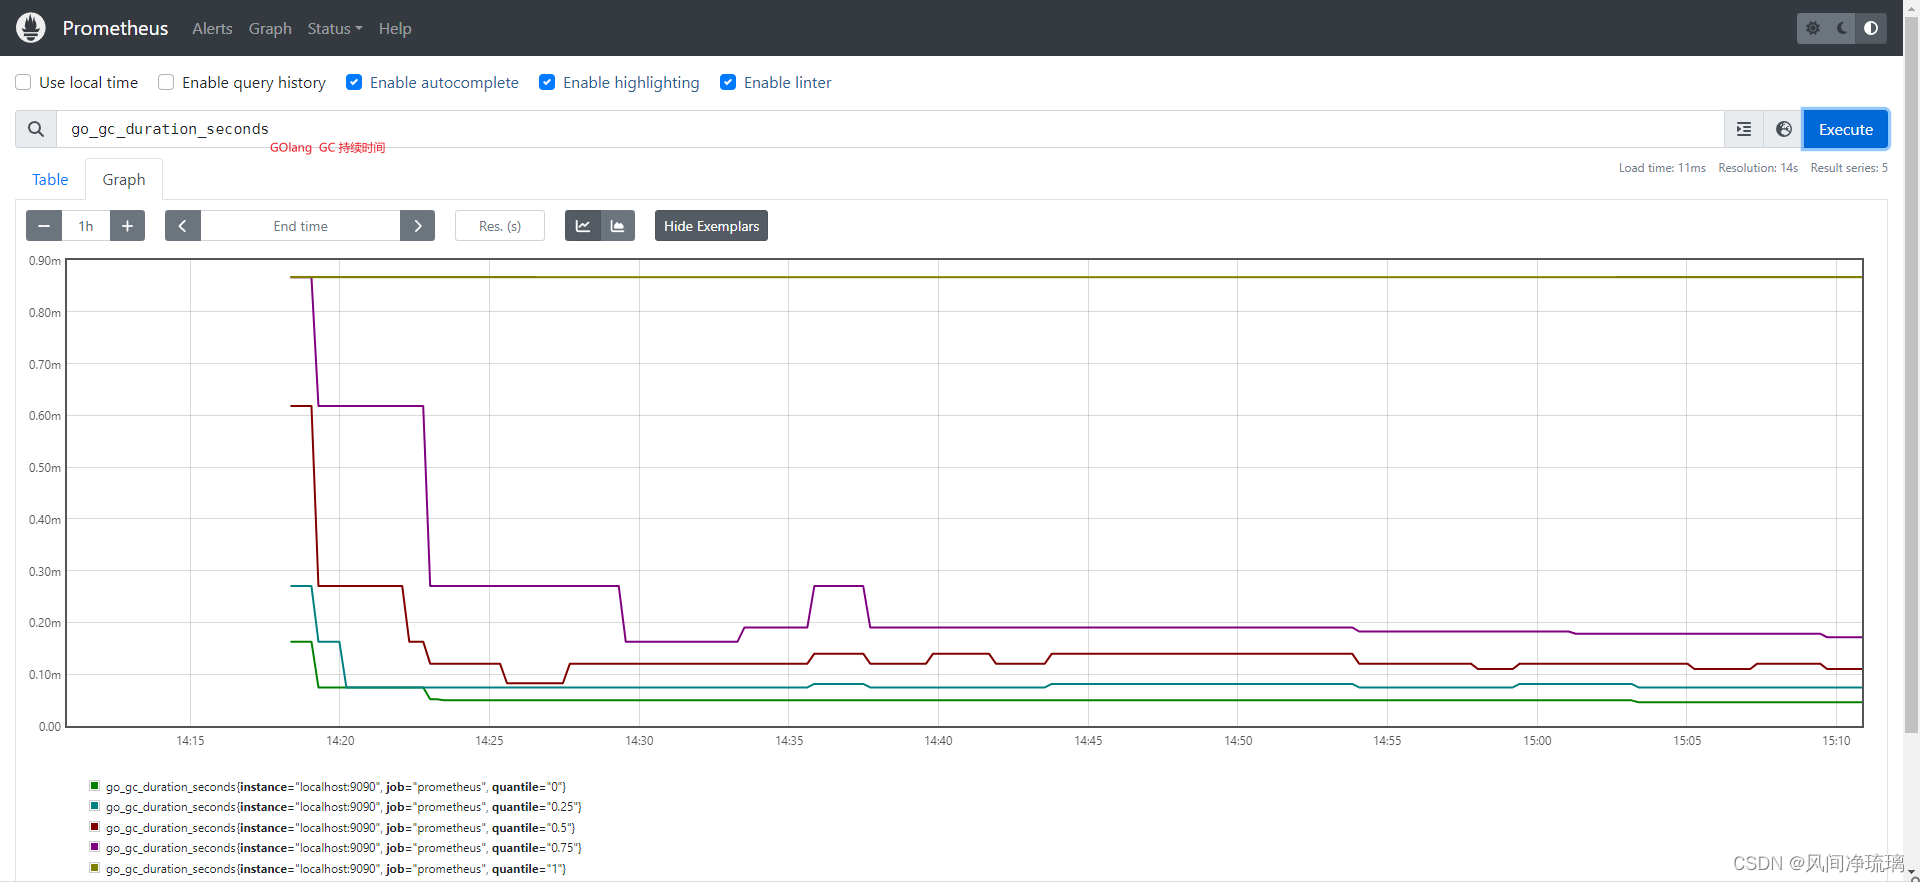
指标条件筛选

Prometheus在服务器中内置了一种名为PromQL的高度灵活的表达式语言,允许查询和聚合指标。
数据集是PromQL查询语言中的表达式可以返回的四种数据类型之一,该类型称为即时向量:一组包含每个时间序列的单个样本的时间序列集合,其中所有时间序列都共享相同的时间戳。
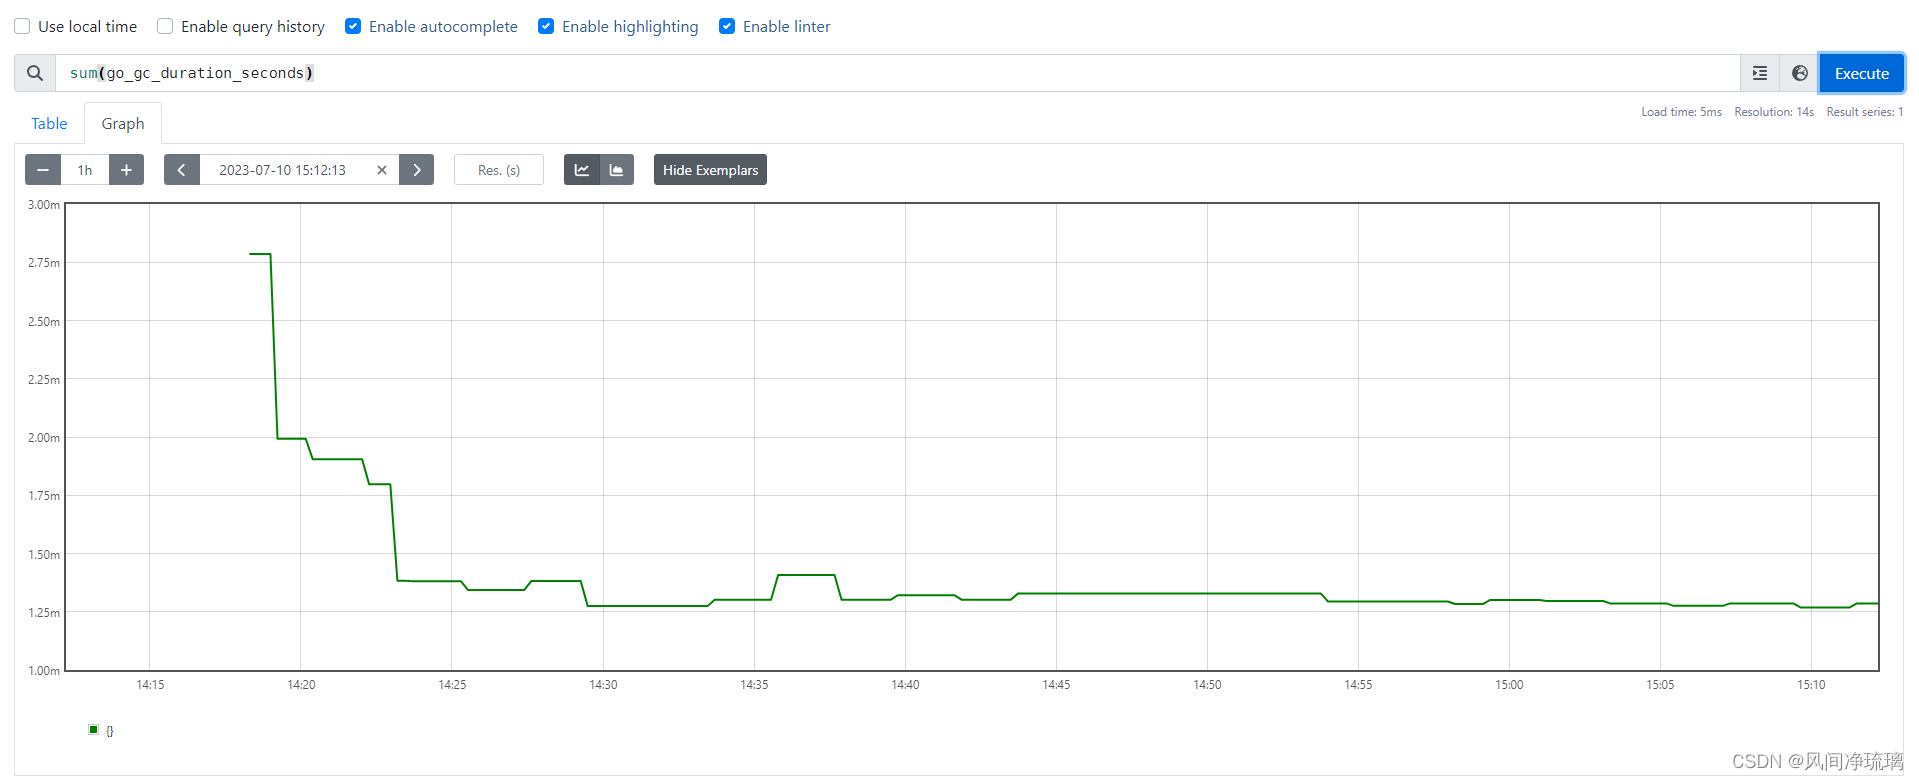
6. 聚合时间序列
在上面的查询界面中还可以进行指标的复杂聚合。选择指标go_gc_duration_seconds,查看它的总数。
sum函数进行累加
PromQL 子句by按特定维度聚合
sum(go_gc_duration_seconds) by (instance)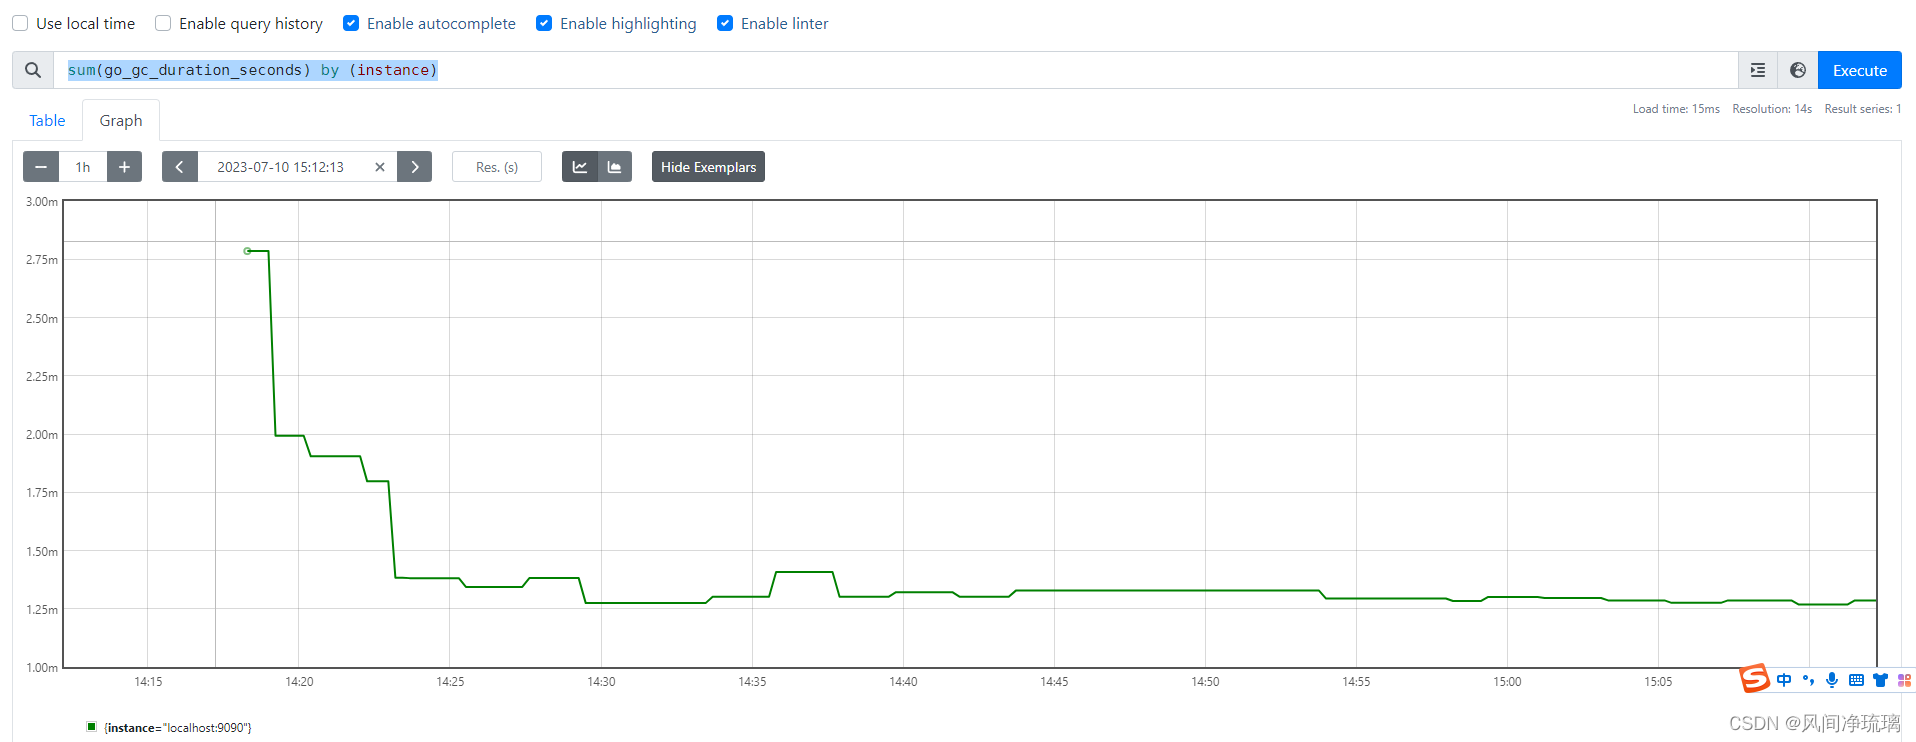
Rate()函数计算每秒平均增长率
rate(go_gc_duration_seconds_count[1m]) 这里我们计算1分钟范围向量的速率。 范围向量(range vector)是第二个PromQL数据类型,包含一组时间序列,每个时间序列都包含一系列数据点。范围向量允许我们显示该时间段的时间序列,持续时间被包含在[]中,内容是一个整数值后跟着一个单温,单位缩写为:
- s 表示秒
- m 表示分钟
- h 表示小时
- d 表示天
- w 表示周

rate()函数用来计算一定范围内时间序列的每秒平均增长率,只能与计数器一起使用,最适合用于增长较缓慢的计数器或用于警报的场景。
7. 容量规划
Prometheus的性能很大程度取决于配置、所收集的时间序列数量以及服务器上规则的复杂性,单位时间内采集的数据越多占用的内存就越多,对CPU消耗也大。常规的容量规划关注于两个问题: 内存和磁盘。
7.1 内存
Prometheus在内存中做了很多工作。每个收集的时间序列、查询和记录规则都会消耗进程内存。关于Prometheus的容量规划没有绝对的标准,经验之谈是将每秒采集的样本数乘以样本的大小。
假设每个样本大小2个字节,12小时内每秒收集100000个样本。内存使用情况:
100000*2 bytes*43200 seconds=8.64GB。
Prometheus可以参考以上值,并预留查询和记录规则方面的内存冗余。
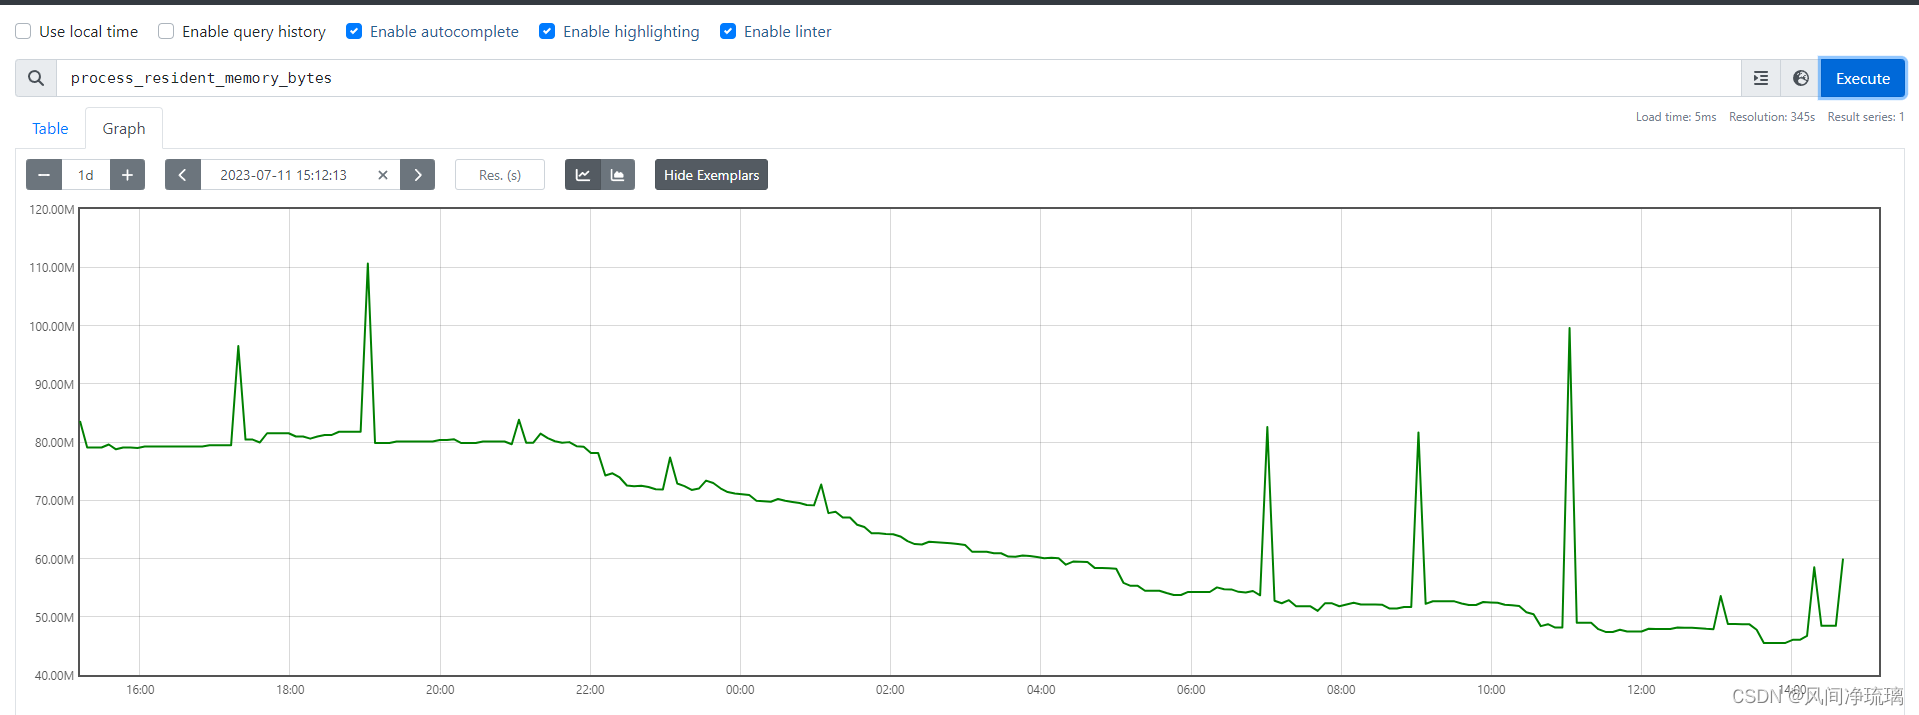
另外可以通过检查 process_resident_memory_bytes指标来查看Prometheus进程的内存使用情况。如下所示。
7.2 磁盘
磁盘使用量受存储的时间序列数量和这些时间序列的保留时间限制。默认情况下,指标会在本地时间序列数据库中存储15天。数据库的位置和保留时间由命令行选项控制。
- --storage.tsdb.path 选项:它的默认数据目录位于Prometheus的目录中,用于控制时间序列数据库位置。
- --storage.tsdb.retention选项: 控制时间序列的保留期。默认值为15d。
使用SSD作为时间序列数据库的磁盘,效果更佳(当然成本也更高)。
假设每个样本2个字节,每秒10万个样本,保存15天。
2 byte*100000*(15*24*60*60) s =247GB。
Prometheus可以参考以上值,并预留磁盘上的一些冗余。
7.3 CPU
cpu尽量关注下Prometheus部署的及其的CPU利用率。


 928
928


 被折叠的 条评论
为什么被折叠?
被折叠的 条评论
为什么被折叠?
 到【灌水乐园】发言


