


highchart通过ajax从后台取数据,当然我这里的数据是模拟的随机数,话不多说,上代码
后台action:
package action;

import java.util.Random;

public class ChartAction {
	private int account;

	public String sendData() {
		account = new Random().nextInt(100);
		return "success";
	}

	public int getAccount() {
		return account;
	}

	public void setAccount(int account) {
		this.account = account;
	}

}
struts2配置文件:
<?xml version="1.0" encoding="UTF-8" ?>
<!DOCTYPE struts PUBLIC "-//Apache Software Foundation//DTD Struts Configuration 2.1//EN" "http://struts.apache.org/dtds/struts-2.1.dtd">
<struts>
	<constant name="struts.devMode" value="true" />
	<constant name="struts.i18n.encoding" value="UTF-8"></constant>
	<!-- Dynamic method invoke/DMI -->
	<constant name="struts.enable.DynamicMethodInvocation" value="true" />
	<package name="main" namespace="/" extends="json-default">
		<action name="index">
			<result>
				index.jsp
			</result>
		</action>
		<action name="data" class="action.ChartAction">
			<result type="json">
				<param name="root">account</param>
			</result>
		</action>
	</package>
</struts>
$(function () {
    $(document).ready(function() {
        Highcharts.setOptions({
            global: {
                useUTC: false
            }
        });

        var chart;
        chart = new Highcharts.Chart({
            chart: {
        		renderTo:'container',
                type: 'spline',
                animation: Highcharts.svg, // don't animate in old IE
                marginRight: 10,
                events: {
                    load: function() {

                        // set up the updating of the chart each second
                        var series = this.series[0];
                        setInterval(function() {
                            var x = (new Date()).getTime(), // current time
                                y = Math.random();
                            series.addPoint([x, y], true, true);
                        }, 1000);
                    }
                }
            },
            title: {
                text: '测试小DEMO'
            },
            xAxis: {
                type: 'datetime',
                tickPixelInterval: 150
            },
            yAxis: {
            	max:100,
            	min:0,
                title: {
                    text: 'y轴'
                },
                plotLines: [{
                    value: 0,
                    width: 1,
                    color: '#808080'
                }]
            },
            tooltip: {
                formatter: function() {
                        return '<b>'+ this.series.name +'</b><br/>'+
                        Highcharts.dateFormat('%Y-%m-%d %H:%M:%S', this.x) +'<br/>'+
                        Highcharts.numberFormat(this.y, 2);
                }
            },
            legend: {
                enabled: true
            },
            exporting: {
                enabled: false
            },
            series: [{
                name: '测试第一条数据',
                data: (function() {
                    // generate an array of random data
                    var data = [],
                        time = (new Date()).getTime(),
                        i;

                    for (i = -19; i <= 0; i++) {
                        data.push({
                            x: time + i * 1000,
                            y: Math.random()*100
                        });
                    }
                    return data;
                })()
            }]
        });
        function getData() {
        	$.post("data!sendData.action", function(data) {
        		var x = new Date().getTime();
        		var y = data;
        		var series = chart.series[0];
        		 series.addPoint([x, y], true, true);
        	},"json");
        }
        setInterval(getData,1000);
    });
});
jsp代码:
<%@ page language="java"  pageEncoding="utf-8"%>


<!DOCTYPE HTML PUBLIC "-//W3C//DTD HTML 4.01 Transitional//EN">
<html>
  <head>

    <title>AnysCharts</title>
	<meta http-equiv="pragma" content="no-cache">
	<meta http-equiv="cache-control" content="no-cache">
	<meta http-equiv="expires" content="0">
	<meta http-equiv="keywords" content="keyword1,keyword2,keyword3">
	<meta http-equiv="description" content="This is my page">
	<script type="text/javascript" src="js/jquery-1.11.0.js"></script>
	<script type="text/javascript" src="js/highcharts.js"></script>
	<script type="text/javascript" src="js/exporting.js"></script>
	<script type="text/javascript" src="js/myCharts.js"></script>
	<!--
	<link rel="stylesheet" type="text/css" href="styles.css">
	-->
  </head>

  <body>
    <div id="container" style="width:800px;height:400px;margin:0 auto;"></div>
  </body>
</html>
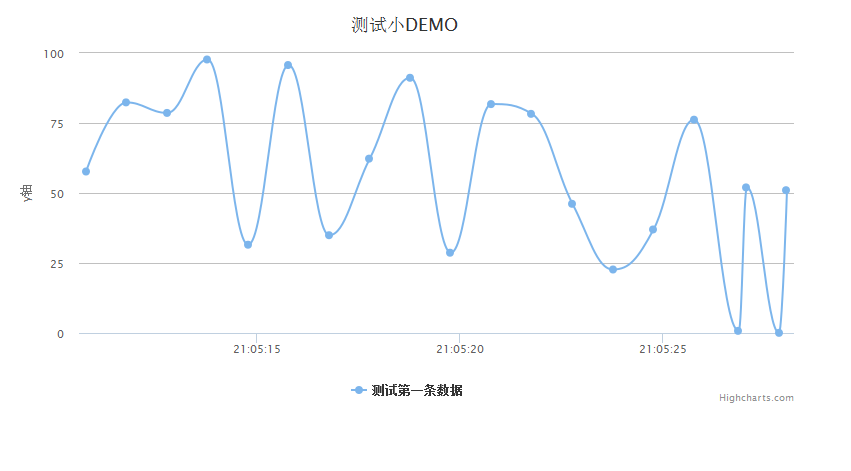
好了OK啦,上个效果图吧最后


 774
774

 被折叠的 条评论
为什么被折叠?
被折叠的 条评论
为什么被折叠?
 到【灌水乐园】发言


