


The inventory aging report evaluates all items in stock, providing insights into potentially sunken purchase costs and delays in profitability.
Create customized pivot tables to analyze product, operation types, month, or company breakdowns. This helps identify products in stock that are at risk of passing their expiration or viability dates, or instances of rot/decay for fast-expiring items.
Note
The Reporting menu in Inventory is only accessible to users with admin access.
To access the inventory aging report, go to Inventory app ‣ Reporting ‣ Inventory Aging.
Navigate the inventory aging report
By default, the Inventory Aging report displays a pivot table, with the month in columns, and product category in rows. The default filters, Incoming and Has Remaining Qty, show only products from receipts, and are currently in stock.
Remaining Qty displays the number of on-hand items, and Remaining Value displays the total cost of purchasing these items.
Clicking the (plus) icon in each column or row reveals options to expand the pivot table and show a detailed breakdown of the Remaining Qty and Remaining Value by Product, Product Category, Date, or Company. Clicking the (minus) icon collapses it back to its previous state.
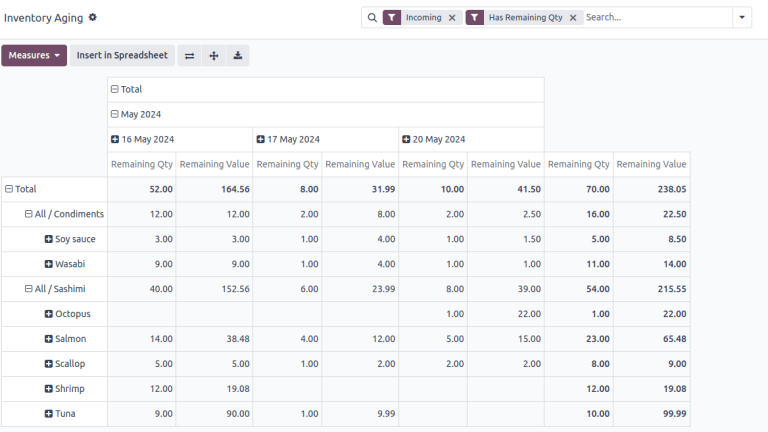
Inventory aging report, showing each Product in rows and each reception Date in columns, to better monitor products with fast expiration dates. Each row shows the the total on-hand quantity and inventory valuation of items purchased on each day.
Note
Records in the Inventory Aging report are stock valuation layers (SVLs), representing product moves that impact stock valuation.
Inventory adjustments do not create SVLs; only items purchased from vendors do.
Generate reports
After learning how to navigate the inventory aging report, it can be used to create and share different reports.
A few common reports that can be created using the Inventory Aging report are detailed below.
Rotating stock report
To create a report to identify items that have been in stock for a while, follow these steps:
-
Navigate to Inventory app ‣ Reporting ‣ Inventory Aging.
-
On the Inventory Aging report, click the (caret down) icon in the Search… bar to see a drop-down list of Filters, Group By, and Favorite options.
-
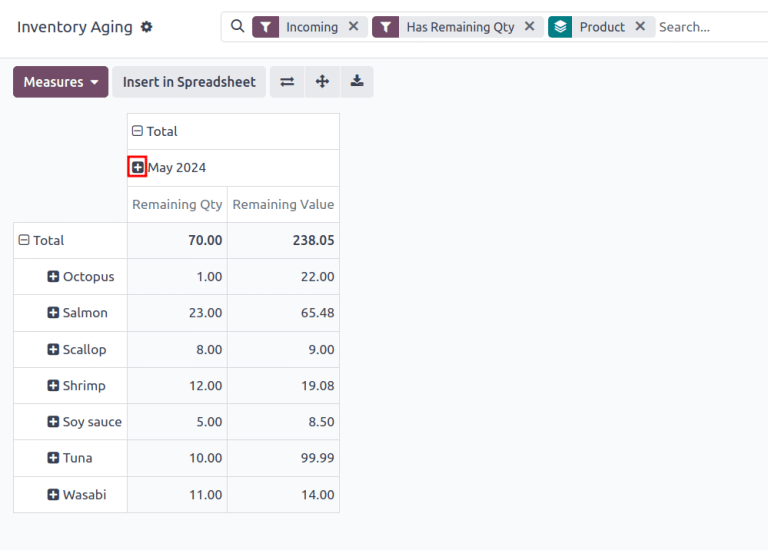
Choose Product under the Group By section. Doing so expands the pivot table to show a product in each row.
-
Click the (plus) icon to the left of the date column. Hover over Date from the drop-down menu and choose Year, Quarter, Month, Week, or Day. Doing so expands the columns to show the Remaining Qty and Remaining Value by the selected time period.
Tip
For products that have a longer shelf life, choose longer time periods such as Month or Quarter when expanding columns by Date.
-
The report now displays the on-hand stock of items, and their total purchasing cost, for each time period.
Example
Inventory aging report, with the Group By: Product option selected, and with the Date column set to Day. It gives insight into how much raw fish sashimi products were purchased on each day, and how much it cost. This informs the business owners how much stock is at risk of rotting in stock, per day.


 821
821


 被折叠的 条评论
为什么被折叠?
被折叠的 条评论
为什么被折叠?
 到【灌水乐园】发言


