


With the Purchase application, users can monitor procurement expenses over time. This report helps companies track and analyze spending, identify cost-saving opportunities, and ensure efficient budget management.
Create procurement expenses report
To create a procurement expenses report, first navigate to Purchase app ‣ Reporting ‣ Purchase to open the Purchase Analysis dashboard.
By default, the dashboard displays a line chart overview of the Untaxed Total of Purchase Orders (POs) with a Confirmation Date for the current month, or of Requests for Quotation (RFQs) with a status of Draft, Sent, or Cancelled.
Add filters and groups
On the top-right, click the (pivot) icon to switch to pivot view.
Tip
While the procurement expenses report can also be viewed as a (bar chart), (line chart), or (pie chart), the pivot view provides the most detailed view of the data, and is the recommended starting point.
Remove any default filters from the Search… bar. Then, click the (down) icon to open the drop-down menu that contains the Filters, Group By, and Favorites columns.
Note
Unless otherwise specified, the report displays data from both RfQs and POs. This can be changed by selecting either Requests for Quotation or Purchase Orders under the Filters column.
Under the Filters column, select a time frame to use for comparison. The report can be filtered by either Order Date or Confirmation Date. Choose one from the list, and click the (down) icon to specify the date range, either by month, quarter, or year.
Next, under the Group by column, select Vendor. Then, select Product Category, which is also located in the Group By column.
Note
The selections under the Group By heading can be altered, depending on the needs of the individual company. For example, selecting Product, instead of Product Category, provides a more in depth look at the performance of specific items, in place of an entire category.
Next, make a selection under the Comparison heading that appears. These options are only available after the date range is selected under the Filters column, and vary based on that range. Previous Period adds a comparison to the previous period, such as the last month or quarter. Previous Year compares the same time period from the previous year.
Note
While multiple time-based filters can be added at once, only one comparison can be selected at a time.
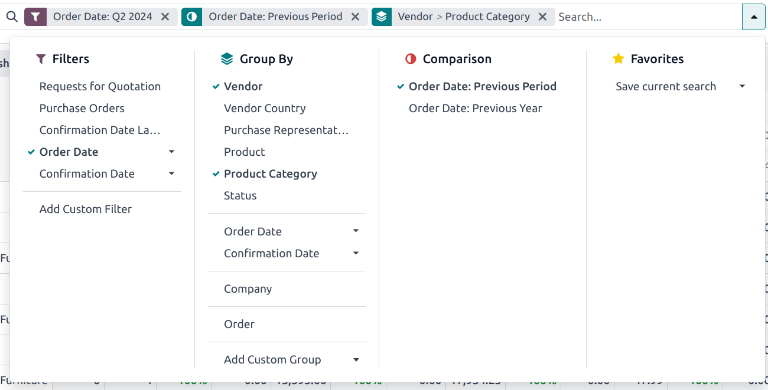
The filter for Q2, comparison for Previous Period, and group-by for Vendor and Product Category were selected.
Add measures
After selecting the Filters, Group by, and Comparison settings, click out of the drop-down menu.
By default, the report displays data with the following measures: Order, Total, Untaxed Total, and Count. Click Measures at the top-left to open the drop-down list of available measures.
Click the following specific measures to include additional columns for the procurement expenses report:
-
Total and Untaxed Total: can include one or both measures. These are included for overall spending analysis.
-
Average Cost: included to evaluate cost efficiency.
-
Days to Confirm and Days to Receive: used to assess supplier performance.
-
Qty Ordered and Qty Received: used to understand order efficiency.
-
Qty Billed and Qty to be Billed: used to track order accuracy.
Tip
Additional measures can be included in the report, if desired, to provide additional insights. For example, Gross Weight and Volume may be included for further logistics and management analysis.
After selecting all necessary measures, click out of the drop-down menu.
View results
After all of the filters and measures have been selected, the report generates in the selected view.
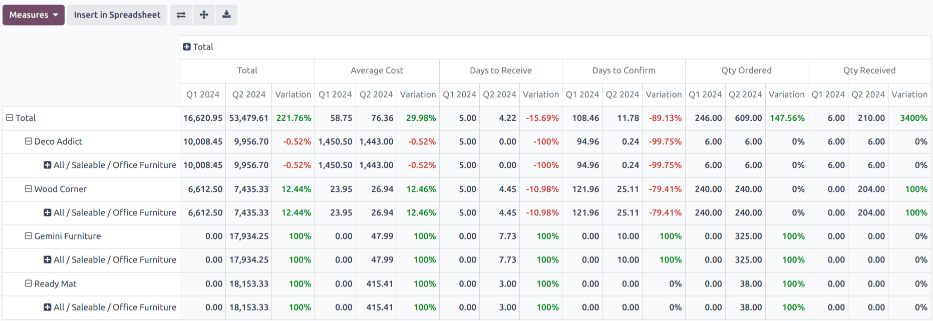
Click Insert in Spreadsheet to add the pivot view into an editable spreadsheet format within the Documents app.
Important
The Insert in Spreadsheet option is only available if the Documents Spreadsheet module is installed.
Note
The procurement expenses report is also available in graph view. Click the (area chart) icon to change to graph view. Click the corresponding icon at the top of the report to switch to a (bar chart), (line chart), or (pie chart).
See also
To save this report as a favorite, see Favorites.


 被折叠的 条评论
为什么被折叠?
被折叠的 条评论
为什么被折叠?
 到【灌水乐园】发言


