


Spring Boot Actuator可以帮助你监控和管理Spring Boot应用,比如健康检查、审计、统计和HTTP追踪等。所有的这些特性可以通过JMX或者HTTP endpoints来获得。
Actuator同时还可以与外部应用监控系统整合,比如 Prometheus, Graphite, DataDog, Influx, Wavefront, New Relic等。这些系统提供了非常好的仪表盘、图标、分析和告警等功能,使得你可以通过统一的接口轻松的监控和管理你的应用。
Actuator在Spring Boot 1 和 Spring Boot 2中有所不同。本文使用Spring Boot 2.1.5.RELEASE。
引言-从Spring Boot Admin说起
在详细讲解Spring Boot Actuator之前,我们先看下Spring Boot Admin,我们用它来做个引子,关于Spring Boot Admin的详细功能介绍,可以另行参考。
Spring Boot Admin 用于监控基于 Spring Boot 的应用,它是在 Spring Boot Actuator 的基础上提供简洁的可视化 WEB UI。
Spring Boot Admin 提供了很多功能,如显示 name、id 和 version,显示在线状态,Loggers 的日志级别管理,Threads 线程管理,Environment 管理等。
创建Spring Boot Admin服务端
使用Spring Initializr创建:

创建后的pom.xml关键部分如下,其实就只是加入了spring-boot-admin-starter-server依赖:
1 2 3 4 5 6 7 8 9 10 11 12 13 14 15 16 17 18 19 20 21 22 23 | <parent>
<groupId>org.springframework.boot</groupId>
<artifactId>spring-boot-starter-parent</artifactId>
<version>2.1.5.RELEASE</version>
<relativePath/> <!-- lookup parent from repository -->
</parent>
<dependencies>
<dependency>
<groupId>de.codecentric</groupId>
<artifactId>spring-boot-admin-starter-server</artifactId>
</dependency>
</dependencies>
<dependencyManagement>
<dependencies>
<dependency>
<groupId>de.codecentric</groupId>
<artifactId>spring-boot-admin-dependencies</artifactId>
<version>${spring-boot-admin.version}</version>
<type>pom</type>
<scope>import</scope>
</dependency>
</dependencies>
</dependencyManagement>
|
在application.yml中配置server.port=8888,让它运行在8888端口
在运行主类上使用@EnableAdminServer
1 2 3 4 5 6 7 | @SpringBootApplication
@EnableAdminServer
public class LearnSpringBootAdminApplication {
public static void main(String[] args) {
SpringApplication.run(LearnSpringBootAdminApplication.class, args);
}
}
|
运行该应用,访问localhost:8888

Spring Boot Admin已经正常启动,下面我们启动一个应用,并在Admin上进行监控、管理。
将应用注册到Spring Boot Admin
可以直接在已有项目中直接引入spring-boot-admin-starter-client依赖。
我们这里直接创建一个新的项目,还是推荐使用Spring Initializr:
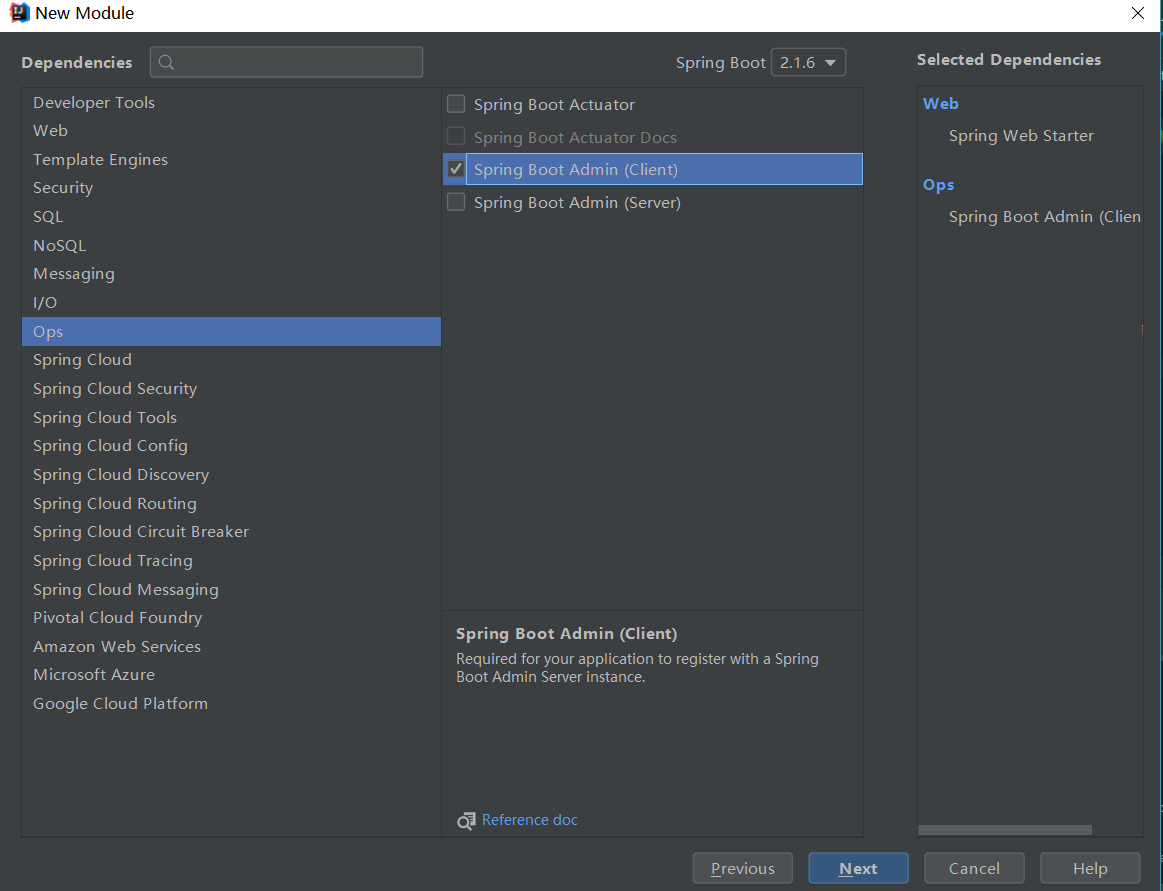
创建后的pom.xml关键部分如下:
1 2 3 4 5 6 7 8 9 10 11 12 13 14 15 16 17 18 19 20 21 22 23 24 25 26 27 28 29 | <parent>
<groupId>org.springframework.boot</groupId>
<artifactId>spring-boot-starter-parent</artifactId>
<version>2.1.6.RELEASE</version>
<relativePath/> <!-- lookup parent from repository -->
</parent>
<dependencies>
<dependency>
<groupId>de.codecentric</groupId>
<artifactId>spring-boot-admin-starter-client</artifactId>
</dependency>
<dependency>
<groupId>org.springframework.boot</groupId>
<artifactId>spring-boot-starter-web</artifactId>
</dependency>
</dependencies>
<dependencyManagement>
<dependencies>
<dependency>
<groupId>de.codecentric</groupId>
<artifactId>spring-boot-admin-dependencies</artifactId>
<version>${spring-boot-admin.version}</version>
<type>pom</type>
<scope>import</scope>
</dependency>
</dependencies>
</dependencyManagement>
|
application.yml中指定Admin服务器的地址,和本服务的运行端口(8000)、服务名
1 2 3 | spring.boot.admin.client.url: "http://localhost:8888" server.port: 8000 spring.application.name: GreetingServer |

点击该应用,进入该应用的监控界面。
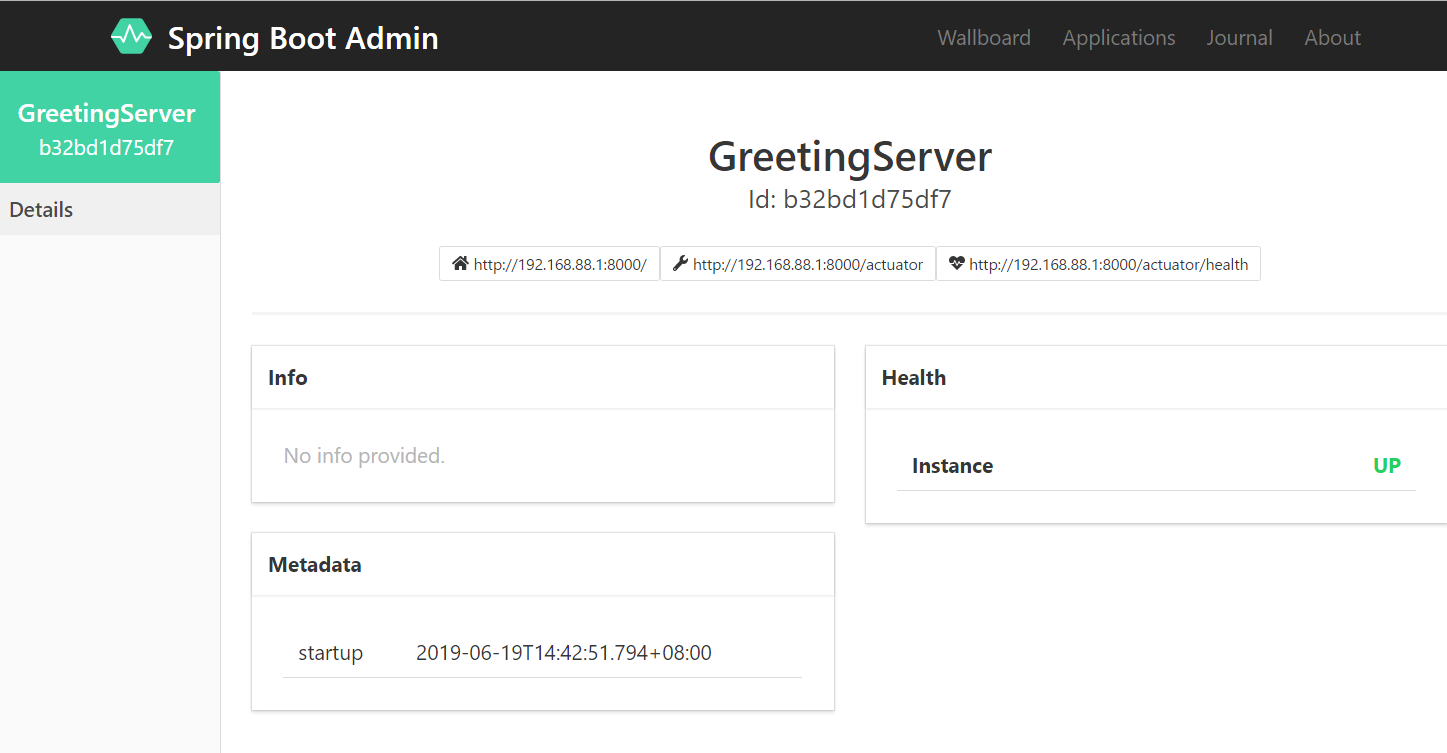
什么监控信息都看不到!
接下来,就需要使用Spring Boot Actuator暴露指标信息,供Spring Boot Admin使用。
修改GreetingServer应用的application.yml:
1 2 3 4 5 6 7 | spring.boot.admin.client.url: "http://localhost:8888" server.port: 8000 spring.application.name: GreetingServer # 暴露所有actuator端点 management.endpoints.web.exposure.include: "*" # 暴露服务健康自检的详细信息 management.endpoint.health.show-details: always |
重启GreetingServer应用,再次进入Spring Boot Admin: 
可以查看JVM、系统变量、Bean、HTTP连接等等监控,还可以通过JMX对运行时的配置进行修改

显然,是Spring Boot Actuator提供了服务监控、管理等强大功能。下面,进入Actuator的详细介绍吧。
Spring Boot Actuator
Spring Boot Actuator可以帮助你监控和管理Spring Boot应用,比如健康检查、审计、统计和HTTP追踪等。所有的这些特性可以通过JMX或者HTTP endpoints来获得。
除了上面引言中的Spring Boot Admin,还可以与其他更加强大的应用监控系统整合,比如 Prometheus, Graphite, DataDog, Influx, Wavefront, New Relic等。这些系统提供了非常好的仪表盘、图标、分析和告警等功能,使得你可以通过统一的接口轻松的监控和管理你的应用。
引言中的GreetingServer应用,由于pom依赖了spring-boot-admin-starter-client,从而间接依赖了Actuator。现在我们抛开Spring Boot Admin,只讨论Actuator,所以将pom修改如下:
1 2 3 4 5 6 7 8 9 10 11 12 13 14 15 16 | <parent>
<groupId>org.springframework.boot</groupId>
<artifactId>spring-boot-starter-parent</artifactId>
<version>2.1.5.RELEASE</version>
<relativePath/> <!-- lookup parent from repository -->
</parent>
<dependencies>
<dependency>
<groupId>org.springframework.boot</groupId>
<artifactId>spring-boot-starter-web</artifactId>
</dependency>
<dependency><!-- 加入actuator依赖 -->
<groupId>org.springframework.boot</groupId>
<artifactId>spring-boot-starter-actuator</artifactId>
</dependency>
</dependencies>
|
application.yml不变,启动应用,访问localhost:8000/actuator,展示了当前Actuator暴露的endpoint,由于在yml中配置了management.endpoints.web.exposure.include: "*",所以当前可以访问所有endpoint。

比如访问health终端:

health终端显示了健康自检的详细情况,这是因为yml中配置了management.endpoint.health.show-details: always,该值默认为never,那么就不会展示每个HealthIndicator的详情,而只说明整个服务是否可用的最终结论。如{�status�:�DOWN�}。
在“detials”中,有一个名字为"my"的HealthIndicator,这是因为我实现了一个名为MyHealthIndicator自定义的HealthIndicator。
1 2 3 4 5 6 7 8 9 10 11 12 13 14 15 | @Component
public class MyHealthIndicator implements HealthIndicator {
public static int DB_ERROR = 1001;
@Override
public Health health() {
if (GreetingController.canVisitDb) {
//成功连接数据库,返回 UP
return new Health.Builder(Status.UP).build();
} else {
//连接数据库失败,返回 out of service
return Health.down().withDetail("连接数据库失败", DB_ERROR).build();
}
}
}
|
关于服务健康自检,可以参考我的《Spring-Cloud-Eureka》服务健康自检一节
Actuator的/health端点、和其他所有暴露的端点(endpoint)的信息都可以被其他监控服务所拉取,比如引言中的Spring Boot Admin。

下面的表格展示了Actuator的所有预定义endpoint
| ID | 描述 | 默认启用 |
|---|---|---|
| auditevents | 显示当前应用程序的审计事件信息 | Yes |
| beans | 显示一个应用中所有Spring Beans的完整列表 | Yes |
| conditions | 显示配置类和自动配置类(configuration and auto-configuration classes)的状态及它们被应用或未被应用的原因 | Yes |
| configprops | 显示一个所有@ConfigurationProperties的集合列表 | Yes |
| env | 显示来自Spring的 ConfigurableEnvironment的属性 | Yes |
| flyway | 显示数据库迁移路径,如果有的话 | Yes |
| health | 显示应用的健康信息(当使用一个未认证连接访问时显示一个简单的’status’,使用认证连接访问则显示全部信息详情) | Yes |
| info | 显示任意的应用信息 | Yes |
| liquibase | 展示任何Liquibase数据库迁移路径,如果有的话 | Yes |
| metrics | 展示当前应用的metrics信息 | Yes |
| mappings | 显示一个所有@RequestMapping路径的集合列表 | Yes |
| scheduledtasks | 显示应用程序中的计划任务 | Yes |
| sessions | 允许从Spring会话支持的会话存储中检索和删除(retrieval and deletion)用户会话。使用Spring Session对反应性Web应用程序的支持时不可用。 | Yes |
| shutdown | 允许应用以优雅的方式关闭(默认情况下不启用) | No |
| threaddump | 执行一个线程dump | Yes |
如果使用web应用(Spring MVC, Spring WebFlux, 或者 Jersey),你还可以使用以下端点:
| ID | 描述 | 默认启用 |
|---|---|---|
| heapdump | 返回一个GZip压缩的hprof堆dump文件 | Yes |
| jolokia | 通过HTTP暴露JMX beans(当Jolokia在类路径上时,WebFlux不可用) | Yes |
| logfile | 返回日志文件内容(如果设置了logging.file或logging.path属性的话),支持使用HTTP Range头接收日志文件内容的部分信息 | Yes |
| prometheus | 以可以被Prometheus服务器抓取的格式显示metrics信息 | Yes |
Metrics端点
Spring Boot 2.0中,内部指标的统计使用 Micrometer,我们可以从/actuator/metrics获得都有那些指标:
1 2 3 4 5 6 7 8 9 | {
"names": [
"jvm.gc.pause",
"jvm.buffer.memory.used",
"jvm.memory.used",
"jvm.buffer.count",
// ...
]
}
|
要获得特定metric的实际值,比如jvm.gc.pause,可以访问/actuator/metrics/jvm.gc.pause
1 2 3 4 5 6 7 8 9 10 11 12 13 14 15 16 17 18 19 20 21 22 23 24 | {
"name": "jvm.gc.pause",
"measurements": [
{"statistic": "Count","value": 3.0},
{"statistic": "TotalTime","value": 7.9E7},
{"statistic": "Max","value": 7.9E7}
],
"availableTags": [
{
"tag": "cause",
"values": [
"Metadata GC Threshold",
"Allocation Failure"
]
},
{
"tag": "action",
"values": [
"end of minor GC",
"end of major GC"
]
}
]
}
|
加入一个Controller:
1 2 3 4 5 6 7 8 9 | @RestController
public class GreetingController {
@GetMapping("/greeting1")
public String greeting1() { return "greeting1"; }
@GetMapping("/greeting2")
public String greeting2() { return "greeting2"; }
}
|
启动应用后多访问几次/greeting1和/greeting2。然后访问/actuator/metrics/http.server.requests
1 2 3 4 5 6 7 8 9 10 11 12 13 14 15 16 17 18 19 20 21 22 23 24 25 | {
"name": "http.server.requests",
"description": null,
"baseUnit": "seconds",
"measurements": [
{"statistic": "COUNT","value": 45},
{"statistic": "TOTAL_TIME","value": 1.3034331529999998},
{"statistic": "MAX","value": 0.018845546}
],
"availableTags": [
{"tag": "exception","values": ["None"]},
{"tag": "method","values": ["GET"]},
{"tag": "uri","values": [
"/actuator/metrics/{requiredMetricName}",
"/greeting1",
"/actuator/prometheus",
"/actuator/metrics",
"/greeting2",
"/**"
]
},
{"tag": "outcome","values": ["CLIENT_ERROR","SUCCESS"]},
{"tag": "status","values": ["404","200"]}
]
}
|
可以看到,一共有45次请求,请求总共时间为1.3034331529999998秒等等统计信息。
我们还可以根据tag进行下钻(drill down)查询:/actuator/metrics/http.server.requests?tag=uri:/greeting1
1 2 3 4 5 6 7 8 9 10 11 12 13 14 15 16 | {
"name": "http.server.requests",
"description": null,
"baseUnit": "seconds",
"measurements": [
{"statistic": "COUNT","value": 1},
{"statistic": "TOTAL_TIME","value": 0.007784208},
{"statistic": "MAX","value": 0}
],
"availableTags": [
{"tag": "exception","values": ["None"]},
{"tag": "method","values": ["GET"]},
{"tag": "outcome","values": ["SUCCESS"]},
{"tag": "status","values": ["200"]}
]
}
|
另外可以配置/info端点的内容、自定义端点、对端点进行访问控制等,详情可以参考SpringBoot官方文档。
另外可以配置/info端点的内容、自定义端点、对端点进行访问控制等,详情可以参考SpringBoot官方文档。
引言中的Spring Boot Admin就是通过收集这些metrics,然后展示到UI界面的。
Prometheus
革命尚未成功——Spring Boot应用引入Actuator后,具有了指标统计的功能,但还需要强大的监控系统(Spring Boot Admin太弱了)。
是什么
https://prometheus.io/docs/introduction/overview/
Prometheus is an open-source systems monitoring and alerting toolkit originally built at SoundCloud.
Prometheus scrapes metrics from instrumented jobs, either directly or via an intermediary push gateway for short-lived jobs. It stores all scraped samples locally and runs rules over this data to either aggregate and record new time series from existing data or generate alerts. Grafana or other API consumers can be used to visualize the collected data.
架构

- Prometheus Server: Prometheus服务端,由于存储及收集数据,提供相关api对外查询用。
- Exporter: 类似传统意义上的被监控端的agent,有区别的是,它不会主动推送监控数据到server端,而是等待server端定时来手机数据,即所谓的主动监控。
- Pushagateway: 用于网络不可直达而居于exporter与server端的中转站。比如只会运行短暂时间的应用,无法一直暴露监控数据,就需要先存储在Pushagateway。
- Alertmanager: 报警组件,将报警的功能单独剥离出来放在alertmanager。
- Web UI: Prometheus的web接口,可用于简单可视化,及语句执行或者服务状态监控。
特性
- 用多维度数据模型来表示监控数据。监控数据的时间序列由
metric名称和键值对标识 PromQL, 在多维数据模型上的一种灵活的查询语言- 不依赖分布式存储;单个服务器节点是自治的
- 时间序列数据通过HTTP PULL收集
- 时间序列推送是通过中间网关来支持
- 可以通过服务发现或静态配置来发现监控目标
与Spring Boot Actuator建立关系
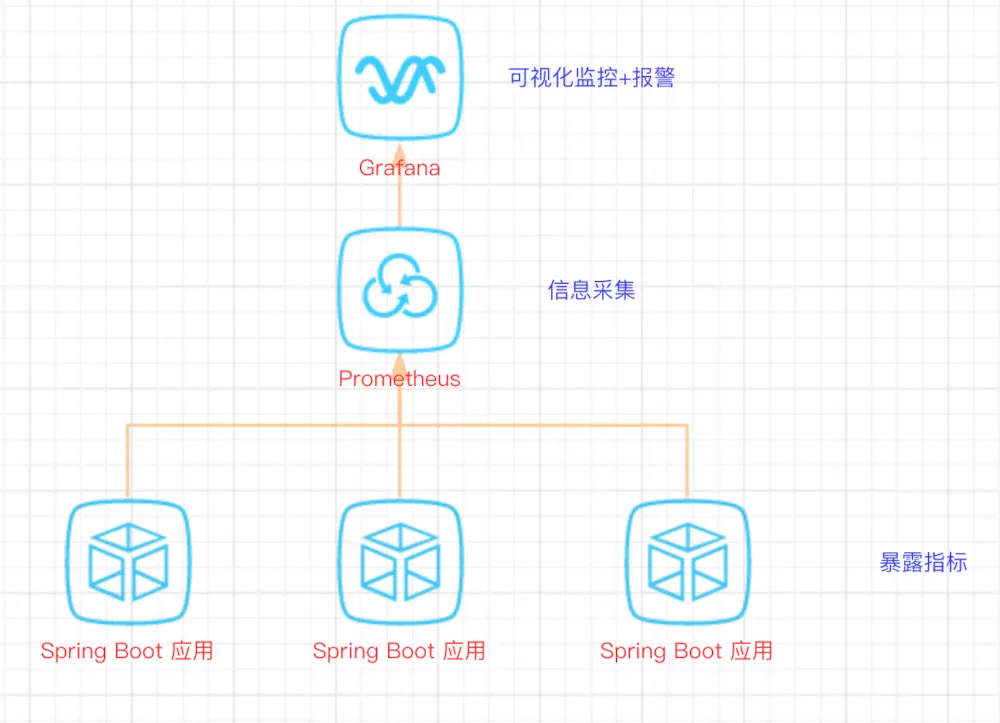
SpringBoot采用Micrometer统计指标后,通过Micrometer Prometheus Registry暴露指标,并按照要求的格式,供Prometheus服务端抓取,Prometheus提供了存储、报警、查询、高可用等功能。而Grafana则基于Prometheus的功能提供了可视化展示。
运行
下载、运行Prometheus Server很简单。官网下载解压后直接运行就可以了。不过在运行之前先看一下Prometheus自己的配置文件初始内容
prometheus.yml初始内容关键部分:
1 2 3 4 5 6 7 8 9 10 11 | # A scrape configuration containing exactly one endpoint to scrape:
# Here it's Prometheus itself.
scrape_configs:
# The job name is added as a label `job=<job_name>` to any timeseries scraped from this config.
- job_name: 'prometheus'
# metrics_path defaults to '/metrics'
# scheme defaults to 'http'.
static_configs:
- targets: ['localhost:9090']
|
scrape_configs下配置了一个名为prometheus的抓取任务,目标是localhost:9090。
初始的prometheus.yml中,prometheus服务会默认抓取自身的监控数据。
我们启动Prometheus(在windows中直接运行prometheus.exe就可以了)
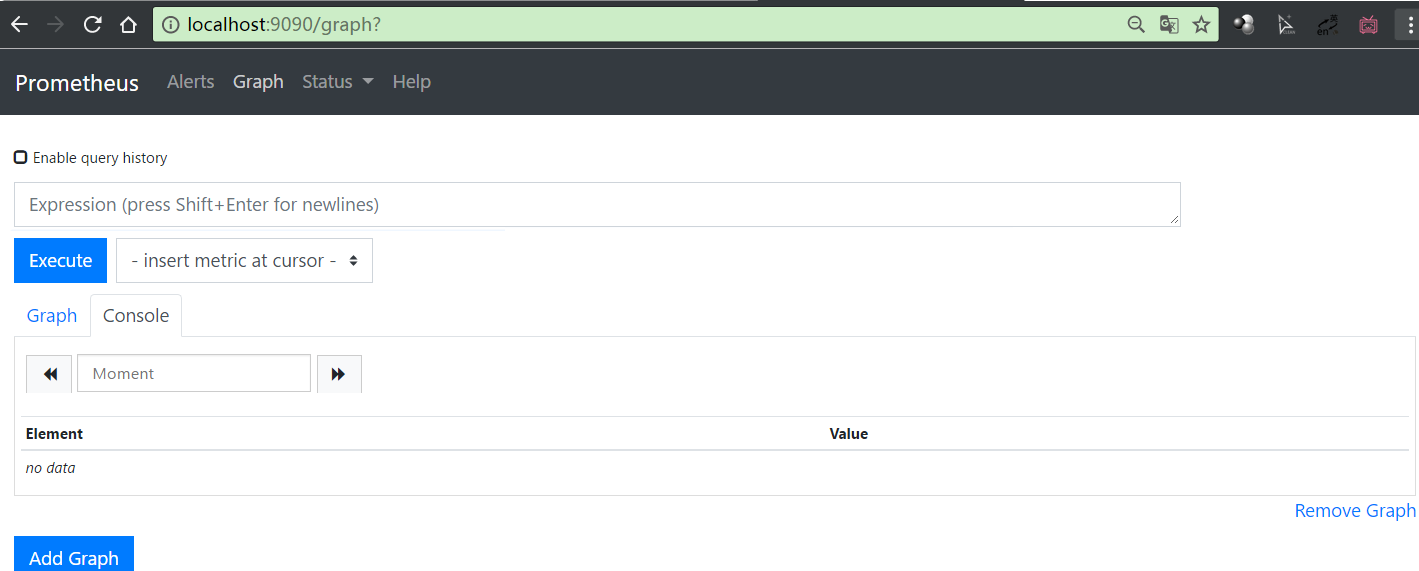
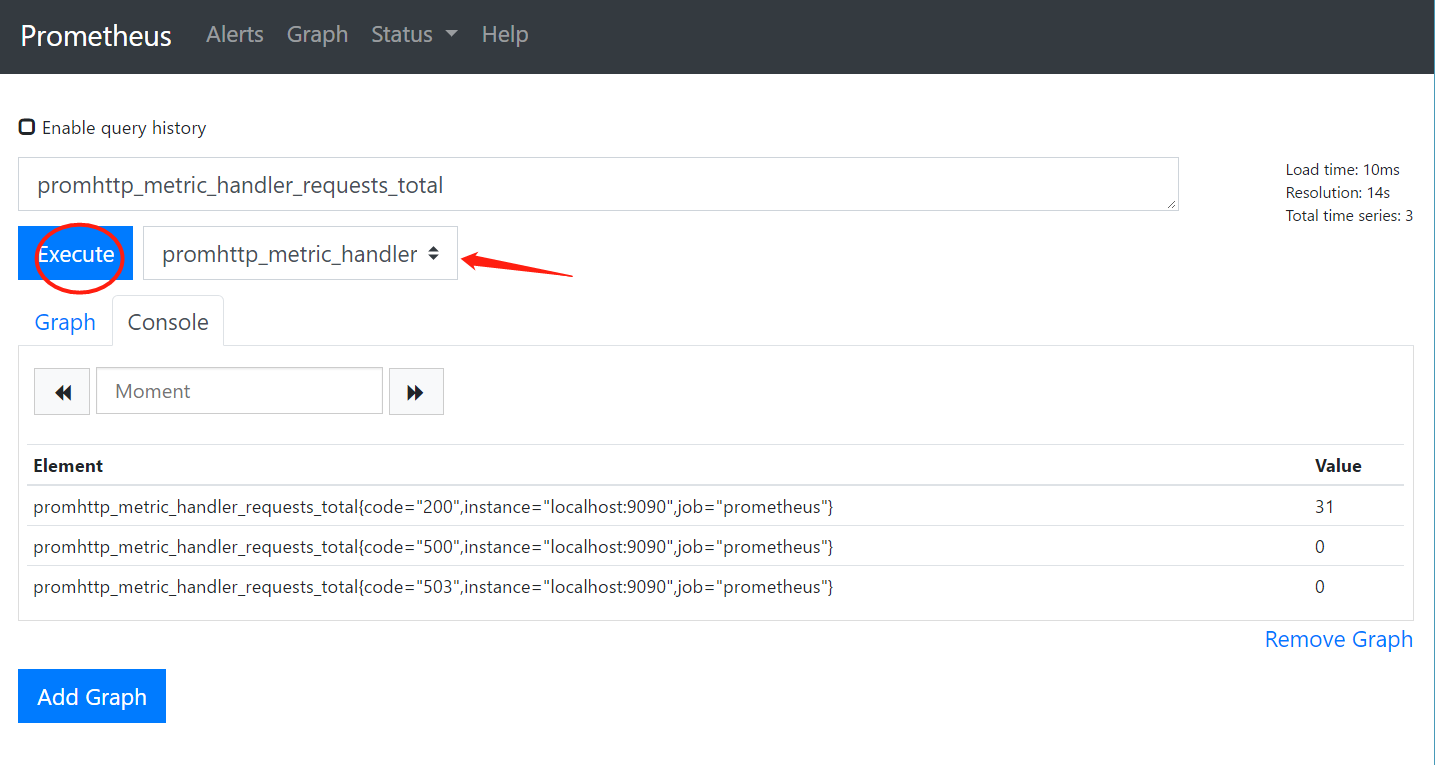
在下拉菜单中可以看到一些监控指标,选中后点击Execute可以查询指标的当前值
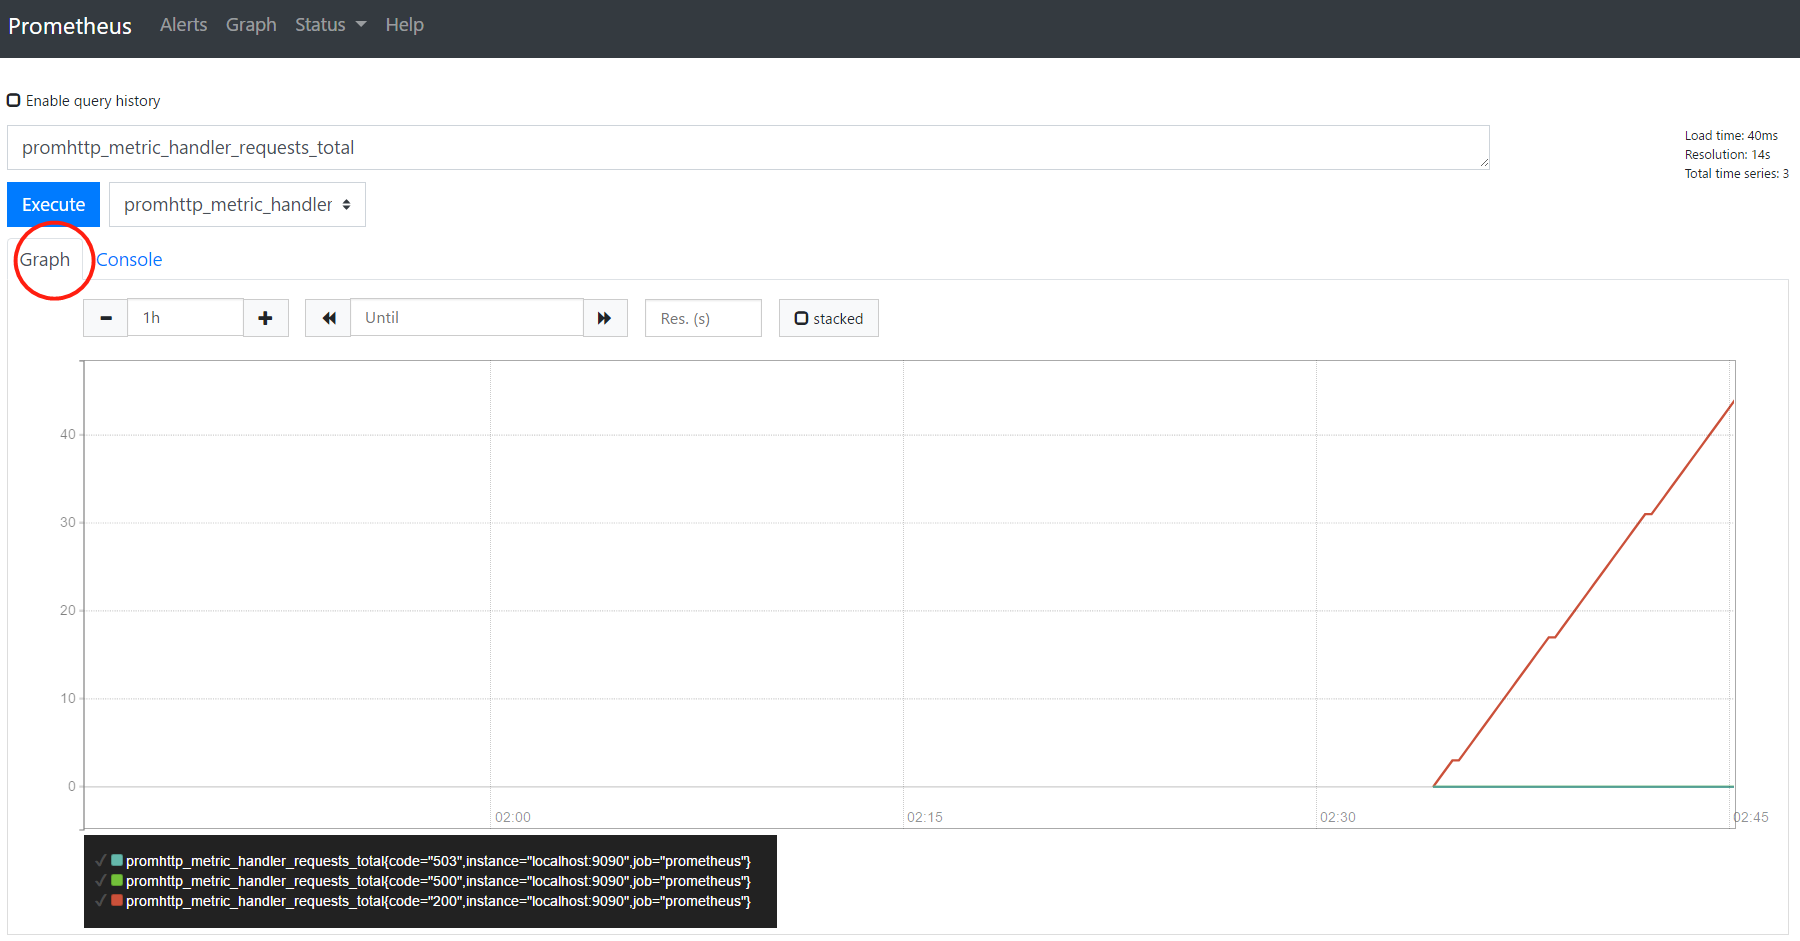
还可以切换到Graph卡片,查看折线图
下面,我们学习下如何监控SpringBoot应用。
监控Spring Boot应用
在我们之前创建的应用中再加入micrometer-registry-prometheus依赖,该模块可以将micormeter采集到的监控数据,整合成Prometheus要求的格式,然后发布到特定endpoint(默认/actuator/prometheus),供Prometheus Server抓取。即该模块与prometheus架构图中的Jobs对接,Jobs从/actuator/prometheus通过HTTP PULL抓取监控数据。
现在的pom.xml关键部分如下:
1 2 3 4 5 6 7 8 9 10 11 12 13 14 15 16 17 18 | <dependencies>
<dependency>
<groupId>org.springframework.boot</groupId>
<artifactId>spring-boot-starter</artifactId>
</dependency>
<dependency>
<groupId>org.springframework.boot</groupId>
<artifactId>spring-boot-starter-web</artifactId>
</dependency>
<dependency>
<groupId>org.springframework.boot</groupId>
<artifactId>spring-boot-starter-actuator</artifactId>
</dependency>
<dependency>
<groupId>io.micrometer</groupId>
<artifactId>micrometer-registry-prometheus</artifactId>
</dependency>
</dependencies>
|
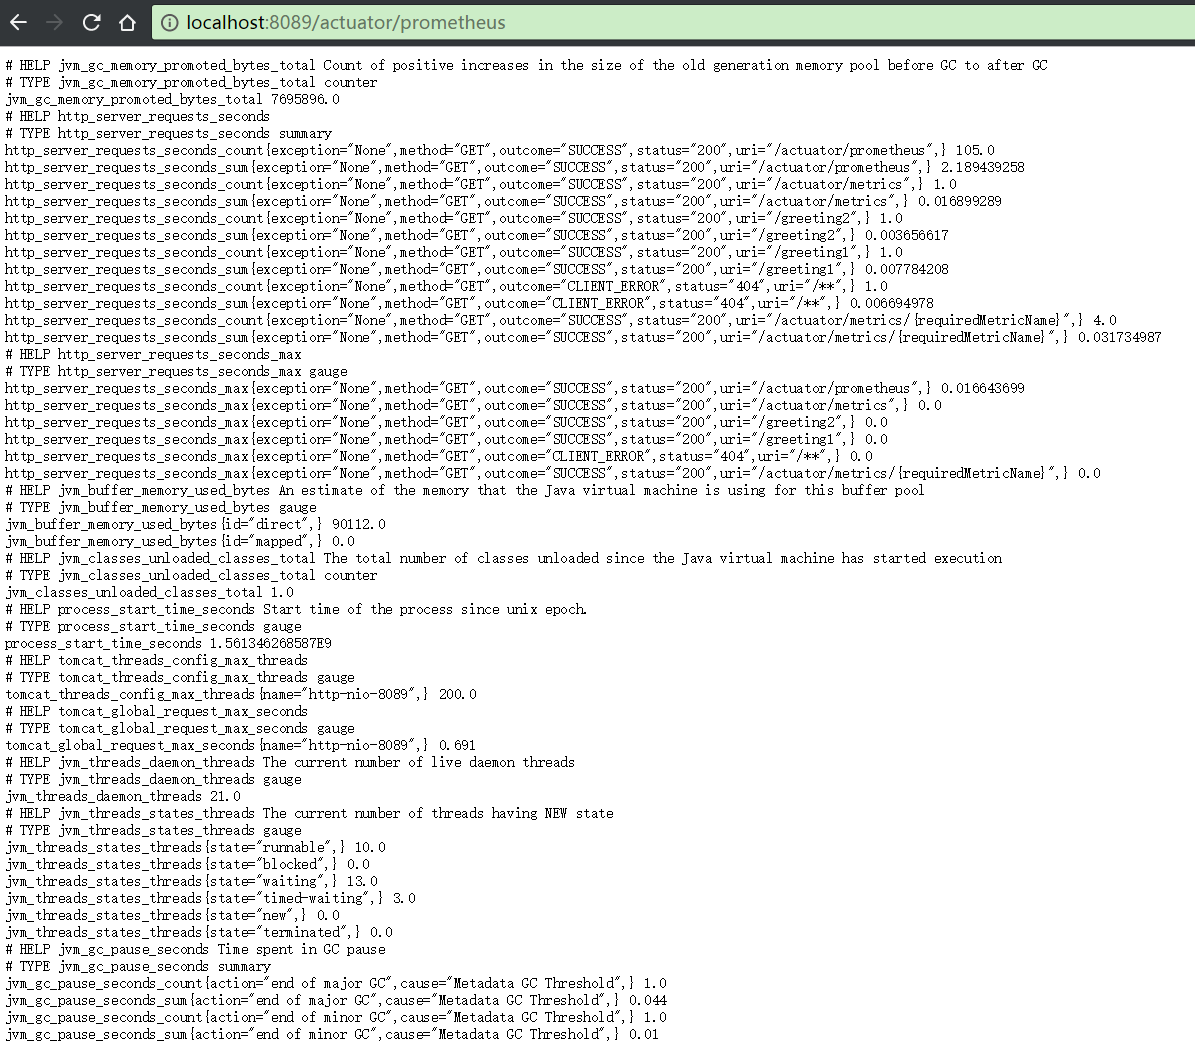
运行该Spring Boot应用(server.port: 8089),访问/actuator/prometheus,可以看到暴露出的Prometheus格式的数据,
如果看不到,可能是该endpoint未暴露,可以在yml中配置management.endpoints.web.exposure.include: "*"
接下来配置Prometheus Server,加入一个job,让它抓取该SpringBoot应用的监控数据。
将prometheus.yml的scape_config改为:
1 2 3 4 5 6 | scrape_configs:
# 加入一个名为myWebApp的抓取任务,抓取目标是localhost:8089,它的指标暴露在/actuator/prometheus
- job_name: 'myWebApp'
metrics_path: '/actuator/prometheus'
static_configs:
- targets: ['localhost:8089']
|
注意,为了方便观察,在上面的配置中,删掉了初始配置文件中的"prometheus"抓取任务。
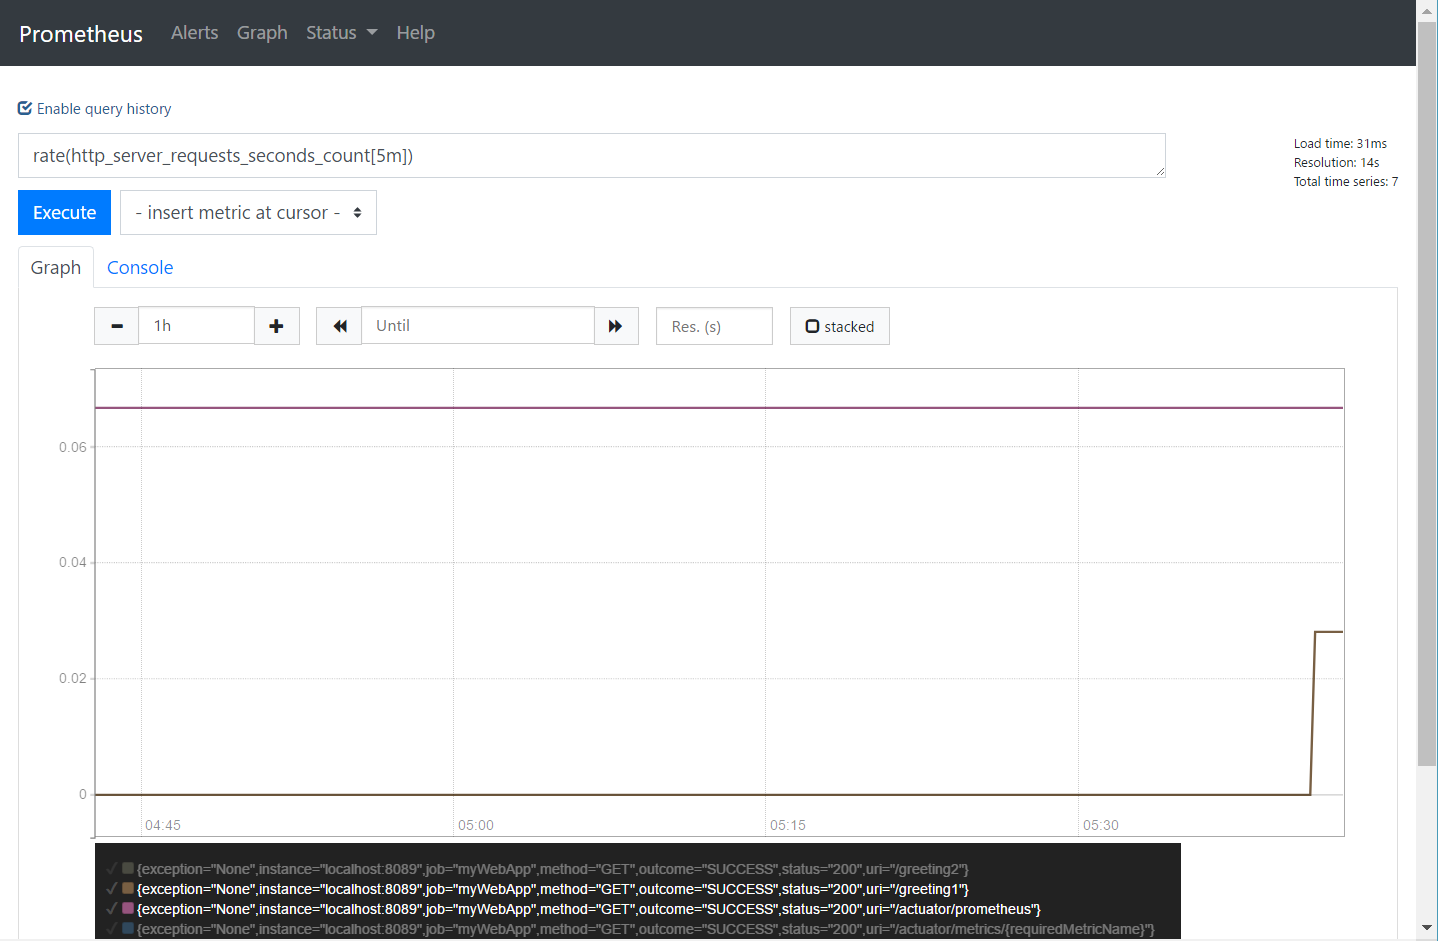
重启Prometheus Server,并查询http_server_requests_seconds_count
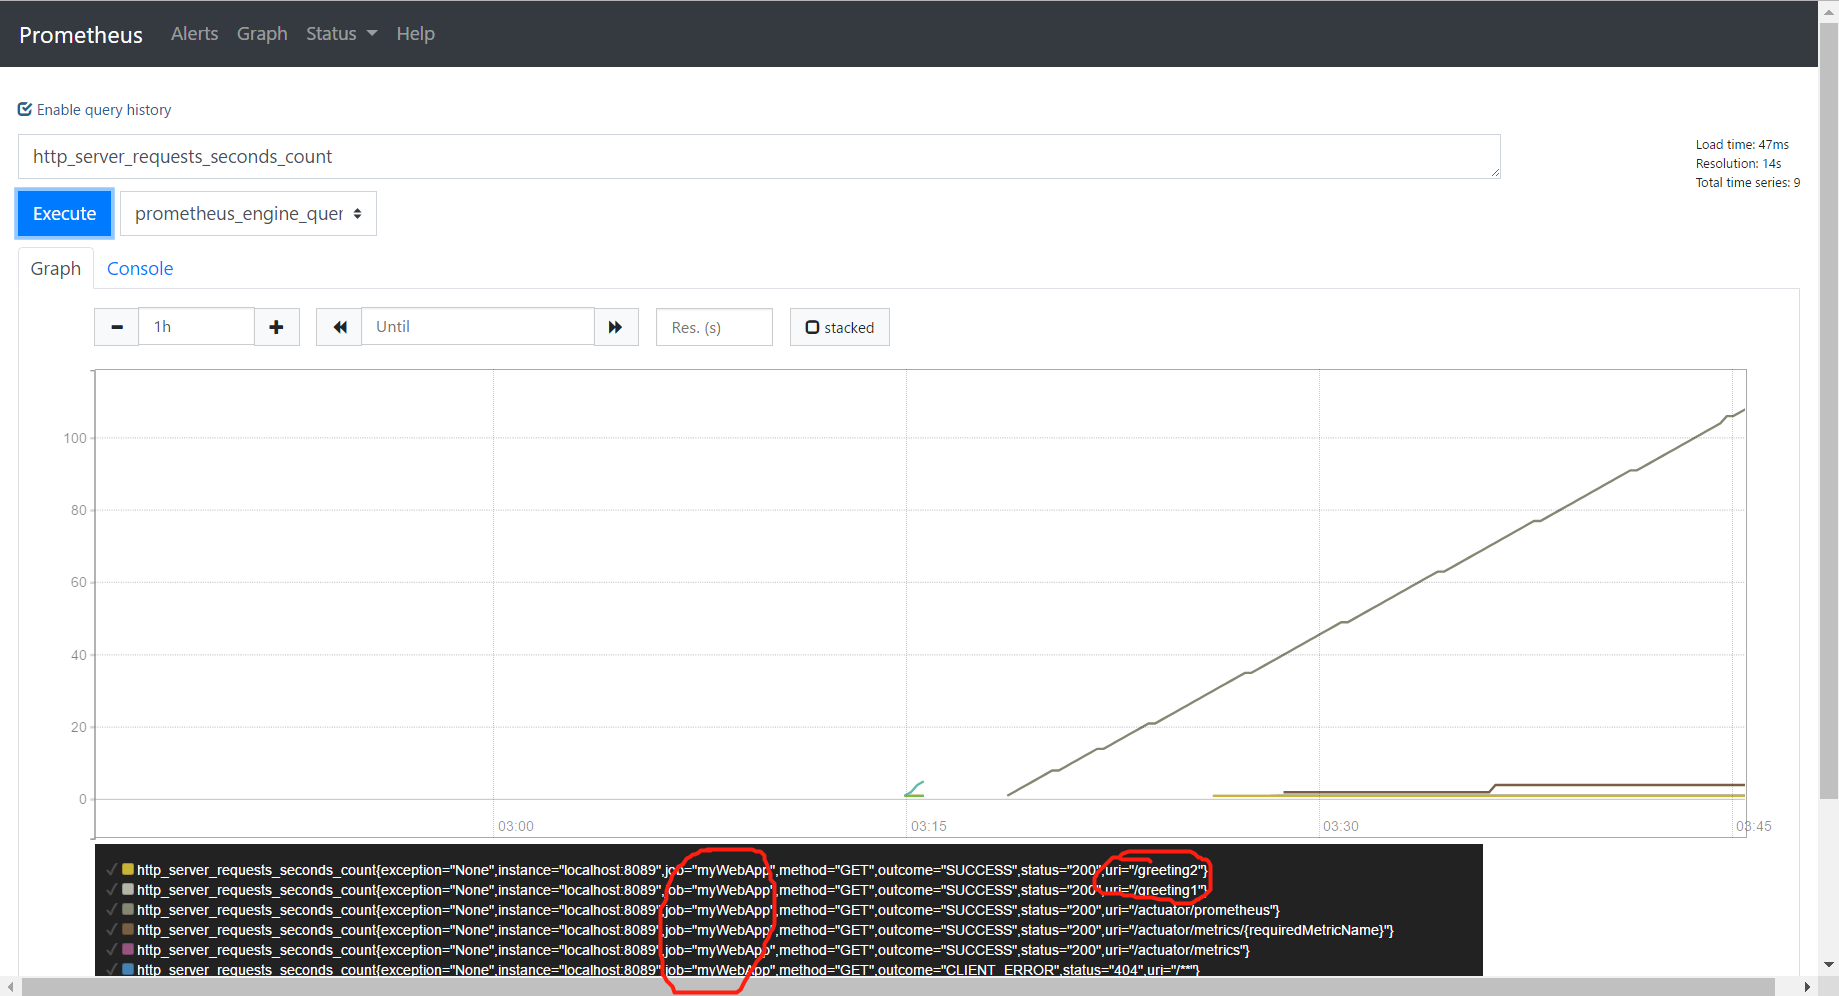
可以查询到请求次数的图标。
但是,我们比较关心的有qps、错误率、延时等,这些指标不在监控的原始数据里,因为prometheus收集的是原始数据。所以必须在查询时通过查询语句进行即时计算。参考:速率计算:Server-side Vs Client-side
比如qps:
rate(http_server_requests_seconds_count[5m])QPS5分钟均值
更多查询实例可参考官方文档之查询实例
小结
Prometheus提供了指标数据手机、监控、计算、报警、展示的功能,但是在UI展示方面还很薄弱,官方也指出,自带的UI界面只是作为特殊查询和调试,对于更加强大的图形界面,还是推荐使用Grafana。
Grafana
Grafana 是一款采用 go 语言编写的开源应用,主要用于大规模指标数据的可视化展现,基于商业友好的 Apache License 2.0 开源协议。 在网络架构和应用分析中最流行的时序数据展示工具,并且也在工业控制、自动化监控和过程管理等领域有着广泛的应用 grafana有热插拔控制面板和可扩展的数据源,已经支持绝大部分常用的时序数据库,包含以下:Graphite、Elasticsearch、CloudWatch、InfluxDB、OpenTSDB、Prometheus
启动
下载、运行也非常简单,根据官方文档一步步做就好了。要注意的是:
Go into the
confdirectory and copysample.initocustom.ini. You should editcustom.ini, neverdefaults.ini.
在windows上运行还需要在 custom.ini中需要修改默认的3000端口,比如9999:
The default Grafana port is
3000, this port requires extra permissions on windows. Editcustom.iniand uncomment thehttp_portconfiguration option (;is the comment character in ini files) and change it to something like8080or similar. That port should not require extra Windows privileges.
启动Grafana。(windows下直接运行bin目录的grafana-server.exe)
访问localhost:9999,默认用户名密码都是admin
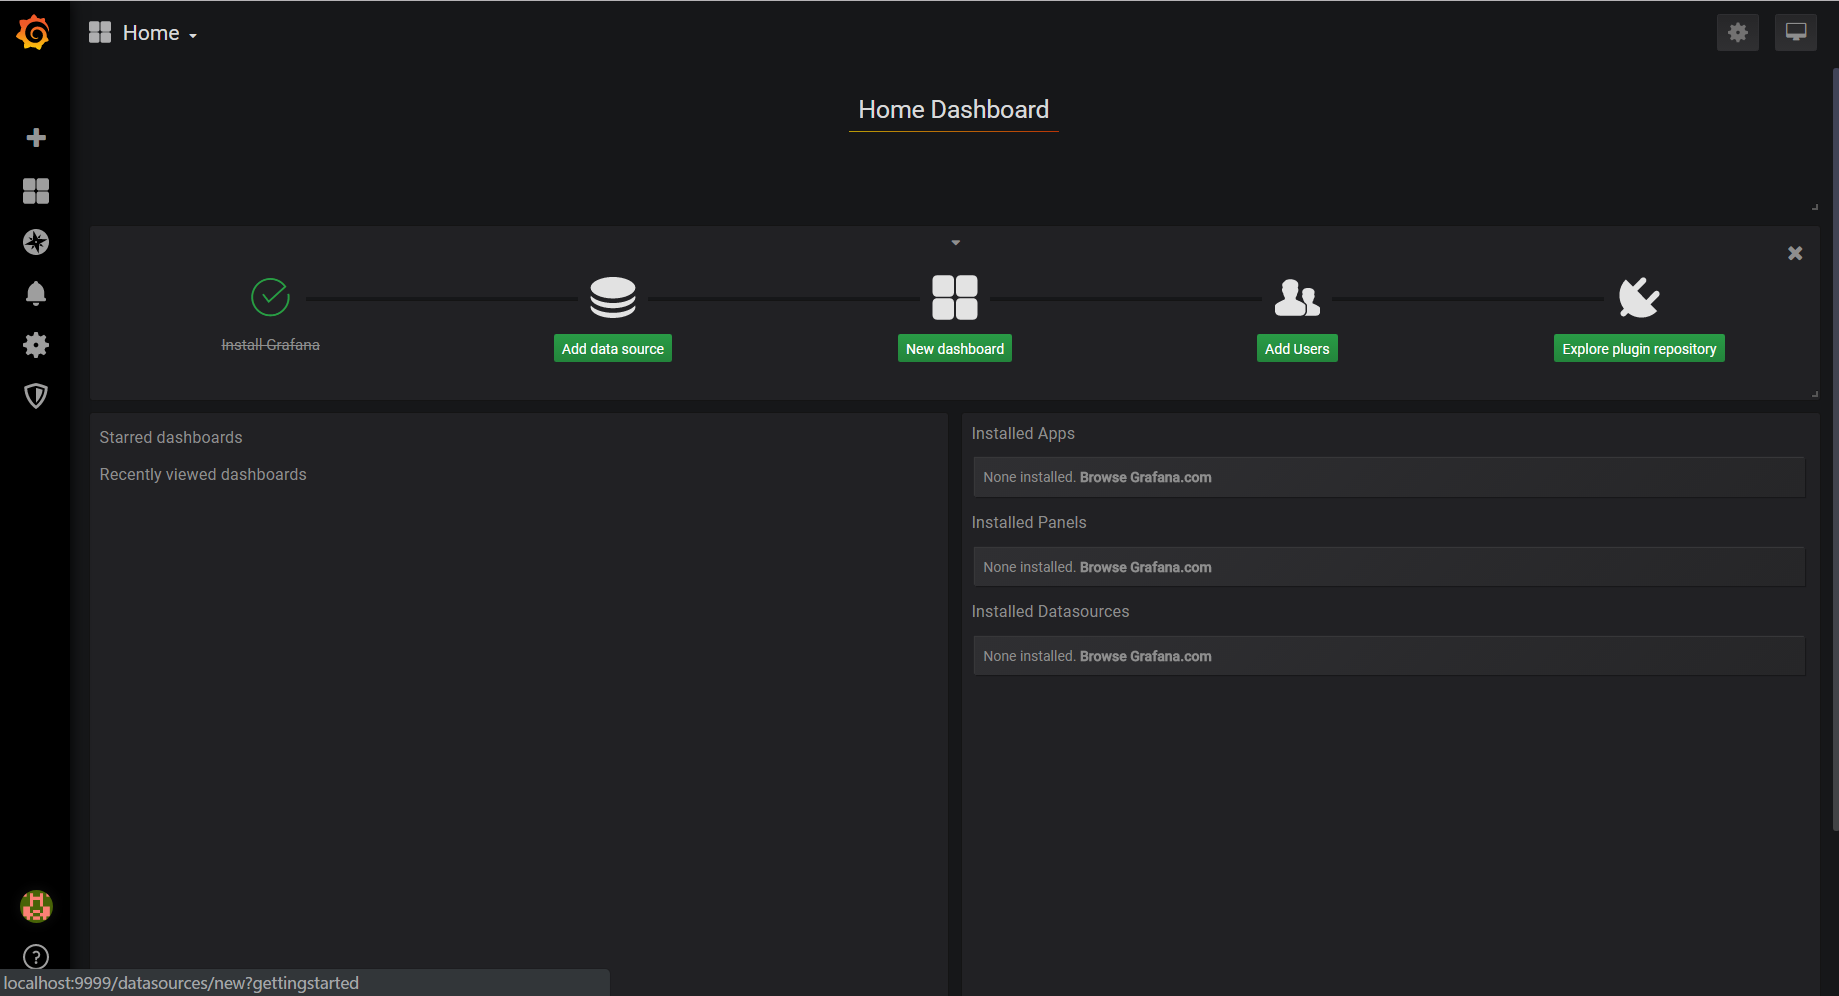
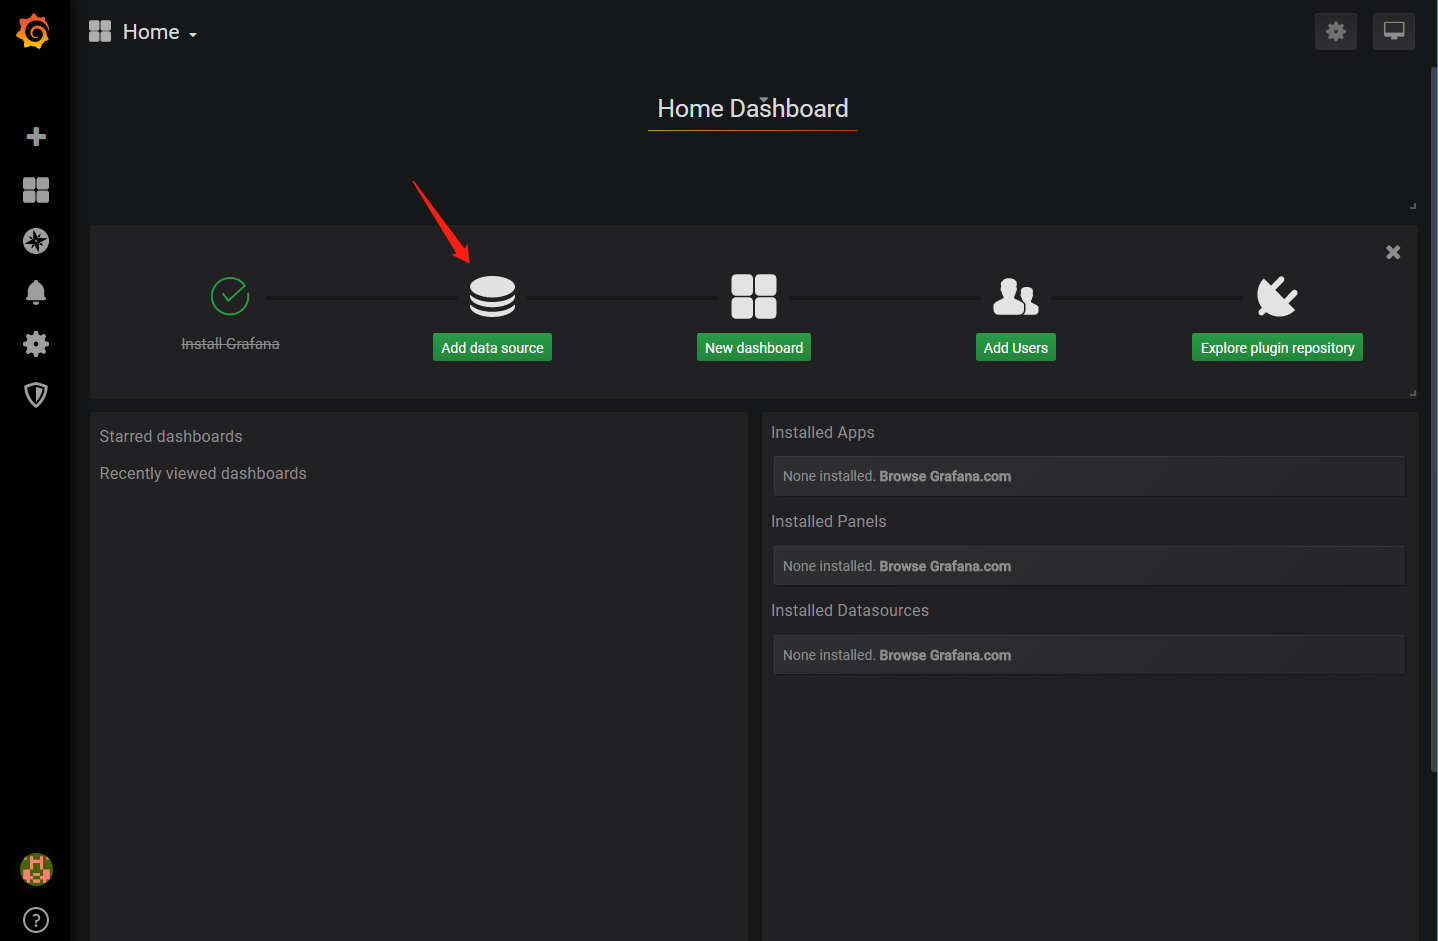
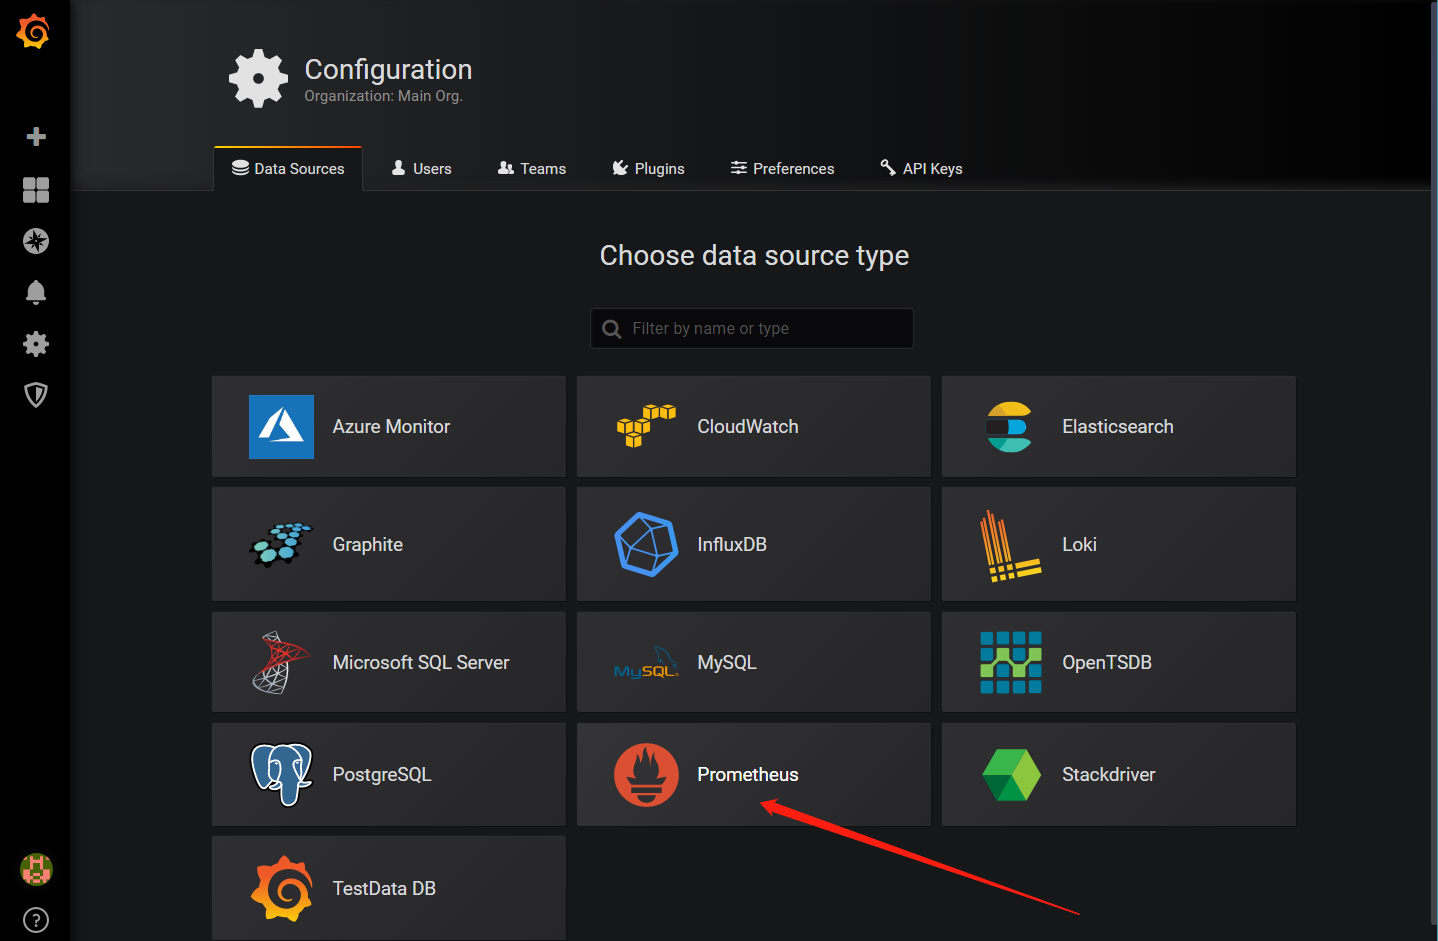
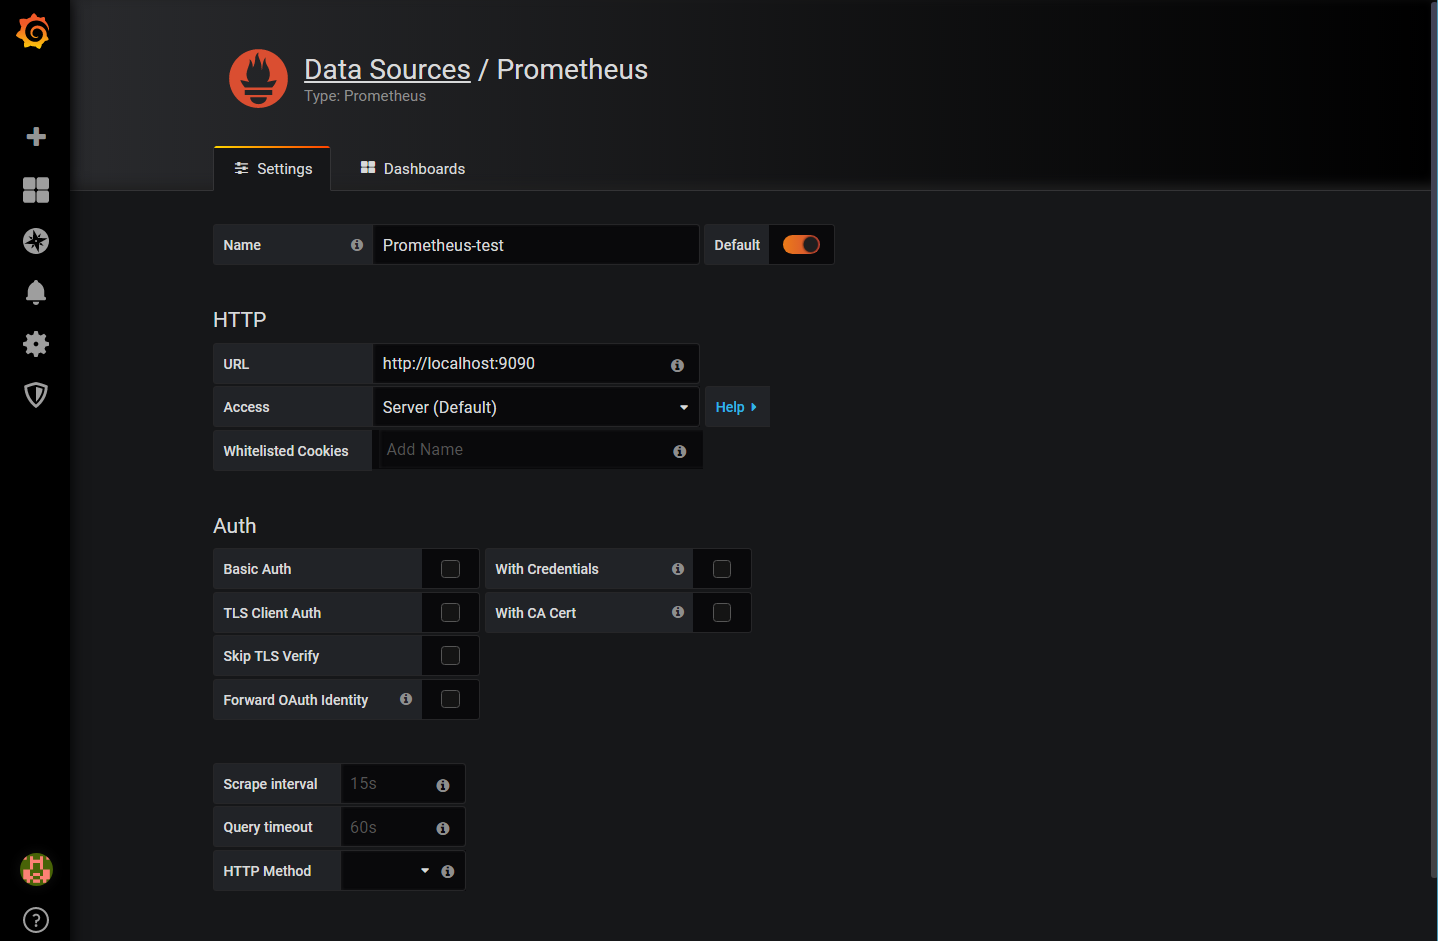
加入Prometheus数据源
配置Prometheus相关信息
加入DashBoard
可以加入一些预定义的DashBoard,这些DashBoard中配置了许多常用的监控图表,并且已经配置好了对应的查询语句,所以我们可以直接用这些DashBoard就可以查看监控了。
在https://grafana.com/dashboards中查找SpringBoot对应的DashBoard
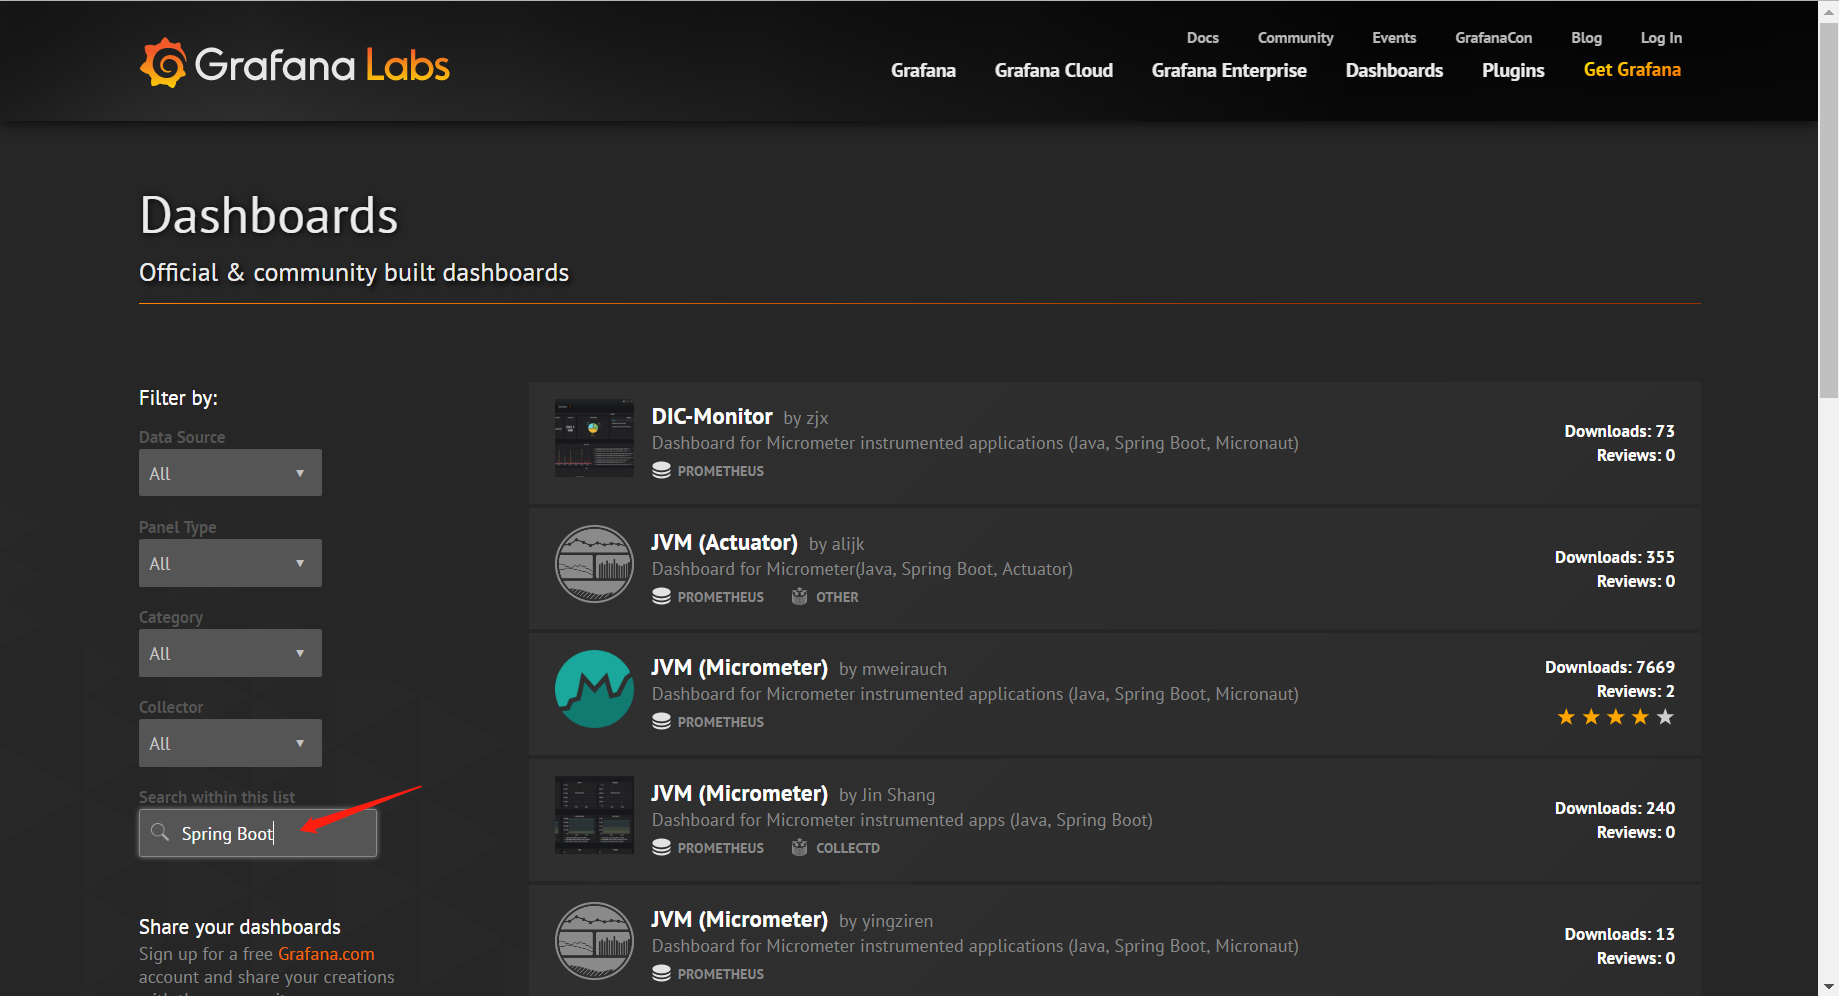
比如:https://grafana.com/dashboards/10280
拷贝DashBoard的Id:10280,在自己的Grafana中加入该DashBoard:


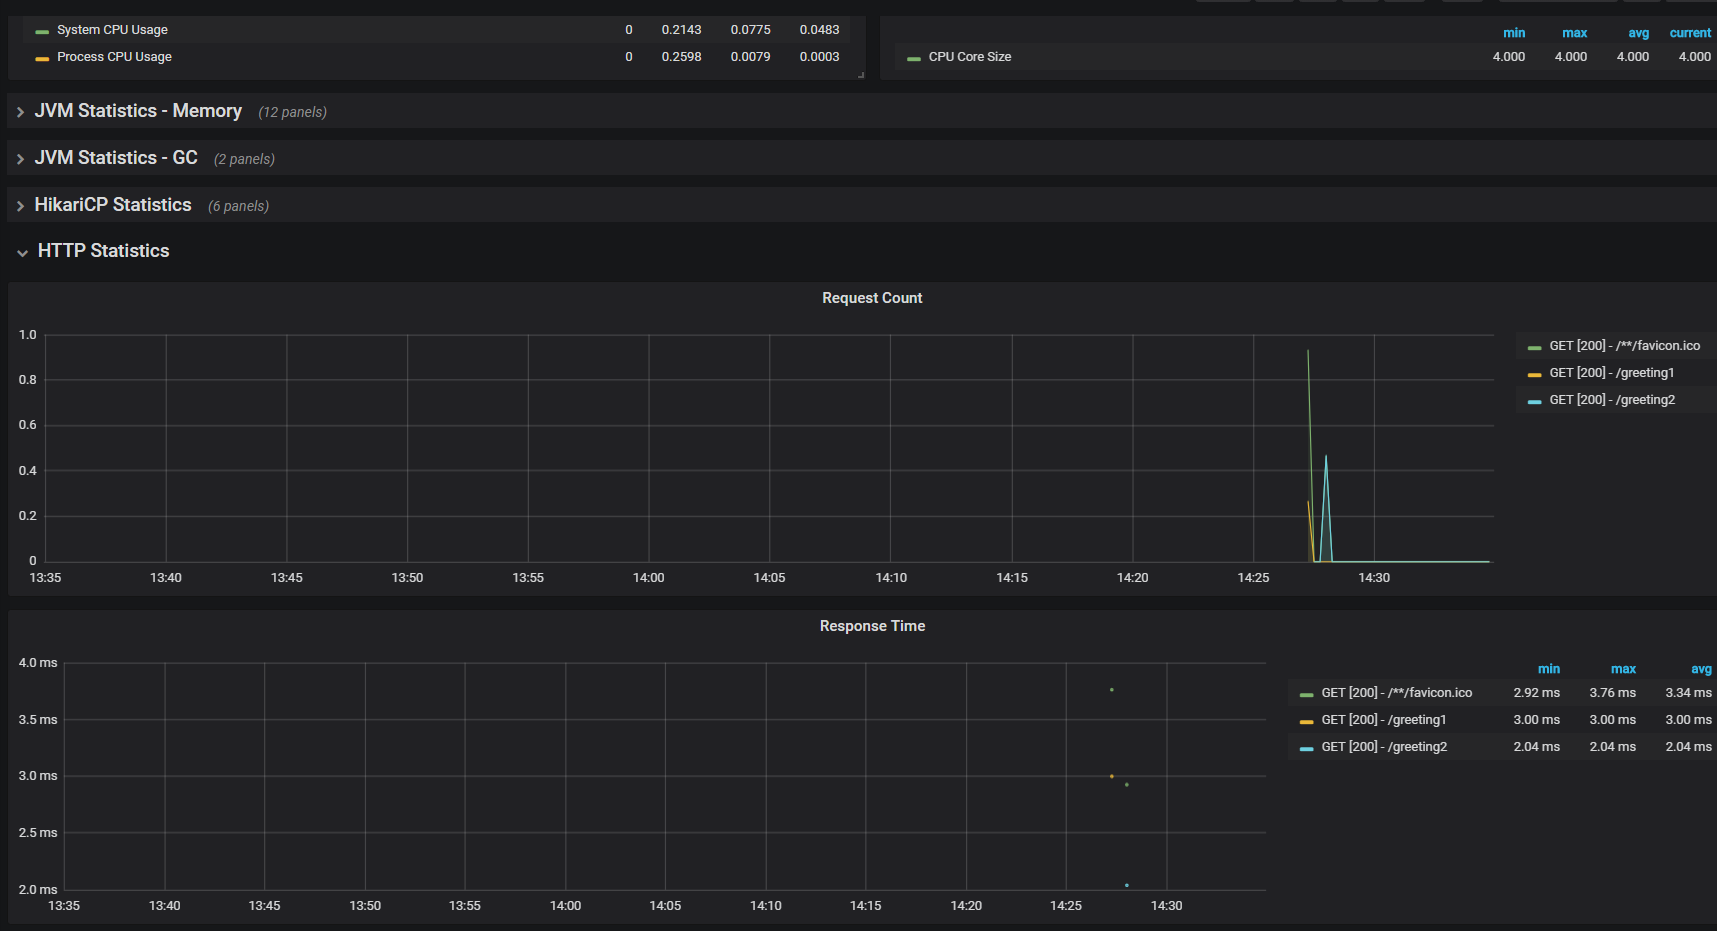
如果配置好DashBorad后,仍没有监控数据,则需要自己看下加入的dashboard的使用帮助,如刚才加入的dashborad中,有这样一则说明: 
需要按照要求配置application。
点击某个图表的表头,可以对该图图表进行编辑。  可以看到已经预制好的查询语句:
报警
支持多种形式的报警发送,如邮件、Kafka、钉钉等。关于报警的配置,本文不在过多演示,可以查看官方文档。
需要注意的是:报警只支持到单图表,无法嵌套模板变量。如图标编辑界面左上角有筛选node的下拉框,图表又传入了变量时,如果配置报警,是配置失败的。报错为:“Template variables are not supported in alert queries”。

官方的解释为:他们找不到一个好的办法来解决歧义性。https://github.com/grafana/grafana/issues/7060
所以想要报警,必须先创建一个不含模板变量的图表,然后针对该图表进行报警配置。
参考资料
baeldung.com/spring-boot-actuators
https://www.jianshu.com/p/82abd86ef447
https://blog.51cto.com/youerning/2050543


 3万+
3万+

 被折叠的 条评论
为什么被折叠?
被折叠的 条评论
为什么被折叠?
 到【灌水乐园】发言


