


收藏的好文章
| 好文收藏 | 来源(公众号或者作者) | 地址 | 日期 |
|---|---|---|---|
| 一些长时间GC停顿问题的排查及解决办法 | 占小狼 | https://mp.weixin.qq.com/s/fP–JJnkTR92NWdZtdEgqQ | 2019-3-25 |
| 系统运行缓慢,CPU 100%,以及Full GC次数过多问题的排查思路 | 芋道源码 | https://mp.weixin.qq.com/s/_tWm2G57vLgomvpNNHKAMA | 2019-3-1 |
| 分享一次 Java 内存泄漏的排查 | Java基基 | https://mp.weixin.qq.com/s/M02Qk5OQ13xRytTK97SaFw | 2019-3-14 |
| 并发环境下HashMap引起full gc排查 | 李小武 | http://blog.lichengwu.cn/java/2015/04/06/case-of-hashmap-in-concurrency/ | 2015-4-6 |
| Metaspace 引起的 FullGC 问题排查过程及解决方案 | 程序猿DD | https://mp.weixin.qq.com/s/rkTDMFkvBDZzT2fUfOjV_Q | 2019-6-14 |
| 从一起GC血案谈到反射原理 | 假笨说 | https://mp.weixin.qq.com/s/5H6UHcP6kvR2X5hTj_SBjA? | 2017-01-12 |
| 深入理解Java虚拟机:(十六) Java虚拟机的性能监控及诊断工具 | 老周聊架构 | https://riemann.blog.csdn.net/article/details/104157865 | 2020-2-2 |
一些常用命令
1.查看自己服务的进程id (pid)
ps -ef | grep java 或者 jps
2.查看是否有full gc *(5000ms打印一次,也可以去掉这个参数)
jstat -gcutil (pid)5000
  S0     S1     E      O      M     CCS    YGC     YGCT    FGC    FGCT     GCT
  0.00 100.00  48.36  10.55  98.24  95.95     30    2.205     0    0.000    2.205
  0.00 100.00  70.42  10.55  98.24  95.95     30    2.205     0    0.000    2.205
3.查看堆内存使用状况
jmap -heap (pid)
jmap -heap 59191
Debugger attached successfully.
Server compiler detected.
JVM version is 25.45-b02

using thread-local object allocation.
Garbage-First (G1) GC with 2 thread(s)

Heap Configuration:
   MinHeapFreeRatio         = 40
   MaxHeapFreeRatio         = 70
   MaxHeapSize              = 4194304000 (4000.0MB)
   NewSize                  = 1363144 (1.2999954223632812MB)
   MaxNewSize               = 2516582400 (2400.0MB)
   OldSize                  = 5452592 (5.1999969482421875MB)
   NewRatio                 = 2
   SurvivorRatio            = 8
   MetaspaceSize            = 21807104 (20.796875MB)
   CompressedClassSpaceSize = 1073741824 (1024.0MB)
   MaxMetaspaceSize         = 17592186044415 MB
   G1HeapRegionSize         = 1048576 (1.0MB)

Heap Usage:
G1 Heap:
   regions  = 4000
   capacity = 4194304000 (4000.0MB)
   used     = 556760056 (530.9677658081055MB)
   free     = 3637543944 (3469.0322341918945MB)
   13.274194145202637% used
G1 Young Generation:
Eden Space:
   regions  = 485
   capacity = 673185792 (642.0MB)
   used     = 508559360 (485.0MB)
   free     = 164626432 (157.0MB)
   75.54517133956386% used
Survivor Space:
   regions  = 3
   capacity = 3145728 (3.0MB)
   used     = 3145728 (3.0MB)
   free     = 0 (0.0MB)
   100.0% used
G1 Old Generation:
   regions  = 44
   capacity = 397410304 (379.0MB)
   used     = 45054968 (42.96776580810547MB)
   free     = 352355336 (336.03223419189453MB)
   11.337141374170308% used
4.现场保留
保留histo内存快照;jmap -histo (pid) > histo.log
JVM线程信息保存: jstack (pid) > stack.log
保存jvm堆内存快照 jmap -dump:live,format=b,file=heap.bin <pid>
其他
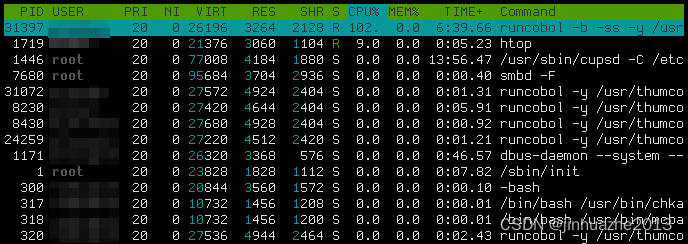
Here is a list that explains what each column means.
PID: A process’s process ID number.
USER: The process’s owner.
PR: The process’s priority. The lower the number, the higher the priority.
NI: The nice value of the process, which affects its priority.
VIRT: How much virtual memory the process is using.
RES: How much physical RAM the process is using, measured in kilobytes.
SHR: How much shared memory the process is using.
S: The current status of the process (zombied, sleeping, running, uninterruptedly sleeping, or traced).
%CPU: The percentage of the processor time used by the process.
%MEM: The percentage of physical RAM used by the process.
TIME+: How much processor time the process has used.
COMMAND: The name of the command that started the process.
top -Hp (pid)
可以查看到当前进程的每个线程占用的cpu
参考https://www.deonsworld.co.za/2012/12/20/understanding-and-using-htop-monitor-system-resources/


 1340
1340


 被折叠的 条评论
为什么被折叠?
被折叠的 条评论
为什么被折叠?
 到【灌水乐园】发言


