


前言
地图上添加Echarts图表,其实就是将一个Echarts图表的容器放到地图上,然后监听地图的事件更新Echarts容器的大小及屏幕坐标。
为了可以复用方便,我决定将地图上添加Echarts图表封装成一个service。
结构
参数说明
- mapView:由于需要将地图坐标转化为屏幕坐标,所以需要toScreen去完成,因此需要将地图的view传进Class里面,这里需要将传入的地图view保存到一个全局参数mapView。
- mapDom:由于添加Echats的原理就是添加容器到地图,所以就是将容器添加到地图的DOM对象里面,所以这个需要传入地图的DOM对象。
- events:需要监听地图的事件。
- mapZoom:地图的缩放zoom。
- chartConfigList:绘制Echarts图表需要的配置信息。
生成图表配置说明
| 属性 | 说明 | 类型 | 默认值 |
| x | 地图坐标里面的经度(longitude) | number | - |
| y | 地图坐标里面的纬度(latitude) | number | - |
| width | Echarts图表容器的宽 | number | 0 |
| height | Echarts图表容器的高 | number | 0 |
| id | Echarts容器的DOM的id | string | - |
| echartsObj | 存放生成的Echarts的图表对象 | Object | null |
| option | 用于生成Echarts图表的配置参数 | Object | null |
    // 配置模板
    const chartConfig_template = {
      x: 102, // 图表在地图上绘制的位置
      y: 24,
      width: 15,
      height: 15,
      id: 'chartDiv',
      echartsObj: null,
      option: {
        tooltip: {
          trigger: 'item',
        },
        legend: {
          show: false,
        },
        series: [
          {
            name: title,
            type: 'pie',
            radius: ['40%', '70%'],
            avoidLabelOverlap: false,
            label: {
              show: false,
            },
            emphasis: {
              label: {
                show: false,
              },
            },
            labelLine: {
              show: false,
            },
            data: [
              {
                value: percent,
                name: '完成百分比(%)',
                itemStyle: { color: 'green' },
              },
              {
                value: unfinishedPercent,
                name: '未完成百分比(%)',
                itemStyle: { color: this.colors.white },
              },
            ],
          },
        ],
      },
    };
函数说明
- 构造函数
constructor(mapView, mapDom) {
        super();
        this.mapView = mapView;
        this.mapDom = mapDom;

        if (this.mapView) {
            this.mapView.when(() => {
                this.setListenEvents();
            });
        }
    }
- 监听添加
setListenEvents() {
        // 监听地图变化事件,刷新统计图位置
        this.mapView.watch('extent', () => {
            this.toScreenAllCharts();
        });
    }
- 生成Echarts对象
 // 生成chart对象
    generateChartObject(chartConfig) {
        $(this.mapDom)
            .append(`<div id="${chartConfig.id}" class="chartDiv" style="height:${chartConfig.height || 0}px;width:${chartConfig.width || 0}px;position:absolute;"></div>`); // 往mapview追加存放图表的DOM元素

        const dom = document.getElementById(chartConfig.id); // 绘制图表
        const myChart = echarts.init(dom);
        myChart.setOption(chartConfig.option);

        return myChart;
    }
- 实现Echarts图表根据地图缩放/移动而缩放/移动
// 调整图表位置及大小函数
    resizeChart(chartConfig) {
        const chartJqueryObject = $(`#${chartConfig.id}`);
        chartJqueryObject.css('transform', `translate3d(${chartConfig.x}px, ${chartConfig.y}px, 0)`);

        const { zoom } = this.mapView;
        if (this.mapZoom !== zoom) {
            this.mapZoom = zoom;
            if (chartConfig?.chartObj) {
                chartConfig.chartObj.resize({
                    height: zoom * chartConfig.height,
                    width: zoom * chartConfig.width,
                });
            }
        }
    }
- 根据传入的配置文件生成相应的EchartsObject并且转换地图坐标为屏幕坐标
    // 刷新所有的chart到地图上
    toScreenAllCharts(chartConfigList = this.chartConfigList) {
        chartConfigList.forEach((chartConfig) => {
            const {
                x,
                y,
                chartObj,
            } = chartConfig;
            // 坐标转换
            const mapPoint: any = {
                x,
                y,
                spatialReference: this.mapView.spatialReference,
            };
            const screenPoint = this.mapView.toScreen(mapPoint);

            if (!chartObj) {
                chartConfig.chartObj = this.generateChartObject(chartConfig);
            }

            this.resizeChart({
                ...chartConfig,
                x: screenPoint.x,
                y: screenPoint.y,
            });
        });
    }
- 清空所有的Echarts图表
// 清空所有的charts
    clearAllCharts() {
        this.mapZoom = undefined;
        $(this.mapDom)
            .children('.chartDiv')
            .remove();
    }
- 注销当前服务
// 销毁当前服务
    destroy() {
        this.events.forEach((event) => {
            event.remove();
        });
        this.events = [];

        this.clearAllCharts();
    }
完整的ChartsService.ts的代码
import { Vue } from 'vue-property-decorator';
import $ from 'jquery';
import * as echarts from 'echarts';
import MapView from '@c_arcgis/core/views/MapView';
import SceneView from '@c_arcgis/core/views/SceneView';

export class ChartsService extends Vue {
    mapView: MapView | SceneView;

    mapDom;

    chartConfigList = [];

    mapZoom;

    // 所以事件
    events = [];

    constructor(mapView, mapDom) {
        super();
        this.mapView = mapView;
        this.mapDom = mapDom;

        if (this.mapView) {
            this.mapView.when(() => {
                this.setListenEvents();
            });
        }
    }

    setListenEvents() {
        // 监听地图变化事件,刷新统计图位置
        this.mapView.watch('extent', () => {
            this.toScreenAllCharts();
        });
    }

    // 生成所有chart的配置文件
    generateChartConfigList(chartConfigList = []) {
        this.clearAllCharts();

        this.chartConfigList = [...chartConfigList];
        this.toScreenAllCharts();
    }

    // 生成chart对象
    generateChartObject(chartConfig) {
        $(this.mapDom)
            .append(`<div id="${chartConfig.id}" class="chartDiv" style="height:${chartConfig.height || 0}px;width:${chartConfig.width || 0}px;position:absolute;"></div>`); // 往mapview追加存放图表的DOM元素

        const dom = document.getElementById(chartConfig.id); // 绘制图表
        const myChart = echarts.init(dom);
        myChart.setOption(chartConfig.option);

        return myChart;
    }

    // 调整图表位置及大小函数
    resizeChart(chartConfig) {
        const chartJqueryObject = $(`#${chartConfig.id}`);
        chartJqueryObject.css('transform', `translate3d(${chartConfig.x}px, ${chartConfig.y}px, 0)`);

        const { zoom } = this.mapView;
        if (this.mapZoom !== zoom) {
            this.mapZoom = zoom;
            if (chartConfig?.chartObj) {
                chartConfig.chartObj.resize({
                    height: zoom * chartConfig.height,
                    width: zoom * chartConfig.width,
                });
            }
        }
    }

    // 刷新所有的chart到地图上
    toScreenAllCharts(chartConfigList = this.chartConfigList) {
        chartConfigList.forEach((chartConfig) => {
            const {
                x,
                y,
                chartObj,
            } = chartConfig;
            // 坐标转换
            const mapPoint: any = {
                x,
                y,
                spatialReference: this.mapView.spatialReference,
            };
            const screenPoint = this.mapView.toScreen(mapPoint);

            if (!chartObj) {
                chartConfig.chartObj = this.generateChartObject(chartConfig);
            }

            this.resizeChart({
                ...chartConfig,
                x: screenPoint.x,
                y: screenPoint.y,
            });
        });
    }

    // 清空所有的charts
    clearAllCharts() {
        this.mapZoom = undefined;
        $(this.mapDom)
            .children('.chartDiv')
            .remove();
    }

    // 销毁当前服务
    destroy() {
        this.events.forEach((event) => {
            event.remove();
        });
        this.events = [];

        this.clearAllCharts();
    }
}
使用
  mounted() {
    this.$nextTick(() => {
      const { mainMap }: any = this.$refs;
      if (mainMap.activeView) {
        this.chartsServices = new ChartsService(mainMap.activeView, mainMap.$el);
        this.chartsServices.generateChartConfigList([chartConfig_template]);
      }
    });
  }
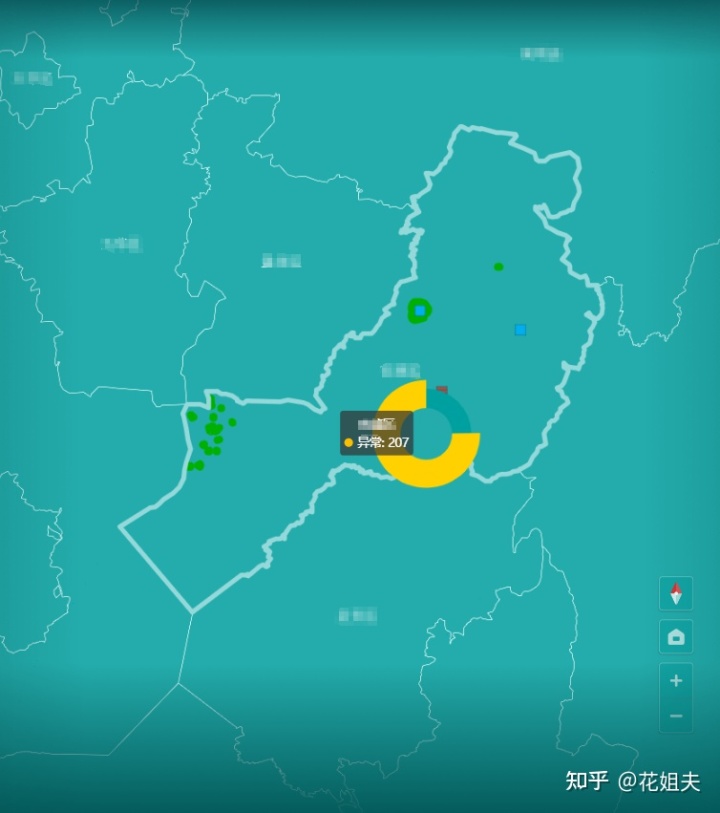
效果
直接npm安装使用就行
npm i arcgis-echarts-services
本文参考:
01 【ArcGIS JS API + eCharts系列】实现地图上二维图表的绘制


 1万+
1万+


 被折叠的 条评论
为什么被折叠?
被折叠的 条评论
为什么被折叠?
 到【灌水乐园】发言


