


 本文介绍了在服务端生成等值面的两种方法,包括基于Java+Geotools+wContour的处理和前端插值处理。通过示例展示了如何使用Java和相关库在服务端生成锦州市某日降雨量的等值面图,并讨论了两种方法的适用场景。同时,提供了代码实现和实际效果对比。
1 引 言
展示雨量数据的分布情况,等值面图是非常合适的方法。以锦州市某日的降雨量为例,雨量站点大概有100个,分布于整个锦州市。首先尝试的方法是利用kriging.js生成等值面,但是由于锦州市边界区域太大,浏览器客户端生成压力非常大,速度也很慢。所以尝试着在服务端生成,然后客户端调用显示。
2 等值面生成的两种方式
2.1 服务端生成
通用的方式是基于Java + Geotools + wContour在服务端处理数据,适用业务如下:
- 大范围高密度的空间数据插值
- 服务器端可以设置定时任务,流水线处理原始数据,生成目标数据(图片或者GeoJSON数据)
2.2 客户端生成
通用的方式是前端插值处理数据,生成网格数据,再进行等值线或等值面的生成,适用业务如下:
- 数据更新频率高,实时性强
- 按需服务,减轻服务器压力
可以使用如下方式:
- 使用turf.js内置函数通过离散点插值、等值面绘制、裁剪,生成矢量数据然后绘制数据
- 使用kriging.js内置的函数,离散点生成网格数据然后网格渲染
- 结合turf.js和kriging.js两者的优点,提升交互性能、插值效果和显示效果
3 基于Java + Geotools + wContour在服务端处理数据
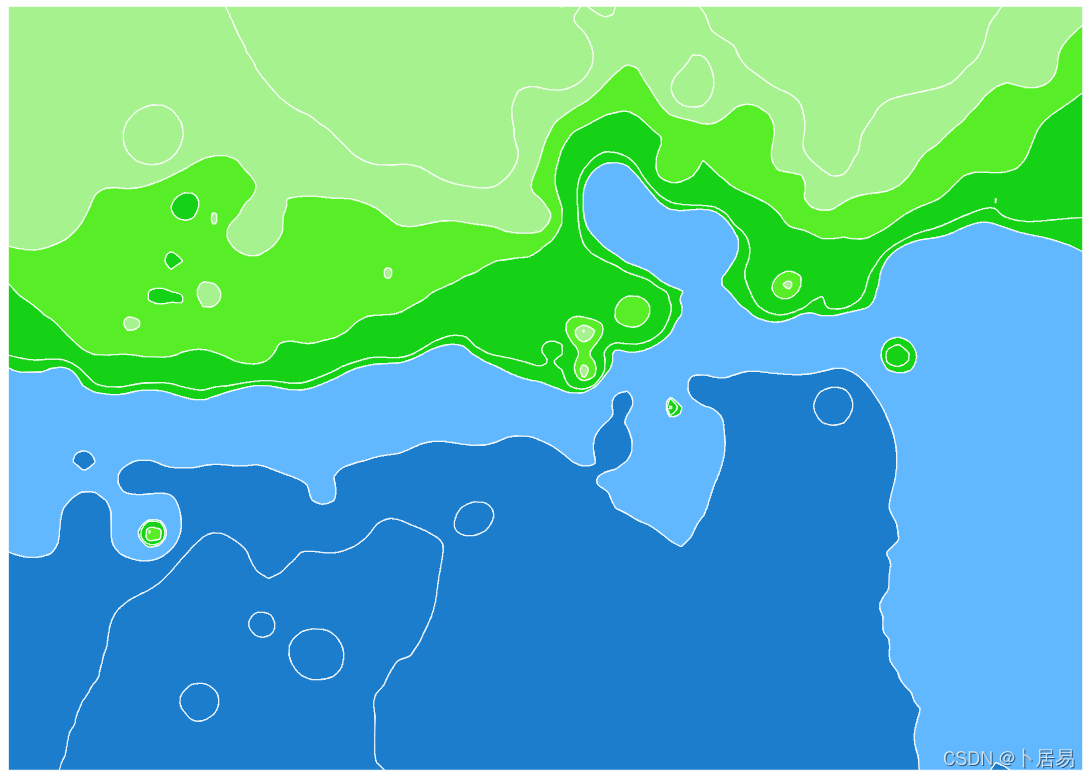
生成结果图1(边界不裁剪):
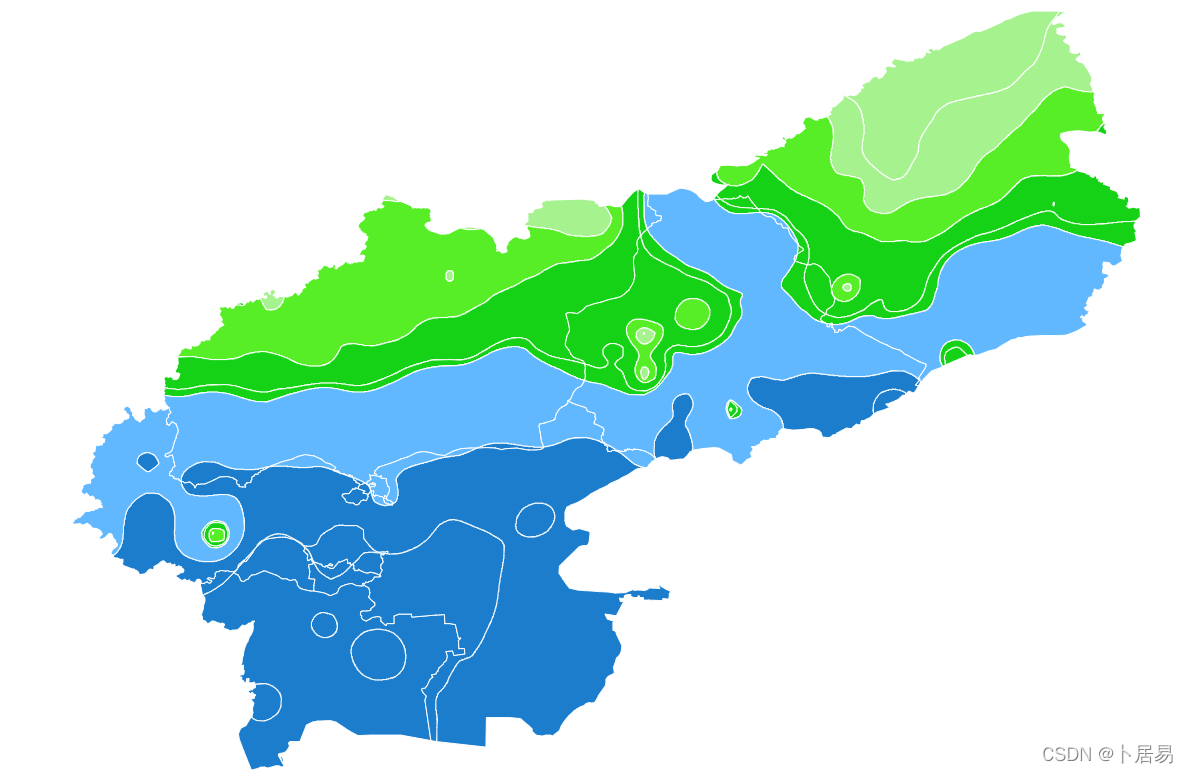
生成结果图2(边界裁剪):
完整代码:
package com.example.demo.meteoInfoTest;

import cn.hutool.json.JSONArray;
import com.tt.CommonMethod;
import com.tt.GeoJSONUtil;
import org.geotools.data.DataUtilities;
import org.geotools.data.collection.ListFeatureCollection;
import org.geotools.data.shapefile.ShapefileDataStore;
import org.geotools.data.simple.SimpleFeatureCollection;
import org.geotools.data.simple.SimpleFeatureIterator;
import org.geotools.data.simple.SimpleFeatureSource;
import org.geotools.feature.FeatureCollection;
import org.geotools.feature.FeatureIterator;
import org.geotools.feature.SchemaException;
import org.geotools.feature.simple.SimpleFeatureBuilder;
import org.geotools.geojson.feature.FeatureJSON;
import org.json.simple.JSONObject;
import org.locationtech.jts.geom.Geometry;
import org.opengis.feature.simple.SimpleFeature;

import org.opengis.feature.simple.SimpleFeatureType;
import wcontour.Contour;
import wcontour.Interpolate;
import wcontour.global.Border;
import wcontour.global.PointD;
import wcontour.global.PolyLine;
import wcontour.global.Polygon;

import java.io.File;
import java.io.IOException;
import java.io.StringWriter;
import java.nio.charset.Charset;
import java.util.*;

public class EquiSurface {
    /**
     * 生成等值面
     *
     * @param trainData    训练数据
     * @param dataInterval 数据间隔
     * @param size         大小,宽,高
     * @param boundryFile  四至
     * @param isclip       是否裁剪
     * @return
     */
    public String calEquiSurface(double[][] trainData,
                                 double[] dataInterval,
                                 int[] size,
                                 String boundryFile,
                                 boolean isclip) {
        String geojsonpogylon = "";
        try {
            double _undefData = -9999.0;
            SimpleFeatureCollection polygonCollection = null;
            List<PolyLine> cPolylineList = new ArrayList<PolyLine>();
            List<Polygon> cPolygonList = new ArrayList<Polygon>();

            int width = size[0],
                    height = size[1];
            double[] _X = new double[width];
            double[] _Y = new double[height];

            File file = new File(boundryFile);
            ShapefileDataStore shpDataStore = null;

            shpDataStore = new ShapefileDataStore(file.toURL());
            //设置编码
            Charset charset = Charset.forName("GBK");
            shpDataStore.setCharset(charset);
            String typeName = shpDataStore.getTypeNames()[0];
            SimpleFeatureSource featureSource = null;
            featureSource = shpDataStore.getFeatureSource(typeName);
            SimpleFeatureCollection fc = featureSource.getFeatures();

            double minX = fc.getBounds().getMinX();
            double minY = fc.getBounds().getMinY();
            double maxX = fc.getBounds().getMaxX();
            double maxY = fc.getBounds().getMaxY();

            Interpolate.createGridXY_Num(minX, minY, maxX, maxY, _X, _Y);

            double[][] _gridData = new double[width][height];

            int nc = dataInterval.length;

            _gridData = Interpolate.interpolation_IDW_Neighbor(trainData,
                    _X, _Y, 12, _undefData);// IDW插值
            int[][] S1 = new int[_gridData.length][_gridData[0].length];
            List<Border> _borders = Contour.tracingBorders(_gridData, _X, _Y,
                    S1, _undefData);

            cPolylineList = Contour.tracingContourLines(_gridData, _X, _Y, nc,
                    dataInterval, _undefData, _borders, S1);// 生成等值线

            cPolylineList = Contour.smoothLines(cPolylineList);// 平滑

            cPolygonList = Contour.tracingPolygons(_gridData, cPolylineList,
                    _borders, dataInterval);

            geojsonpogylon = getPolygonGeoJson(cPolygonList);

            if (isclip) {
                polygonCollection = GeoJSONUtil.readGeoJsonByString(geojsonpogylon);
                SimpleFeatureCollection sm = clipPolygonFeatureCollection(fc, polygonCollection);
                FeatureCollection featureCollection = sm;
                FeatureJSON featureJSON = new FeatureJSON();
                StringWriter writer = new StringWriter();
                featureJSON.writeFeatureCollection(featureCollection, writer);
                geojsonpogylon = writer.toString();
            }
        } catch (Exception e) {
            e.printStackTrace();
        }
        return geojsonpogylon;
    }

    /**
     * 裁剪图形
     * @param fc
     * @return
     */
    private SimpleFeatureCollection clipPolygonFeatureCollection(FeatureCollection fc,
                                                                 SimpleFeatureCollection gs) throws SchemaException, IOException {
        SimpleFeatureCollection simpleFeatureCollection = null;
        SimpleFeatureType TYPE = DataUtilities.createType("polygons",
                "the_geom:MultiPolygon,lvalue:double,hvalue:double");
        List<SimpleFeature> list = new ArrayList<>();
        SimpleFeatureIterator contourFeatureIterator = gs.features();
        FeatureIterator dataFeatureIterator = fc.features();
        while (dataFeatureIterator.hasNext()){
            SimpleFeature dataFeature = (SimpleFeature) dataFeatureIterator.next();
            Geometry dataGeometry = (Geometry) dataFeature.getDefaultGeometry();
            contourFeatureIterator = gs.features();
            while (contourFeatureIterator.hasNext()){
                SimpleFeature contourFeature = contourFeatureIterator.next();
                Geometry contourGeometry = (Geometry) contourFeature.getDefaultGeometry();
                Double lv = (Double) contourFeature.getProperty("lvalue").getValue();
                Double hv = (Double) contourFeature.getProperty("hvalue").getValue();
                if (dataGeometry.getGeometryType() == "MultiPolygon"){
                    for (int i = 0; i <dataGeometry.getNumGeometries(); i++){
                        Geometry geom = dataGeometry.getGeometryN(i);
                        if (geom.intersects(contourGeometry)){
                            Geometry geo = geom.intersection(contourGeometry);
                            SimpleFeatureBuilder featureBuilder = new SimpleFeatureBuilder(TYPE);
                            featureBuilder.add(geo);
                            featureBuilder.add(lv);
                            featureBuilder.add(hv);
                            SimpleFeature feature = featureBuilder.buildFeature(null);
                            list.add(feature);

                        }
                    }

                } else {
                    if (dataGeometry.intersects(contourGeometry)){
                        Geometry geo = dataGeometry.intersection(contourGeometry);
                        SimpleFeatureBuilder featureBuilder = new SimpleFeatureBuilder(TYPE);
                        featureBuilder.add(geo);
                        featureBuilder.add(lv);
                        featureBuilder.add(hv);
                        SimpleFeature feature = featureBuilder.buildFeature(null);
                        list.add(feature);

                    }

                }

            }
        }

        contourFeatureIterator.close();
        dataFeatureIterator.close();
        simpleFeatureCollection = new ListFeatureCollection(TYPE, list);

        return simpleFeatureCollection;

    }

    private String getPolygonGeoJson(List<Polygon> cPolygonList) {
        String geo = null;
        String geometry = " { \"type\":\"Feature\",\"geometry\":";
        String properties = ",\"properties\":{ \"hvalue\":";

        String head = "{\"type\": \"FeatureCollection\"," + "\"features\": [";
        String end = "  ] }";
        if (cPolygonList == null || cPolygonList.size() == 0) {
            return null;
        }
        try {
            for (Polygon pPolygon : cPolygonList) {

                List<Object> ptsTotal = new ArrayList<Object>();
                List<Object> pts = new ArrayList<Object>();

                PolyLine pline = pPolygon.OutLine;

                for (PointD ptD : pline.PointList) {
                    List<Double> pt = new ArrayList<Double>();
                    pt.add(ptD.X);
                    pt.add(ptD.Y);
                    pts.add(pt);
                }

                ptsTotal.add(pts);

                if (pPolygon.HasHoles()) {
                    for (PolyLine cptLine : pPolygon.HoleLines) {
                        List<Object> cpts = new ArrayList<Object>();
                        for (PointD ccptD : cptLine.PointList) {
                            List<Double> pt = new ArrayList<Double>();
                            pt.add(ccptD.X);
                            pt.add(ccptD.Y);
                            cpts.add(pt);
                        }
                        if (cpts.size() > 0) {
                            ptsTotal.add(cpts);
                        }
                    }
                }

                JSONObject js = new JSONObject();
                js.put("type", "Polygon");
                js.put("coordinates", ptsTotal);
                double hv = pPolygon.HighValue;
                double lv = pPolygon.LowValue;

                if (hv == lv) {
                    if (pPolygon.IsClockWise) {
                        if (!pPolygon.IsHighCenter) {
                            hv = hv - 0.1;
                            lv = lv - 0.1;
                        }

                    } else {
                        if (!pPolygon.IsHighCenter) {
                            hv = hv - 0.1;
                            lv = lv - 0.1;
                        }
                    }
                } else {
                    if (!pPolygon.IsClockWise) {
                        lv = lv + 0.1;
                    } else {
                        if (pPolygon.IsHighCenter) {
                            hv = hv - 0.1;
                        }
                    }

                }

                geo = geometry + js.toString() + properties + hv
                        + ", \"lvalue\":" + lv + "} }" + "," + geo;

            }
            if (geo.contains(",")) {
                geo = geo.substring(0, geo.lastIndexOf(","));
            }

            geo = head + geo + end;
        } catch (Exception e) {
            e.printStackTrace();
            return geo;
        }
        return geo;
    }

    public static void main(String[] args) {
        long start = System.currentTimeMillis();

        EquiSurface equiSurface = new EquiSurface();
        CommonMethod cm = new CommonMethod();

        // 雨量站点经纬度及雨量值
        JSONArray jsonArray = GeoJSONUtil.yuliang();
        double[][] trainData = new double[jsonArray.size()][3];
        for (int i = 0; i < jsonArray.size(); i++){
            trainData[i][0] = jsonArray.getJSONObject(i).getDouble("LGTD");
            trainData[i][1] = jsonArray.getJSONObject(i).getDouble("LTTD");
            trainData[i][2] = jsonArray.getJSONObject(i).getDouble("DYP");
        }

        double[] dataInterval = new double[]{0.0001, 2, 4, 6, 9, 10, 20, 30};

        String boundryFile = "F:\\我的文档\\等值面图研究\\jz-data\\jz-shape\\锦州_R.shp";

        int[] size = new int[]{100, 100};

        boolean isclip = false;

        try {
            String strJson = equiSurface.calEquiSurface(trainData, dataInterval, size, boundryFile, isclip);
            String strFile = "C:\\Users\\admin\\Desktop\\临时\\jinzhou.json";
            cm.append2File(strFile, strJson);
            System.out.println(strFile + "差值成功, 共耗时" + (System.currentTimeMillis() - start) + "ms");
        } catch (Exception e) {
            e.printStackTrace();
        }
    }
}
    public static SimpleFeatureCollection readGeoJsonByString(String geojsonpogylon) throws IOException {
        FeatureJSON fjson = new FeatureJSON();
        SimpleFeatureCollection featureCollection = (SimpleFeatureCollection) fjson.readFeatureCollection(geojsonpogylon);
        return featureCollection;
    }

    public void append2File(String strFile, String strJson){
        File f=new File(strFile);//新建一个文件对象,如果不存在则创建一个该文件
        FileWriter fw;
        try {
            fw = new FileWriter(f);
            fw.write(strJson);//将字符串写入到指定的路径下的文件中
            fw.close();
        } catch (IOException e) { e.printStackTrace(); }
    }
<script type="text/javascript">
var bounds = [120.711715945734340, 40.783993710141660,
122.595342945920280, 42.126609285989790];
var projection = new ol.proj.Projection({
code: 'EPSG:4326',
units: 'degrees'
});
$.get("../data/jinzhou/jinzhou-cj2.json",null,function(result){
var features = (new ol.format.GeoJSON()).readFeatures(result);
var vectorSource = new ol.source.Vector();
vectorSource.addFeatures(features);
var vector = new ol.layer.Vector({
source: vectorSource,
style:function(feature, resolution) {
var lvalue = feature.get("lvalue"), color = "0,0,0,0";
if(lvalue<4){
color = "166,242,143,255";
}
else if(lvalue>=4&&lvalue<6){
color = "87,238,40,255";
}
else if(lvalue>=6&&lvalue<10){
color = "22,210,22,255";
}
else if(lvalue>=10&&lvalue<20){
color = "97,184,255,255";
}
else{
color = "28,125,204,255";
}
return new ol.style.Style({
stroke: new ol.style.Stroke({
color: '#ffffff',
// lineDash: [10],
width: 1
}),
fill: new ol.style.Fill({
color: "rgba("+color+")",
opacity:0.6
})
});
}
});
var map = new ol.Map({
controls: ol.control.defaults({
attribution: false
}),
target: 'map',
layers: [vector],
view: new ol.View({
projection: projection
})
});
map.getView().fit(bounds, map.getSize());
});
</script>参考文献:
[1] 等值线图以及色斑图实现方式综述(https://www.jianshu.com/p/04362ff87641)
[2] geotools中等值面的生成与OL3中的展示_LZUGIS-CSDN博客_geoserver 等值线


 1282
1282

 被折叠的 条评论
为什么被折叠?
被折叠的 条评论
为什么被折叠?
 到【灌水乐园】发言


