


一文掌握Go性能分析、采样分析、链路追踪分析、生成火焰图、打点对比分析、压力测试分析、生成网页报告web查看。
Go性能分析
1. 准备工作
1.1 下载go-wrk
这个是用来进行http接口压测的,
官网地址:https://github.com/tsliwowicz/go-wrk
使用
go-wrk -d 500 http://localhost:8080/hello
1.2 安装生成火焰图工具
1.2.1 下载go-torch
go get github.com/uber/go-torch
1.2.2 安装perl
官网下载地址:https://www.activestate.com/products/perl/downloads/
注意:安装时记得把添加到环境变量PATH选项勾上
1.2.3 下载FlameGraph
git clone https://github.com/brendangregg/FlameGraph.git
注意:将此文件夹加入到PATH环境变量中
1.3 下载graphviz
生成SVG 图,能够更好地看到函数调用 CPU 占用情况
1.3.1 Windows安装
官网下载地址:https://graphviz.gitlab.io/_pages/Download/Download_windows.html
安装好之后,添加其 bin文件到PATH环境变量中
1.3.2 Linux安装
# MacOS
brew install graphviz

# Ubuntu
sudo apt-get install graphviz

# Centos
yum install graphviz
1.3.3 测试
检查是否安装成功
dot -version
2. 性能分析
2.1 开启性能分析
开启性能分析只需要导入下面这个包即可
import _ "net/http/pprof"
2.2 开始压测
完整代码见文章末尾附录
- 启动
main.go - 开始压测
go-wrk -d 500 http://localhost:8080/hello
2.3 web查看
浏览器打开:http://localhost:8080/debug/pprof/

allocs: 内存分配情况block: 导致阻塞同步的堆栈跟踪cmdline: 当前程序激活的命令行goroutine: 当前运行的goroutineheap: 存活对象的内存分配情况mutex: 互斥锁的竞争持有者的堆栈跟踪profile: 默认进行 30s 的 CPU Profilingthreadcreate: 操作系统线程跟踪trace: 当前程序执行情况full goroutine stack dump: 所有goroutine栈输出
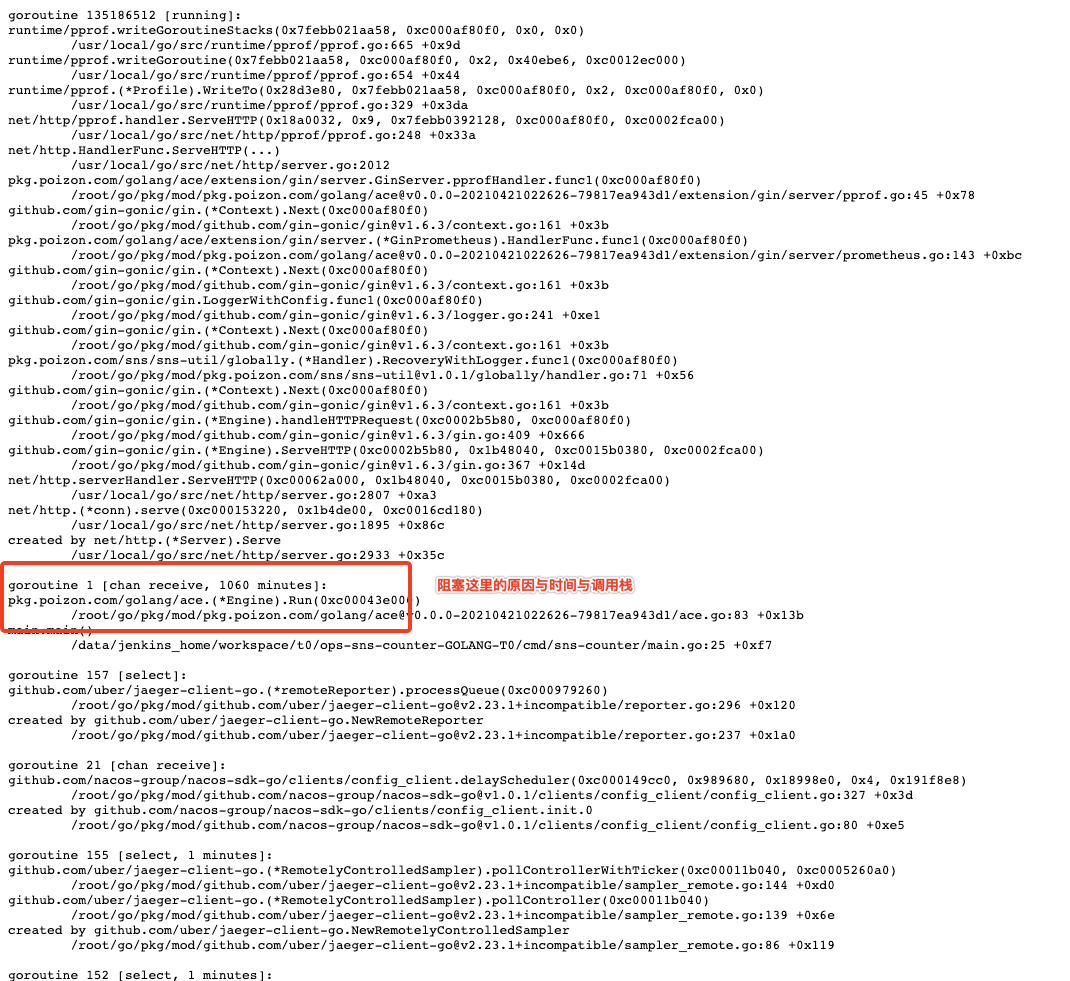
粗略查看,以goroutine为例,参数有debug=1 与 debug = 2
-
http://localhost:8080/debug/pprof/goroutine?dubug=1
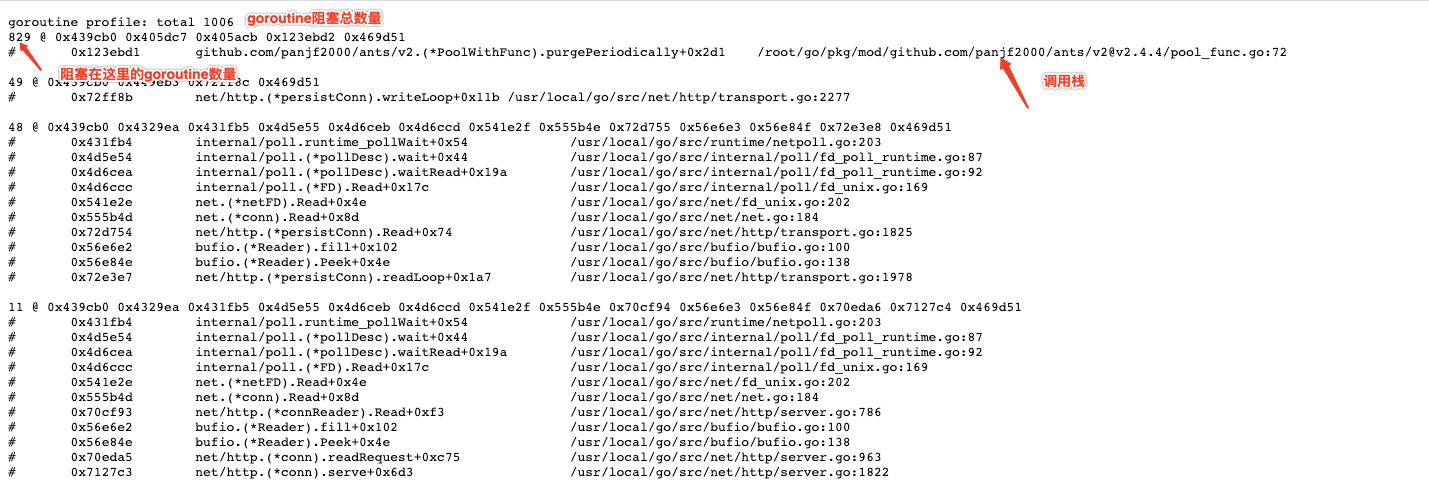
-
http://localhost:8080/debug/pprof/goroutine?dubug=2
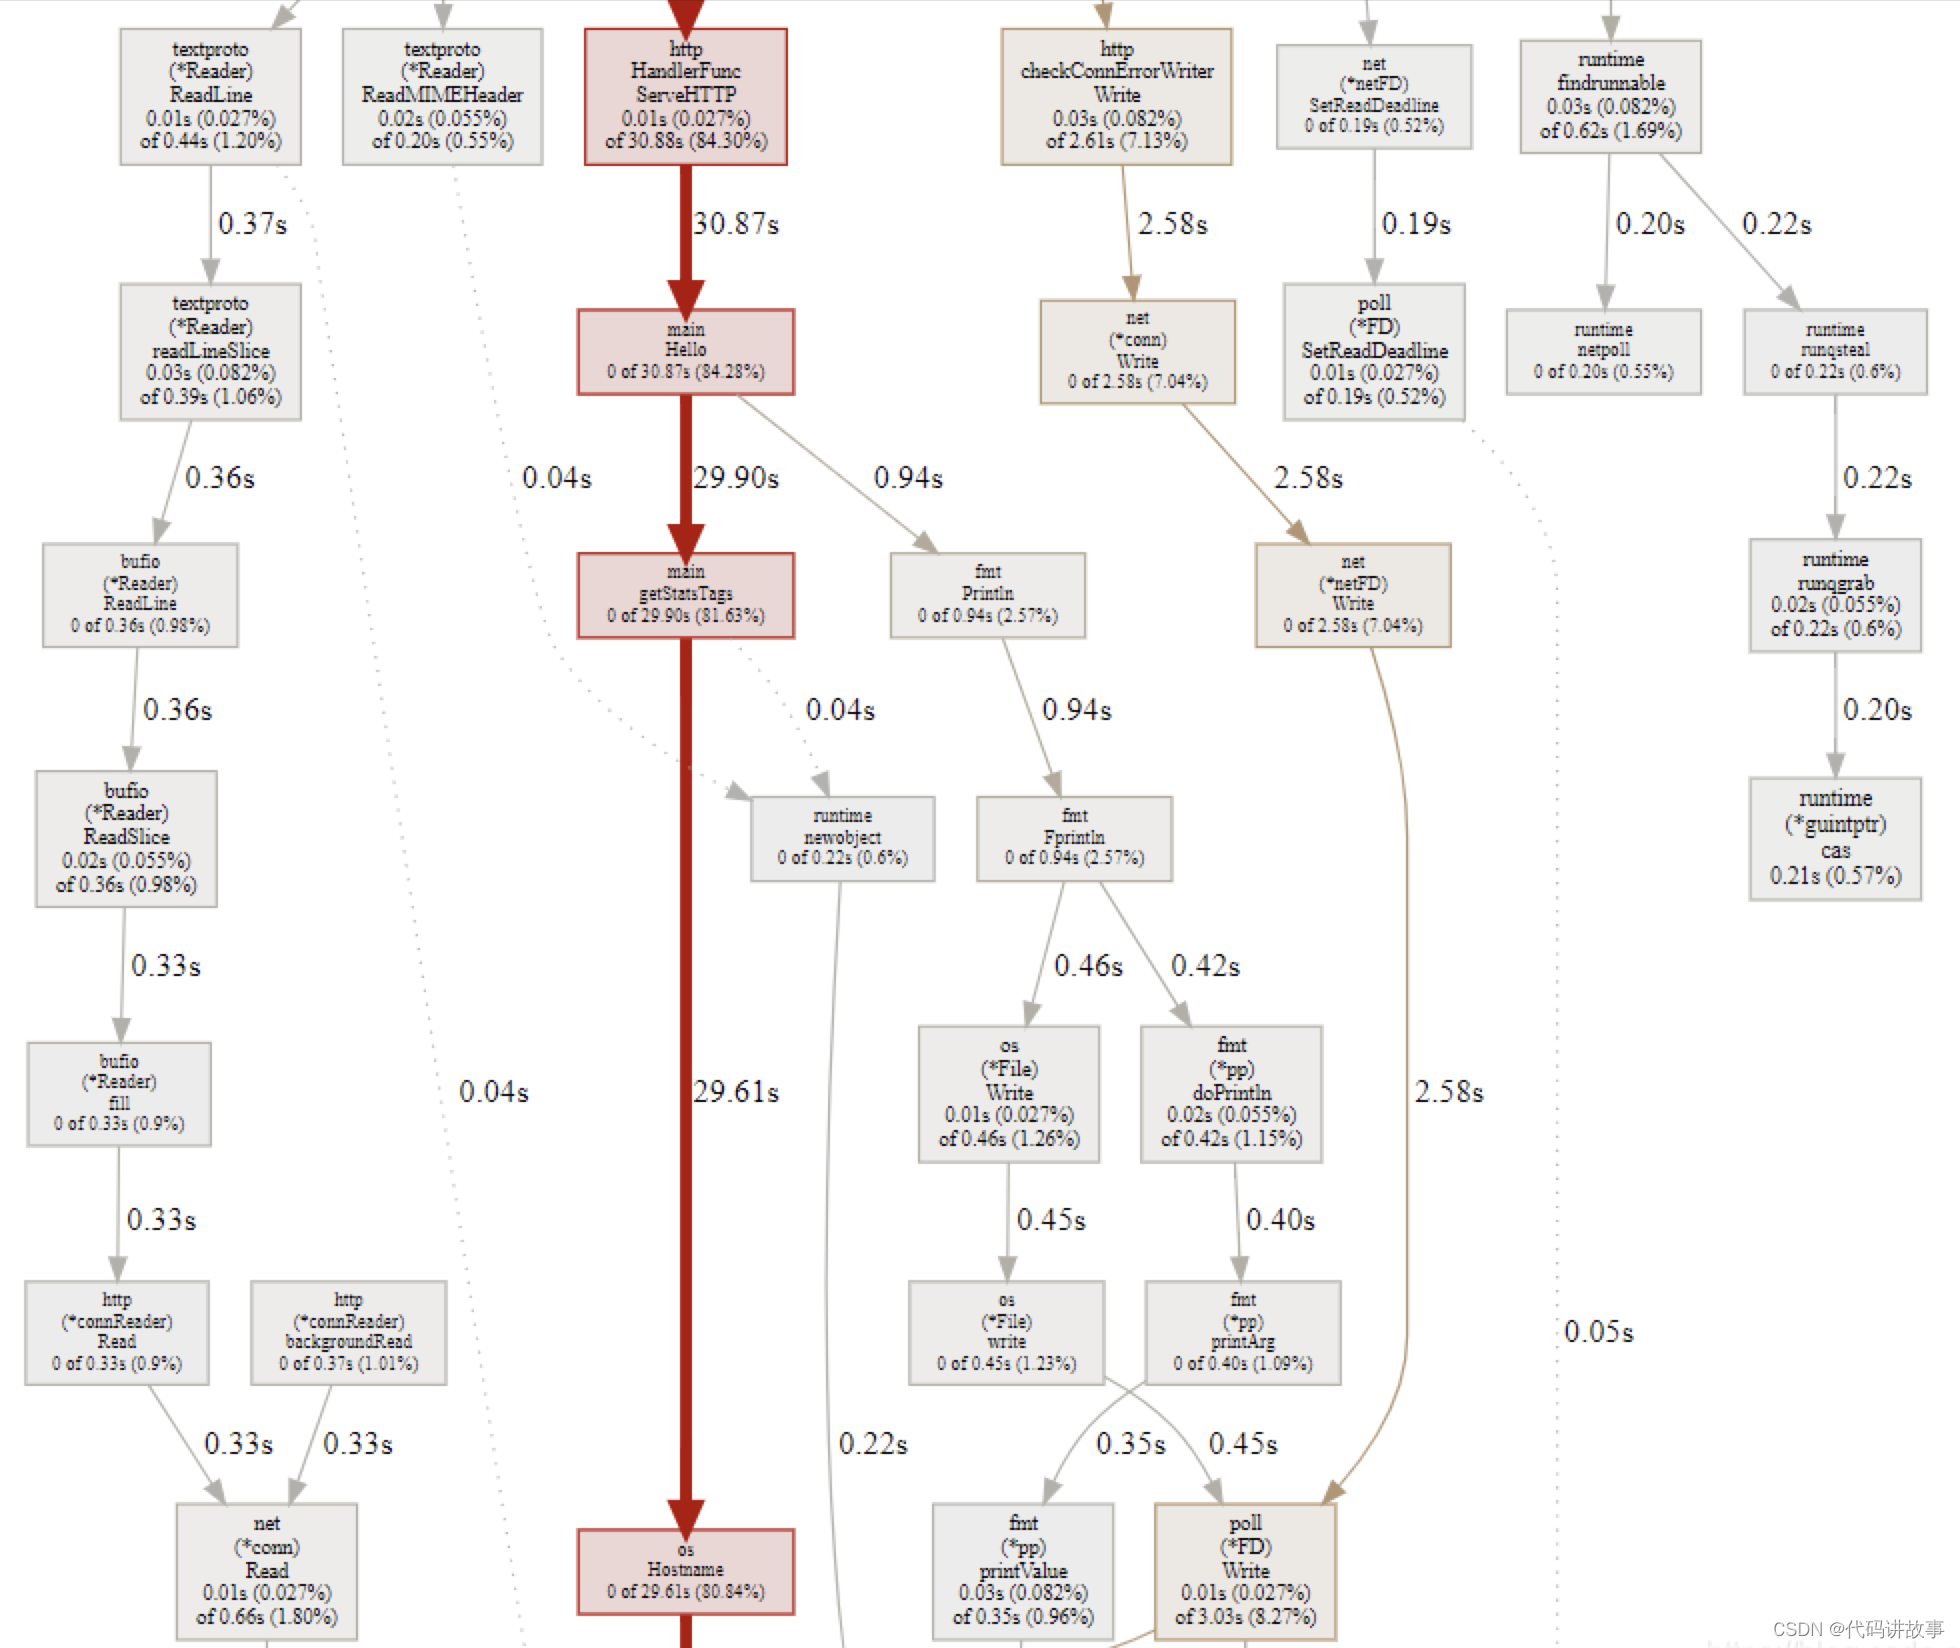
2.4 采样分析
下面命令会打开一个交互页面
go tool pprof --seconds 5 http://localhost:8080/debug/pprof/profile
常用命令
top nn不写默认显示10个占用CPU时间最多的函数top -cum将数据累计查看各个函数CPU占用tree树形结构查看goroutine情况。list 方法名查看方法名里面具体调用耗时时长。web生成SVG函数调用图(需安装graphviz)exit退出分析
打开pprof可视化页面,与上面 可交互页面中web命令效果一样
go tool pprof -http=:8080 http://localhost:8080/debug/pprof/profile?seconds=60

其他参数
-inuse_space: 分析程序常驻内存的占用情况-alloc_objects:分析内存的临时分配情况
go tool pprof -inuse_space http://localhost:8080/debug/pprof/heap

go tool pprof -alloc_space http://localhost:8080/debug/pprof/heap
2.5 生成火焰图
进行 5 秒钟的 CPU 性能采样并生成火焰图
go-torch --seconds 5 http://localhost:8080/debug/pprof/profile
命令执行完会在该目录下生成一个torch.svg文件,可用浏览器打开查看火焰图

2.6 链路追踪分析
curl http://localhost:8080/debug/pprof/trace?seconds=30 > trace.out

go tool trace trace.out
上面会打开一个Web页面,我们点击View trace可以看到整个链路追踪页面。
按W可以将时间线放大,S 将时间线缩小
Goroutine analysis查看每个方法的Goroutine数量Network blocking profile查看IO阻塞情况Synchronization blocking profile查看系统同步阻塞情况Syscall blocking profile查看系统调用阻塞情况Scheduler latency profile查看系统调度阻塞情况
如果只想针对某个方法进行分析可以在方法内第一行加上下面代码
f, err := os.Create("trace.out")
if err != nil {
    panic(err)
}
defer f.Close()

err = trace.Start(f)
if err != nil {
    panic(err)
}
defer trace.Stop()
常用解释
| 名称 | 含义 |
|---|---|
| Execution Time | 执行时间 |
| Network Wait Time | 网络等待时间 |
| Sync Block Time | 同步阻塞时间 |
| Blocking Syscall Time | 调用阻塞时间 |
| Scheduler Wait Time | 调度等待时间 |
| GC Sweeping | GC 清扫 |
| GC Pause | GC 暂停 |
2.7 打点对比分析
下文以
goroutine为列,想比较 内存的话,可把url后缀改成heap
打第一个时间点
go tool pprof http://localhost:8080/debug/pprof/goroutine
等待一会,再打第二个时间点
go tool pprof http://localhost:8080/debug/pprof/goroutine
会生成两个采样文件 pprof.goroutine.001.pb.gz pprof.goroutine.002.pb.gz
对比分析
go tool pprof -base pprof.goroutine.001.pb.gz pprof.goroutine.002.pb.gz
会和之前一样出现一个命令行交互界面,不同的是这个里面的信息是两者的差异比较。我们通过
top
查看两者差异goroutine最大之处是在哪里,然后通过traces查看栈调用信息,
也可以通过list 方法名查看某个方法具体哪一行出了问题
3. Go压力测试分析
1.生成 pprof.cpu文件
go test -bench . -benchmem -cpuprofile pprof.cpu
2.分析pprof.cpu文件
go tool pprof pprof.cpu
3.使用ab压测
ab -n 200 -c 20 -p data.txt http://localhost:8082/hello
-n一共请求多少次-c每次请求多少个
完整代码:
pprof/gc/main.go
package main

import (
	"fmt"
	"log"
	"runtime"
	"time"
)

// 查看当前程序内存分配情况
func readMemStats() {
	var ms runtime.MemStats
	runtime.ReadMemStats(&ms)
	fmt.Printf("Alloc:%d(bytes) HeapIdle:%d(bytes) HeapReleased:%d(bytes) \n", ms.Alloc, ms.HeapIdle, ms.HeapReleased)
}

func main() {
	readMemStats()

	arrays := make([]int, 8)
	for i := 0; i < 32*1000*1000; i++ {
		arrays = append(arrays, i)
		if i == 16*1000*1000 {
			readMemStats()
		}
	}
	readMemStats()

	log.Println(" ===> [start gc]")
	runtime.GC() //强制调用gc回收

	log.Println(" ===> [gc Done].")
	readMemStats()

	time.Sleep(3 * time.Second)
}
pprof/main.go
package main

import (
	"fmt"
	"github.com/charmbracelet/lipgloss"
	_ "net/http/pprof"
)

var style = lipgloss.NewStyle().Bold(false).Foreground(lipgloss.Color("#FAFAFA")).Background(lipgloss.Color("#7D56F4")).PaddingTop(2).PaddingLeft(4).Width(22)

func main() {
	fmt.Println(style.Render("Hello, kitty."))
}


 771
771


 被折叠的 条评论
为什么被折叠?
被折叠的 条评论
为什么被折叠?
 到【灌水乐园】发言


