


前景
-
很多情况下图标都是一个,我们大概率会像下面代码一样的做法
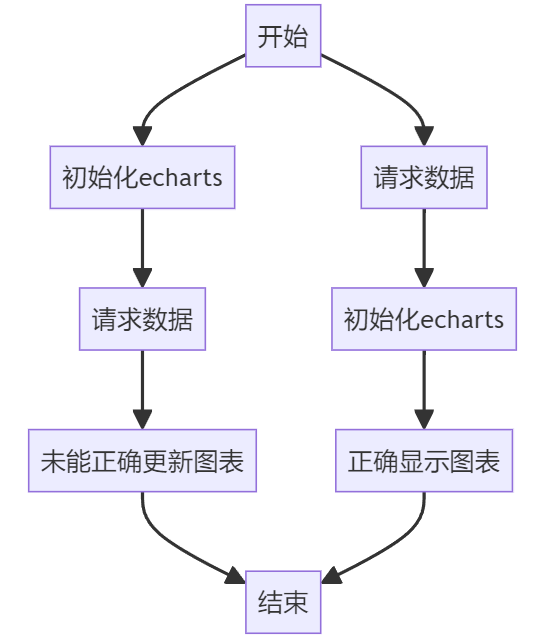
- 大概流程就是获取到数据后执行初始化,因为先初始化后异步请求再设置state里面的数据回导致无法正常显示echarts(除非再次调用setOption)
- 下面就记录下自己解决过程
- 源码
- https://github.com/superBiuBiuMan/react-class-test
根据ID获取DOM进行初始化
import React, { Component } from 'react';
import * as echarts from 'echarts';
import axios from 'axios';

class TestEcharts extends Component {
  constructor(props) {
    super(props);
    this.state = {
      testData: '测试数据',
      list1: [],
    };
  }
  componentDidMount() {
    this.initEchartsData();
  }
  // 请求并初始化echarts数据
  initEchartsData() {
    axios.get('https://api.oick.cn/api/lishi').then((res) => {
      console.log(res);
      //处理数据
      this.setState(
        {
          list1: res.data.result.map((item) => Math.round(Math.random() * 100)),
        },
      );
      // 初始化echarts
      const myChart = echarts.init(document.getElementById('myChart'));
      myChart.setOption({
        xAxis: {
          type: 'category',
          data: ['Mon', 'Tue', 'Wed', 'Thu', 'Fri', 'Sat', 'Sun'],
        },
        yAxis: {
          type: 'value',
        },
        series: [
          {
            data: this.state.list1,
            type: 'line',
          },
        ],
      });
    });
  }


  render() {
    return (
      <div>
        <div id="myChart" style={{ width: '400px', height: '400px' }}></div>
        <div>{this.state.testData}</div>
      </div>
    );
  }
}

export default TestEcharts;
根据ref获取DOM进行初始化
import React, { Component,createRef  } from 'react';
import * as echarts from 'echarts';
import axios from 'axios';

class TestEcharts extends Component {
  constructor(props) {
    super(props);
    this.state = {
      testData: '测试数据',
      list1: [],
    };
    this.echart1 = createRef();
  }
  componentDidMount() {
    this.initEchartsData();
  }
  // 请求并初始化echarts数据
  initEchartsData() {
    axios.get('https://api.oick.cn/api/lishi').then((res) => {
      console.log(res);
      //处理数据
      this.setState(
        {
          list1: res.data.result.map((item) => Math.round(Math.random() * 100)),
        },
      );
      // 初始化echarts
      // const myChart = echarts.init(document.getElementById('myChart'));
      console.log(this.echart1.current);
      const myChart = echarts.init(this.echart1.current);
      myChart.setOption({
        xAxis: {
          type: 'category',
          data: ['Mon', 'Tue', 'Wed', 'Thu', 'Fri', 'Sat', 'Sun'],
        },
        yAxis: {
          type: 'value',
        },
        series: [
          {
            data: this.state.list1,
            type: 'line',
          },
        ],
      });
    });
  }


  render() {
    return (
      <div>
         {/* id="myChart" */}
        <div ref={this.echart1} style={{ width: '400px', height: '400px' }}></div>
        <div>{this.state.testData}</div>
      </div>
    );
  }
}

export default TestEcharts;
如果有1个页面有多个echart图标怎么解决呢?
方式1-一个图表就是一个组件
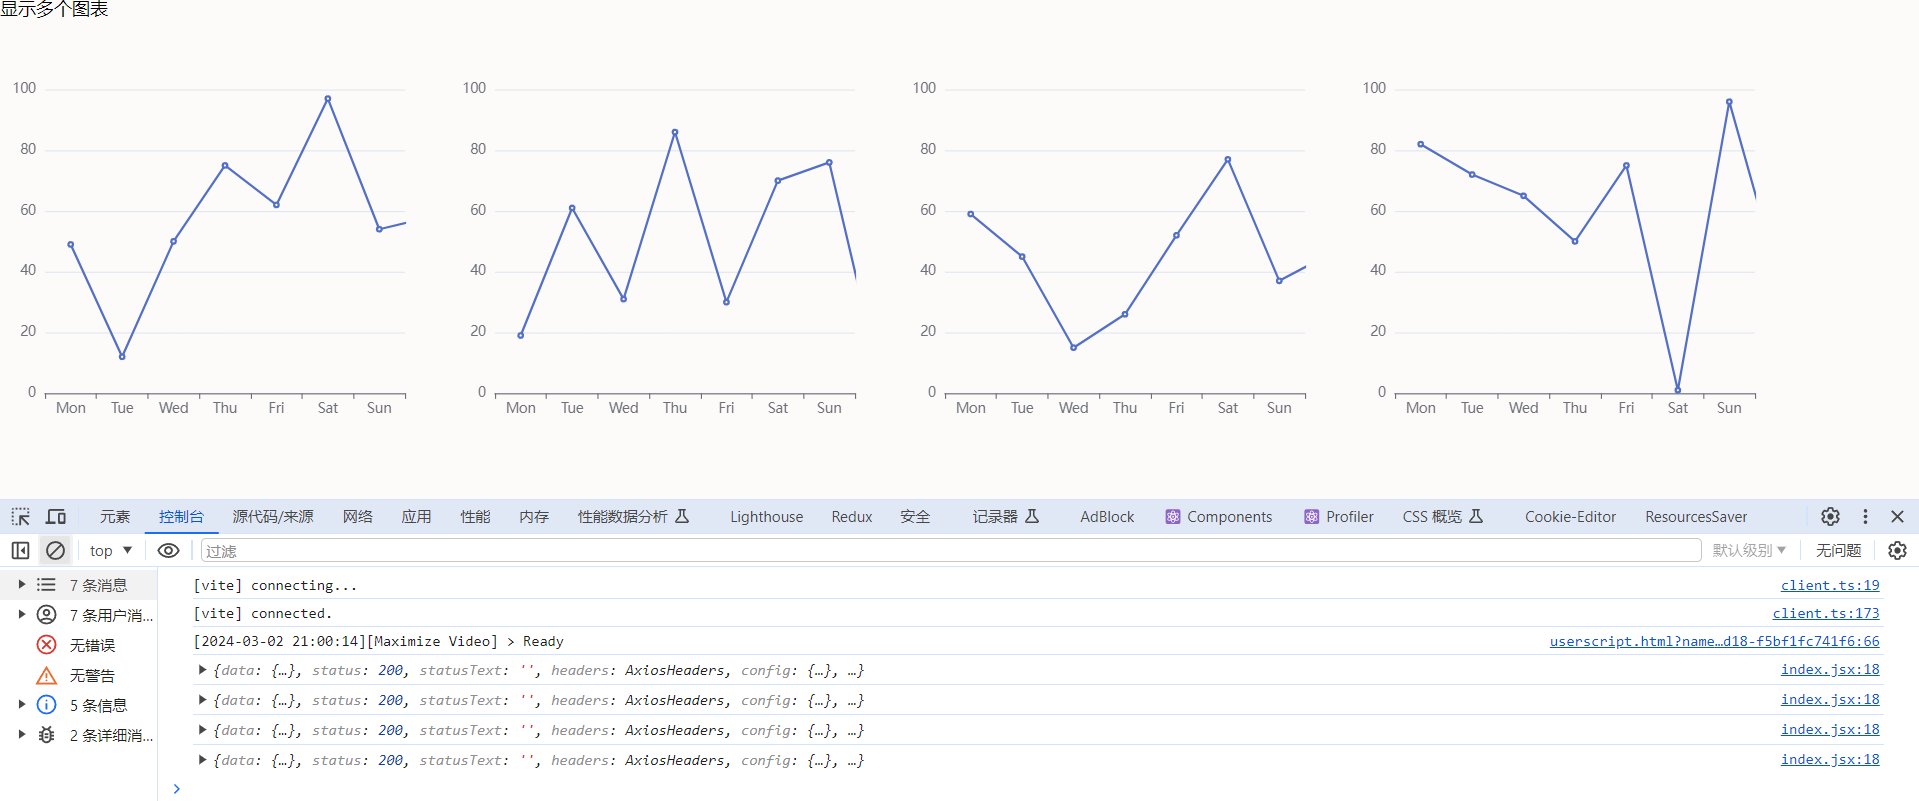
数据获取到后再setOption
- 主index.jsx
import React, { Component } from 'react'
import ShowData from "./component/showData/index";
export default class index extends Component {
  render() {
    return (
      <div>
        <div>显示多个图表</div>
        <div style={{ display:'flex' }}>
          <ShowData/>
          <ShowData/>
          <ShowData/>
          <ShowData/>
        </div>
      </div>
    )
  }
}
- 图表ShowData.jsx
import React, { Component, createRef } from 'react';
import * as echarts from 'echarts';
import axios from 'axios';
export default class index extends Component {
  constructor(props) {
    super(props);
    this.state = {
      data: [],
    };
    this.echartDOM = createRef();
  }
  // 请求数据
  initData() {
    axios.get('https://api.oick.cn/api/lishi').then((res) => {
      console.log(res);
      //处理数据
      this.setState({
        data: res.data.result.map((item) => Math.round(Math.random() * 100)),
      },() => {
        this.initEchartsData();
      });
    });
  }
  //初始化echart图表
  initEchartsData(){
    const myChart = echarts.init(this.echartDOM.current);
    myChart.setOption({
      xAxis: {
        type: 'category',
        data: ['Mon', 'Tue', 'Wed', 'Thu', 'Fri', 'Sat', 'Sun'],
      },
      yAxis: {
        type: 'value',
      },
      series: [
        {
          data: this.state.data,
          type: 'line',
        },
      ],
    });
  }
  componentDidMount() {
    this.initData(); //初始化数据
  }
  render() {
    return (
      <div
        ref={this.echartDOM}
        style={{ width: '400px', height: '400px' }}
      ></div>
    );
  }
}
先setOption后再更新
- 通过createRef获取DOM再保存echarts实例方式
- 主index.jsx
import React, { Component } from 'react'
import ShowData from "./component/showData/index";
import ShowData2 from "./component/showData/index2";
export default class index extends Component {
  render() {
    return (
      <div>
        <div>显示多个图表</div>
        <div style={{ display:'flex' }}>
          <ShowData2/>
          <ShowData2/>
          <ShowData2/>
          <ShowData2/>
        </div>
      </div>
    )
  }
}
- 图表ShowData2.jsx
import React, { Component, createRef } from 'react';
import * as echarts from 'echarts';
import axios from 'axios';
export default class index extends Component {
  constructor(props) {
    super(props);
    this.state = {
      data: [],
      myEchart: '',
    };
    this.echartDOM = createRef();
  }
  // 请求数据
  initData() {
    axios.get('https://api.oick.cn/api/lishi').then((res) => {
      console.log(res);
      //处理数据
      this.setState({
        data: res.data.result.map((item) => Math.round(Math.random() * 100)),
      },() => {
        this.state.myEchart.setOption({
          xAxis: {
            type: 'category',
            data: ['Mon', 'Tue', 'Wed', 'Thu', 'Fri', 'Sat', 'Sun'],
          },
          yAxis: {
            type: 'value',
          },
          series: [
            {
              data: this.state.data,
              type: 'line',
            },
          ],
        });
      });
    });
  }
  //初始化echart图表
  initEchartsData(){
    const myEchart = echarts.init(this.echartDOM.current);
    this.setState({
      myEchart,
    })
    myEchart.setOption({
      xAxis: {
        type: 'category',
        data: ['Mon', 'Tue', 'Wed', 'Thu', 'Fri', 'Sat', 'Sun'],
      },
      yAxis: {
        type: 'value',
      },
      series: [
        {
          data: this.state.data,
          type: 'line',
        },
      ],
    });
  }
  componentDidMount() {
    this.initData(); //初始化数据
    this.initEchartsData();//初始化数据
  }
  render() {
    return (
      <div
        ref={this.echartDOM}
        style={{ width: '400px', height: '400px' }}
      ></div>
    );
  }
}
方式2-都写在一个jsx\tsx文件中
- 比较难的地方在于怎么获取到这么多个的DOM再进行统一的初始化,并且还可能后续不同操作需要更新不同的DOM
- 这里只是数组简单的存储,你也可以通过Map来进行存储
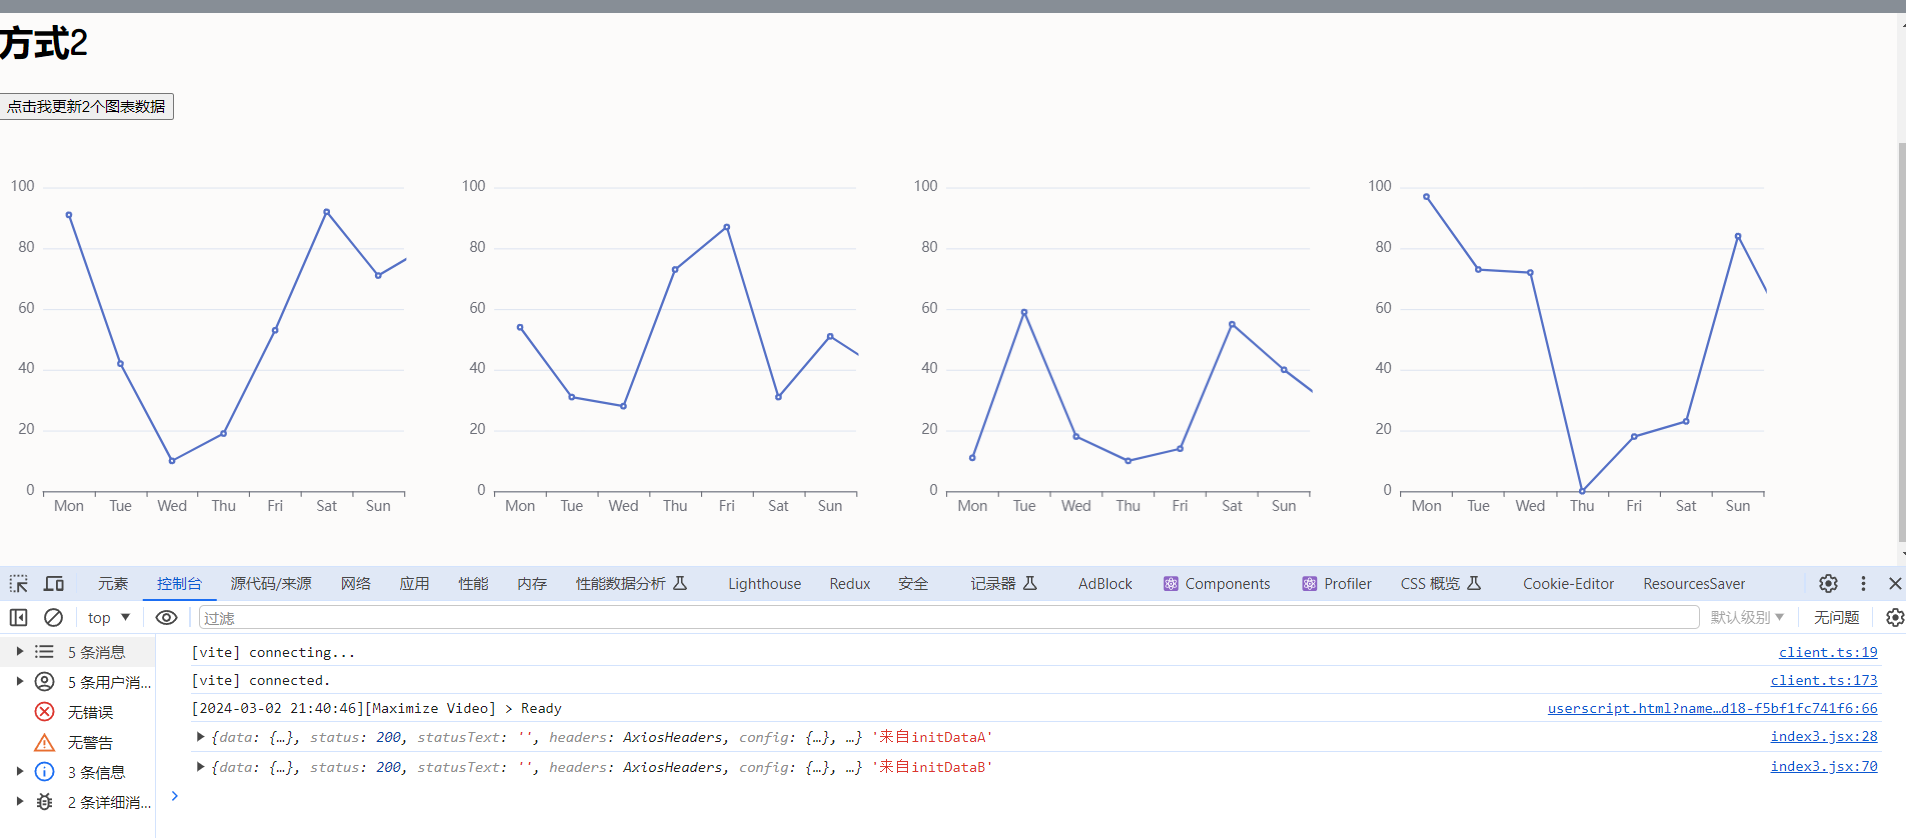
- 点击更新
- 主index.jsx
import React, { Component } from 'react'
import ShowData from "./component/showData/index";
import ShowData2 from "./component/showData/index2";
import ShowData3 from "./component/showData/index3";
export default class index extends Component {
  render() {
    return (
      <div>
        <div>显示多个图表</div>
        {/* 方式1 */}
        <h1>方式1</h1>
        <div style={{ display:'flex' }}>
          {/* <ShowData2/>
          <ShowData2/>
          <ShowData2/>
          <ShowData2/> */}
        </div>
        {/* 方式2 */}
        <h1>方式2</h1>
        <div >
          <ShowData3/>
        </div>
      </div>
    )
  }
}
- 图表ShowData.jsx
import React, { Component, createRef } from 'react';
import * as echarts from 'echarts';
import axios from 'axios';
export default class index3 extends Component {
  constructor(props) {
    super(props);
    this.state = {
      myEchartList: [], //实例化echart列表
      data1: [],
      data2: [],
      data3: [],
      data4: [],
    };
    this.allRef = []; //存储所有的ref
  }
  componentDidMount() {
    this.setState({
      //实例化echart
      myEchartList: this.allRef.map((item) => echarts.init(item)),
    });
    //获取数据A
    this.initDataA();
    //获取数据B
    this.initDataB();
  }
  initDataA = () => {
    axios.get('https://api.oick.cn/api/lishi').then((res) => {
      console.log(res,'来自initDataA');
      let data1 = res.data.result.map(() => Math.round(Math.random() * 100));
      let data2 = res.data.result.map(() => Math.round(Math.random() * 100));
      //处理数据
      this.setState({
        data1,
        data2,
      });
      this.state.myEchartList[0].setOption({
        xAxis: {
          type: 'category',
          data: ['Mon', 'Tue', 'Wed', 'Thu', 'Fri', 'Sat', 'Sun'],
        },
        yAxis: {
          type: 'value',
        },
        series: [
          {
            data:data1,
            type: 'line',
          },
        ],
      });
      this.state.myEchartList[1].setOption({
        xAxis: {
          type: 'category',
          data: ['Mon', 'Tue', 'Wed', 'Thu', 'Fri', 'Sat', 'Sun'],
        },
        yAxis: {
          type: 'value',
        },
        series: [
          {
            data:data2,
            type: 'line',
          },
        ],
      });
    });
  };
  initDataB = () => {
    axios.get('https://api.oick.cn/api/lishi').then((res) => {
      console.log(res,'来自initDataB');
      let data3 = res.data.result.map(() => Math.round(Math.random() * 100));
      let data4 = res.data.result.map(() => Math.round(Math.random() * 100));
      //处理数据
      this.setState({
        data3,
        data4,
      });
      this.state.myEchartList[2].setOption({
        xAxis: {
          type: 'category',
          data: ['Mon', 'Tue', 'Wed', 'Thu', 'Fri', 'Sat', 'Sun'],
        },
        yAxis: {
          type: 'value',
        },
        series: [
          {
            data:data3,
            type: 'line',
          },
        ],
      });
      this.state.myEchartList[3].setOption({
        xAxis: {
          type: 'category',
          data: ['Mon', 'Tue', 'Wed', 'Thu', 'Fri', 'Sat', 'Sun'],
        },
        yAxis: {
          type: 'value',
        },
        series: [
          {
            data:data4,
            type: 'line',
          },
        ],
      });
    });
  };
  handleUpdate = () => {
    this.initDataA();
  };
  render() {
    return (
      <>
        <button onClick={this.handleUpdate}>点击我更新2个图表数据</button>
        <div
          style={{ display: 'flex' }}
        >
          <div
            ref={(node) => {
              this.allRef.push(node);
            }}
            style={{ width: '401px', height: '400px' }}
          ></div>
          <div
            ref={(node) => {
              this.allRef.push(node);
            }}
            style={{ width: '402px', height: '400px' }}
          ></div>
          <div
            ref={(node) => {
              this.allRef.push(node);
            }}
            style={{ width: '403px', height: '400px' }}
          ></div>
          <div
            ref={(node) => {
              this.allRef.push(node);
            }}
            style={{ width: '404px', height: '400px' }}
          ></div>
        </div>
      </>
    );
  }
}
总结
-
可以了解下setOption的其他用法https://www.jb51.net/article/269766.htm
-
也可以使用在react中
- echarts-for-react: https://www.npmjs.com/package/echarts-for-react
-
参考文章
- https://blog.csdn.net/A15029296293/article/details/130500081


 599
599


 被折叠的 条评论
为什么被折叠?
被折叠的 条评论
为什么被折叠?
 到【灌水乐园】发言


