


<!DOCTYPE html>
<html>
<head>
<meta charset="utf-8">
<title></title>
<style>
.con{
position: absolute;
width: 505px;
height:260px;
/* background-color: aquamarine; */
}
.con-po{
position: absolute;
width: 2px;
height: 134px;
background-color: #cecece;
top: 39px;
right: 157px;
}
.con-r{
position: absolute;
top: 2px;
left: 148px;
color: #717171;
}
.con-num{
position: relative;
top: 39px;
left: 148px;
color: #717171;
font-size: 14px;
}
.con-bg{
position: relative;
background-color: aqua;
width: 90%;
height: 90%;
top: 0px;
left: 0px;
right: 0px;
bottom: 0px;
}
</style>
</head>
<body>
<div class="con">
<div class="con-bg">
</div>
<div id="main" style="width:100%;height: 100%;"></div>
</div>
<script src="js/echarts.min.js"></script>
<script>
var chartDom = document.getElementById('main');
var myChart = echarts.init(chartDom);
var option;
option = {
// backgroundColor: 'red',
tooltip: {
trigger: 'axis',
axisPointer: {
// type: 'none'
},
formatter: function (params) {
// return params[0].name + ': ' + params[0].value;
return "" + params[0].value;
}
},
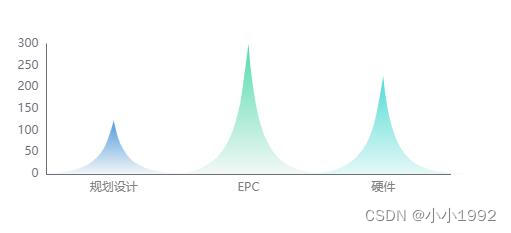
xAxis: {
data: ['规划设计', 'EPC', '硬件'],
axisTick: { show: false },
axisLine: { show: true },
axisLabel: {
show: true ,
color: '#808080'
},
},
yAxis: {
splitLine: { show: false },
axisTick: { show: false },
axisLine: { show: true },
axisLabel: { show: true },
type: 'value',
axisLabel: {
// formatter: '{value} /个' // 这里的 '单位' 是你想要显示的单位
}
},
color: ['#e54035'],
series: [
{
markPoint: {
itemStyle: {
//通常情况下:
normal: {
// color:'rgba(0,0,0,0)'
color: {
type: 'linear',
x: 0,
y: 0,
x2: 1,
y2: 0,
colorStops: [{
offset: 0,
color: '#F4515E' // 0% 处的颜色
}, {
offset: 1,
color: '#21c3ae' // 100% 处的颜色
}],
globalCoord: false // 缺省为 false
},
},
},
data: [{
type: "max"
}],
symbol: "pin"
},
name: 'hill',
type: 'pictorialBar',
barCategoryGap: '-38%',
// symbol: 'path://M0,10 L10,10 C5.5,10 5.5,5 5,0 C4.5,5 4.5,10 0,10 z',
symbol: 'path://M0 ,10 L10,10 C6.5,10 5.5,9 5,0 C4.5,5 4.5,10 0.8,10 z',
itemStyle: {
opacity:1,
},
emphasis: {
itemStyle: {
opacity: 1,
}
},
data: [
123, 300, 225],
z: 10,
itemStyle: {
//通常情况下:
normal: {
// label: {
// show: true, //开启显示
// position: 'top', //在上方显示
// },
// barBorderRadius: 8,
//每个柱子的颜色即为colorList数组里的每一项,如果柱子数目多于colorList的长度,则柱子颜色循环使用该数组
color: function (params) {
var colorList = [
['#529ADB', '#F1F5F8'],
['#52DBAC', '#F2F8F5'],
['#52DBD6', '#E5F8F6'],
];
var index = params.dataIndex;
if (params.dataIndex >= colorList.length) {
index = params.dataIndex - colorList.length;
}
return new echarts.graphic.LinearGradient(0, 0, 0, 1,
[{
offset: 0,
color: colorList[index][0]
},
{
offset: 1,
color: colorList[index][1]
}
]);
}
},
},
},
]
};
option && myChart.setOption(option);
</script>
</body>
</html>
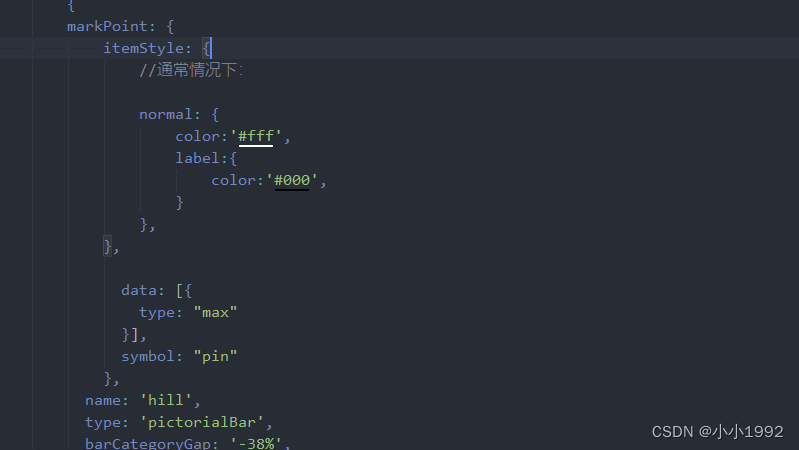
markpoint背景白色字体黑色


 404
404


 被折叠的 条评论
为什么被折叠?
被折叠的 条评论
为什么被折叠?
 到【灌水乐园】发言


