


高德地图自定义图形绘制中坐标转换的问题,绘制高级自定义图形
本文主要对需要在高德地图(或其他地图上面绘制规则自定义图形)的补充和以及遇到的图形拉伸变形的问题解决。(读者可以根据需要决定要不要解决这个问题, 注: 大部分图形拉伸问题的解决是没有实际意义的)
1. 绘制正方形
下面是高德地图绘制正方形的代码:
/**
* 生成一个长方形的四个坐标点
*/
private List<LatLng> createRectangle(LatLng center, double halfWidth, double halfHeight) {
	List<LatLng> latLngs = new ArrayList<LatLng>();
	latLngs.add(new LatLng(center.latitude - halfHeight, center.longitude - halfWidth));
	latLngs.add(new LatLng(center.latitude - halfHeight, center.longitude + halfWidth));
	latLngs.add(new LatLng(center.latitude + halfHeight, center.longitude + halfWidth));
	latLngs.add(new LatLng(center.latitude + halfHeight, center.longitude - halfWidth));
	return latLngs;
}

// 绘制一个长方形
aMap.addPolygon(new PolygonOptions()
.addAll(createRectangle(Constants.SHANGHAI, 1, 1))
.fillColor(Color.LTGRAY).strokeColor(Color.RED).strokeWidth(1));
图1
从效果图片上并看不出来什么问题,如果我们将上面的代码中的边长增加到2,再看下效果图:
图2

从效果图上可以明显的看出来正方形的高被拉伸,这其中涉及到 墨卡托坐标与经纬度坐标的转换关系, 高德地图与百度地图都是用的是墨卡托坐标系,给定点的经纬度在绘制到地图上时会经过墨卡托坐标转换, 所以我们把平面坐标系的图形点经纬度绘制到高德地图时, 要先做墨卡托变换为普通平面经纬度的逆向转化。
参考: 墨卡托坐标
可以看出,高德地图绘制正方形需要将墨卡托坐标转换成经纬度坐标:以下是将上面得到的正方形的四个端点经过墨卡托转经纬度的转换后的效果图:
图3

坐标变换公式的 java 改写:
//墨卡托转经纬度
public static LatLng Mercator2lonLat(LatLng mercator) {
double x = mercator.longitude
double y = mercator.latitude
y = 180 / Math.PI * (2 * Math.atan(Math.exp(y * Math.PI / 180)) - Math.PI / 2);
LatLng lonLat = new LatLng(y,x);
return lonLat;
}
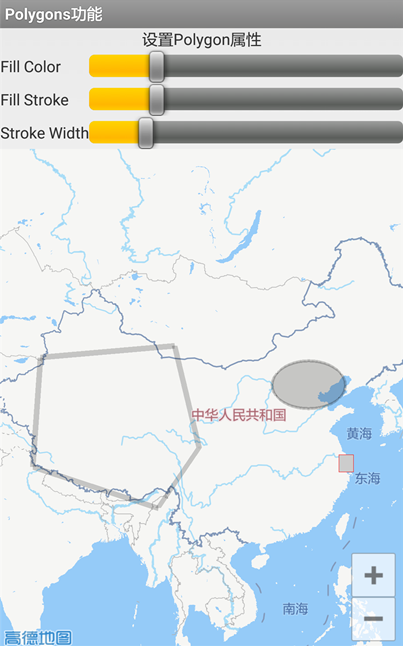
2.利用高德地图绘制任意旋转角度的椭圆
以下是高德地图给的简单实例:(椭圆长轴在x轴上)
aMap.addPolygon(new PolygonOptions()
	.addAll(createRectangle( new LatLng(31.238068, 121.501654), 1, 1))
	.fillColor(Color.LTGRAY).strokeColor(Color.RED).strokeWidth(1));
PolygonOptions options = new PolygonOptions();
int numPoints = 400;
float semiHorizontalAxis = 5f;
float semiVerticalAxis = 2.5f;
double phase = 2 * Math.PI / numPoints;
for (int i = 0; i <= numPoints; i++) {
	options.add(new LatLng(Constants.BEIJING.latitude
	+ semiVerticalAxis * Math.sin(i * phase),
	Constants.BEIJING.longitude + semiHorizontalAxis
	* Math.cos(i * phase)));
	}
// 绘制一个椭圆
polygon = aMap.addPolygon(options.strokeWidth(25)
	.strokeColor(Color.argb(50, 1, 1, 1))
	.fillColor(Color.argb(50, 1, 1, 1)));
}
效果图如上图1
现在给椭圆加一个任意旋转角度 t,根据旋转坐标变换公式,绕原点逆时针旋转θ之後的坐标关系为
x'=xcosθ-ysinθ
y'=xsinθ+ycosθ
将椭圆绘制代码修改为:
aMap.addPolygon(new PolygonOptions()
	.addAll(createRectangle( new LatLng(31.238068, 121.501654), 1, 1))
	.fillColor(Color.LTGRAY).strokeColor(Color.RED).strokeWidth(1));
PolygonOptions options = new PolygonOptions();
int numPoints = 400;
float semiHorizontalAxis = 5f;
float semiVerticalAxis = 2.5f;
double phase = 2 * Math.PI / numPoints;
double t = Math.PI/3;
for (int i = 0; i <= numPoints; i++) {
	//坐标在原点的坐标方程
	double y0 = semiVerticalAxis * Math.sin(i * phase);
	double x0 = semiHorizontalAxis * Math.cos(i * phase);
	//中心点
	double cY = Constants.BEIJING.latitude;
	double cX = Constants.BEIJING.longitudee;
	//旋转后的坐标方程
	double x = x0*Math.cos(t) - y0*Math.sin(t);
	double y = x0*Math.sin(t) + y0*Math.cos(t);
	options.add(new LatLng(cY + y, cX + x));
	}
// 绘制一个椭圆
polygon = aMap.addPolygon(options.strokeWidth(25)
	.strokeColor(Color.argb(50, 1, 1, 1))
	.fillColor(Color.argb(50, 1, 1, 1)));
}
效果图如
### 图4

再看下长轴在x轴上的椭圆即 上面代码中 t = 0
效果图如下,只是改了个旋转角度,图形明显变形了(没有经过墨卡托转经纬度的转换)Mercator2lonLat()
图4

现在贴上完整代码:
aMap.addPolygon(new PolygonOptions()
 .addAll(createRectangle( new LatLng(31.238068, 121.501654), 1, 1))
 .fillColor(Color.LTGRAY).strokeColor(Color.RED).strokeWidth(1));
PolygonOptions options = new PolygonOptions();
int numPoints = 400;
float semiHorizontalAxis = 5f;
float semiVerticalAxis = 2.5f;
double phase = 2 * Math.PI / numPoints;
double t = Math.PI/3;
for (int i = 0; i <= numPoints; i++) {
 //坐标在原点的坐标方程
 double y0 = semiVerticalAxis * Math.sin(i * phase);
 double x0 = semiHorizontalAxis * Math.cos(i * phase);
 //中心点
 double cY = Constants.BEIJING.latitude;
 double cX = Constants.BEIJING.longitudee;
 //旋转后的坐标方程
 double x = x0*Math.cos(t) - y0*Math.sin(t);
 double y = x0*Math.sin(t) + y0*Math.cos(t);
 // 墨卡托坐标转化为经纬度
 LatLng srcLat = new LatLng(cY + y, cX + x);
 LatLng centerLat = new LatLng(cY,cX);
 LatLng centerLatMe2Lon = Mercator2lonLat(centerLat );
 LatLng desLat  = new LatLng(srcLat.latitude - (centerLatMe2Lon.latitude   - centerLat.latitude),
 srcLat.longitudee- (centerLatMe2Lon.longitudee- centerLat.longitudee))
 options.add(srcLat);
 }
 // 绘制一个椭圆
 polygon = aMap.addPolygon(options.strokeWidth(25)
 .strokeColor(Color.argb(50, 1, 1, 1))
 .fillColor(Color.argb(50, 1, 1, 1)));
}
以上代码得到规范的:
图5

3. 图形的运算,实现多个图形的组合等关系运算
Jts.jar 下载: http://www.java2s.com/Code/Jar/j/Downloadjts110jar.htm
JTS 的使用参考: https://www.cnblogs.com/duanxingxing/p/5150487.html
public static LatLng getEllipseLat(LatLng centerLat, Double Q, Double t) {
    double semiHorizontalAxis = 12.5 / 111000f;
    double semiVerticalAxis = 6 / 111000f;
    //坐标在原点的坐标方程
    double y0 = semiVerticalAxis * Math.sin(Q);
    double x0 = semiHorizontalAxis * Math.cos(Q);
    //中心点
    double cY = centerLat.latitude;
    double cX = centerLat.longitude;
    //旋转后的坐标方程
    double x = x0*Math.cos(t) - y0*Math.sin(t);
    double y = x0*Math.sin(t) + y0*Math.cos(t);
    return new LatLng(cY + y, cX + x);
}

/**
 * 绘制椭圆
 * @param latLng
 * @param t
 * @return
 */
public static Polygon makeEllipse(LatLng latLng, double t){
    int numPoints = 60;
    Coordinate coords[] = new Coordinate[numPoints + 1];
    double phase = 2 * Math.PI / numPoints;
    for (int i = 0; i < numPoints; i++) {
        LatLng ellipseLat = getEllipseLat(latLng, i * phase, t);
        coords[i] = new Coordinate(ellipseLat.longitude, ellipseLat.latitude);
    }
    coords[numPoints] = coords[0];
    LinearRing ring = geometryFactory.createLinearRing(coords); // 画一个环线
    Polygon polygon = geometryFactory.createPolygon(ring, null); // 生成一个面
    return polygon;
}


import com.vividsolutions.jts.geom.Geometry;
import com.vividsolutions.jts.io.ParseException;
import com.vividsolutions.jts.io.WKTReader;

public class GeometryFactory {
    private WKTReader reader;

    private static GeometryFactory instance = null;

    public static synchronized GeometryFactory getInstance(){
        if(instance==null){
            instance = new GeometryFactory();
        }
        return instance;
    }

    public void getReader(){
        reader = new WKTReader();
    }

    public Geometry buildGeo(String str){
        try {
            if(reader==null){
                reader = new WKTReader();
            }
            return reader.read(str);
        } catch (ParseException e) {
            throw new RuntimeException("buildGeometry Error",e);
        }
    }

}


  val monitorLat = LatLng(monitorBean.moLatitude, monitorBean.moLongitude)
        var makeEllipse = TestGeometry.makeEllipse(monitorLat, 3*Math.PI/4)
        var makeEllipse1 = TestGeometry.makeEllipse(monitorLat, 0.0)
        var unn = makeEllipse.union(makeEllipse1)
        var coordinatesArea = unn!!.coordinates
        var unionPolygon = PolygonOptions()
var centerMo = PositionUtil.Mercator2lonLat(monitorLat)
        for (coordinate in coordinatesArea) {
            var coorLat = PositionUtil.Mercator2lonLat(LatLng(coordinate.y, coordinate.x))
            unionPolygon.add(LatLng(coorLat.latitude - (-monitorLat.latitude + centerMo.latitude),coorLat.longitude - (-monitorLat.longitude + centerMo.longitude)))
        }
        map.addPolygon(
                unionPolygon.strokeWidth(2.0f)
                        .strokeColor(resources.getColor(R.color.kuo_area_strokeColor))
                        .fillColor(resources.getColor(R.color.kuo_area_solidColor)))
此文章是使用高德地图绘制基本图形的一个研究,如果有什么不正确的地方,还请指出;
后续,有待完善补充。
有什么更好的解决方法可以联系本人:1113197622@qq.com


 3516
3516

 被折叠的 条评论
为什么被折叠?
被折叠的 条评论
为什么被折叠?
 到【灌水乐园】发言


