


目录
1.背景线设置为虚线,lineStyleL里面的type属性为dashed,默认是实线。
2.鼠标放在柱子上的阴影效果,如果用shadow无法设置宽度
6.柱子的宽度和颜色分别是barWidth和itemStyle下的normal下的color
一、 柱状图
1.背景线设置为虚线,lineStyleL里面的type属性为dashed,默认是实线。
yAxis: {
     type: 'value',
     name: "数量(K)",
     splitLine: {
       show: true,
       lineStyle: {
         type: 'dashed'
       }
     }
},
2.鼠标放在柱子上的阴影效果,如果用shadow无法设置宽度
-
'line'直线指示器 -
'shadow'阴影指示器 -
'none'无指示器 -
'cross'十字准星指示器。其实是种简写,表示启用两个正交的轴的 axisPointer。
tooltip: {
      trigger: 'axis',
      axisPointer: { // 坐标轴指示器,坐标轴触发有效
        type: 'line',
        lineStyle: {
          color: {
            type: 'line',
            x: 0,
            y: 0,
            x2: 1,
            y2: 1,
            colorStops: [{
              offset: 0, color: 'rgba(238, 238, 238, 0.3  )' // 100% 处的颜色
            }, {
              offset: 1, color: 'rgba(238, 238, 238, 0.1)' // 0% 处的颜色  #000613','#00334f', '#77f0ff'
            }],
          },
          type: 'solid',
          width: 20
        },
      },
}
3.鼠标放上的tip自定义
tooltip: {
      trigger: 'axis',
formatter: (val) => {
        return `<div style="padding:5px;">
                  <div style="margin-bottom:10px;">使用次数</div>
                  <div style="width:6px;height:6px;background:#007DFF;border-radius:50%;display:inline-block;"></div>
                  <span style="color:#949494;margin:0 5px">资源种类</span>
                  <span style="color:#000">${val[0].value}</span>
                </div>`
      }
    },
4.x轴和y轴顶端的名字,分别在x和y设置nane即可
xAxis: [
      {
        type: 'category',
        name: "月",
        data: ['01', '02', '03', '04', '05', '07', '07', '08', '09', '10', '11', '12']
      },
    ],
    yAxis: {
      type: 'value',
      name: "数量(K)",
      splitLine: {
        show: true,
        lineStyle: {
          type: 'dashed'
        }
      }
    },
5.单个柱子设置颜色
series: [
    {
      data: [
        120,
        {
          value: 200,
          itemStyle: {
            color: '#a90000'
          }
        },
        150,
        80,
        70,
        110,
        130
      ],
      type: 'bar'
    }
  ]
或者
series: [
                {
                    data: [],
                    type: 'bar',
                    showBackground: true,
                    backgroundStyle: {
                        color: 'rgba(111, 162, 135, 0.2)'
                    },
                    itemStyle: {
                        normal: {
                            //这里是颜色
                            color: function(params) {
                                //注意,如果颜色太少的话,后面颜色不会自动循环,最好多定义几个颜色
                                var colorList = ['#00A3E0','#FFA100', '#ffc0cb', '#CCCCCC', '#BBFFAA','#749f83', '#ca8622'];
                                return colorList[params.dataIndex]
                            }
                        }
                    }
                }

            ]
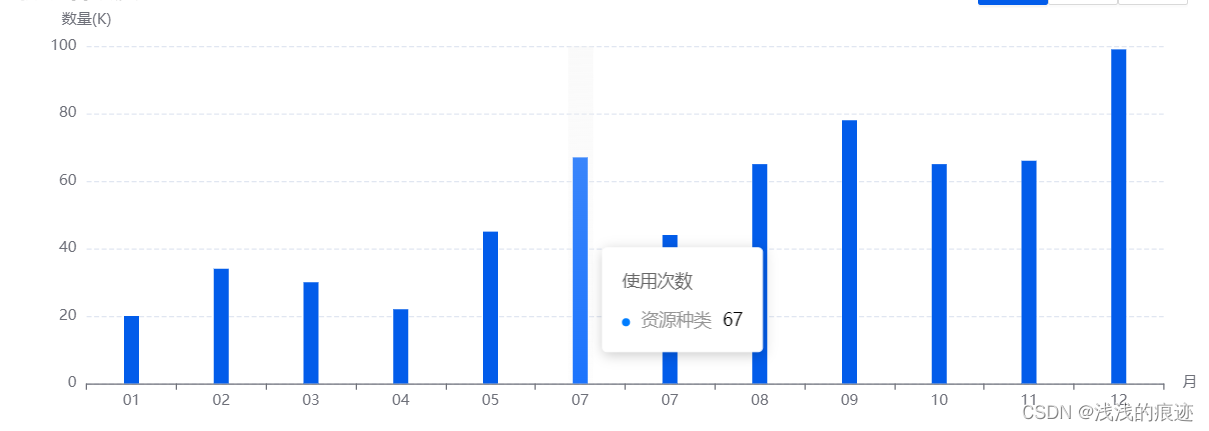
6.柱子的宽度和颜色分别是barWidth和itemStyle下的normal下的color
series: [
      {
        name: "资源种类",
        barWidth: 12,
        data: [20, 34, 30, 22, 45, 67, 44, 65, 78, 65, 66, 99],
        itemStyle: {
          normal: {
            color: "#025CEA"
          }
        },
        type: 'bar'
      },
    ]
7.效果图
二、折线图
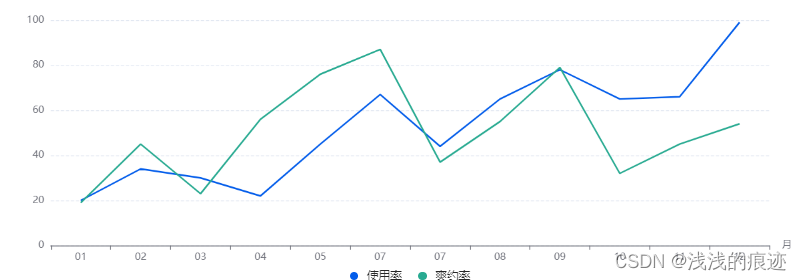
1.折线的颜色和小圆点的颜色,分别是lineStyle下的color和itemStyle下normal下的color,也可以像第二种那样设置,showSymbol: false 为鼠标没放上去时不显示小圆点。如果要平滑的话设置smooth: true。
series: [
{
data: [20, 34, 30, 22, 45, 67, 44, 65, 78, 65, 66, 99],
type: 'line',
name: "使用率",
lineStyle: {
color: "#025CEA"
},
itemStyle: {
normal: {
color: "#025CEA",
}
},
showSymbol: false
},
{
data: [19, 45, 23, 56, 76, 87, 37, 55, 79, 32, 45, 54],
type: 'line',
name: "爽约率",
smooth: true,
itemStyle: {
normal: {
color: "#28AA91",
lineStyle: {
color: "#28AA91"
},
}
},
showSymbol: false
},
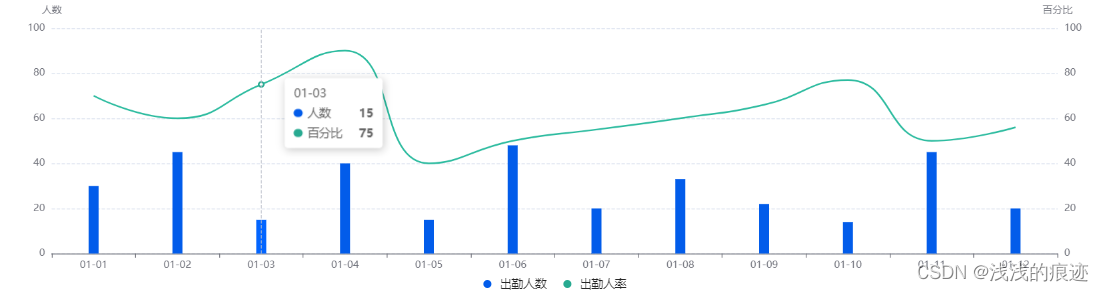
]2.设置两个不同的y坐标,最小值min,最大值max。
注意:如果想要第二个数据以右边刻度为准,需要在第二个里面加上yAxisIndex: 1,
yAxis: [
      {
        type: 'value',
        name: "人数",
        splitLine: {
          show: true,
          lineStyle: {
            type: 'dashed'
          }
        }
      },
      {
        type: 'value',
        name: "百分比",
        yAxisIndex: 1, //-------------------------->(添加这个属性即可!!!!)
        min: 0,
        max: 100,
        splitLine: {
          show: true,
          lineStyle: {
            type: 'dashed'
          }
        }
      }
    ],
3.让整个echarts图铺满div容器
注意:如果想要横纵坐标都显示要加 containLabel: true
const option = {
    // backgroundColor: '#2c343c',
    grid: {
      top: "10px",
      left: "0px",
      right: "0px",
      bottom: "50px",
      containLabel: true
    },
}
4.效果,有些属性也跟柱状图相通的
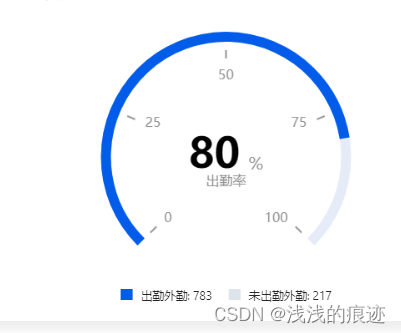
三、仪表盘
完整代码,后面的位置可以在这里对比
series: [
      {
        min: 0,
        max: 100,
        splitNumber: 4,  //仪表盘分割段数
        type: 'gauge',
        progress: {
          show: true,
          width: 12,
          itemStyle: {
            color: "#025CEA"
          }
        },
        axisLine: {
          lineStyle: {
            width: 12,
          }
        },
        axisTick: {
          show: false
        },
        pointer: {
          show: false
        },
        splitLine: {
          // show:false,
          length: 10,
          lineStyle: {
            width: 2,
            color: '#949494'
          }
        },
        axisLabel: {
          distance: 25,
          color: '#949494',
          fontSize: 16
        },
        title: {
          offsetCenter: [0, '20%'],
          color: "#949494"
        },
        detail: {
          valueAnimation: true,
          formatter: (value) => {
            return '{value|' + value.toFixed(0) + '}{unit|%}';
          },
          offsetCenter: [0, '0%'],
          rich: {
            value: {
              fontSize: 50,
              fontWeight: 'bolder',
              color: '#000'
            },
            unit: {
              fontSize: 20,
              color: '#949494',
              padding: [0, 0, -20, 10]
            }
          }
        },
        data: [
          {
            value: 80,
            name: '出勤率'
          }
        ]
      }
    ]
1.进度条的颜色大小
 progress: {
          show: true,
          width: 12,
          itemStyle: {
            color: "#025CEA"
          }
        },
2.仪表盘的刻度
 min: 0,
 max: 100,
 splitNumber: 4,  //仪表盘分割段数
3.背景环的大小
axisLine: {
  lineStyle: {
    width: 12,
 }
}
4.指针
 pointer: {
          show: false
   },
5.刻度的颜色大小和长度
splitLine: {
          // show:false,
          length: 10,
          lineStyle: {
            width: 2,
            color: '#949494'
          }
        },
6.数值的颜色大小,距离刻度的距离
 axisLabel: {
          distance: 25,
          color: '#949494',
          fontSize: 16
        },
7.标题的颜色和位置
 title: {
          offsetCenter: [0, '20%'],
          color: "#949494"
        },
8.具体值和单位的颜色大小
detail: {
          valueAnimation: true,
          formatter: (value) => {
            return '{value|' + value.toFixed(0) + '}{unit|%}';
          },
          offsetCenter: [0, '0%'],
          rich: {
            value: {
              fontSize: 50,
              fontWeight: 'bolder',
              color: '#000'
            },
            unit: {
              fontSize: 20,
              color: '#949494',
              padding: [0, 0, -20, 10]
            }
          }
        },
9.数值和标题
data: [
          {
            value: 80,
            name: '出勤率'
          }
        ]
10.效果


 1817
1817


 被折叠的 条评论
为什么被折叠?
被折叠的 条评论
为什么被折叠?
 到【灌水乐园】发言


