


如图所示:
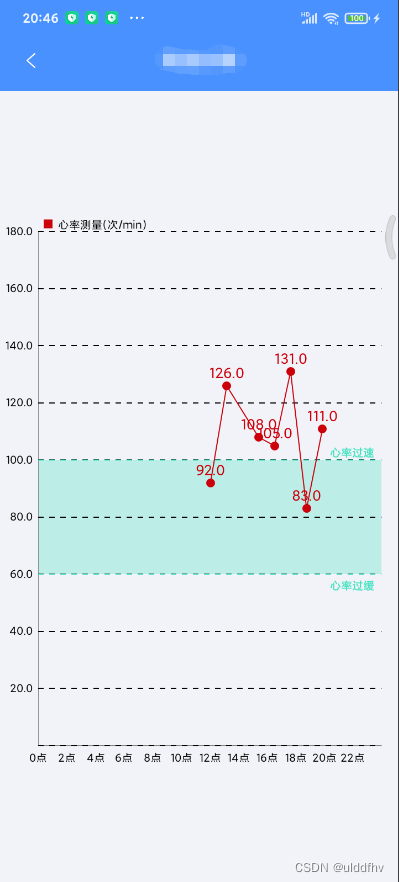
1.心率图
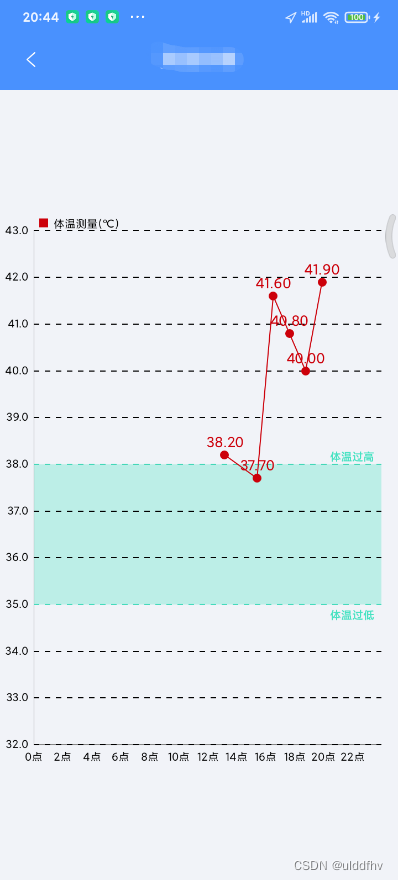
2.体温图
下面是代码:
  ArrayList<Entry> valuesResp = new ArrayList<Entry>();
    /**
     * @param type 0.心率  1.体温
     *  创建折线图
     * */
    private void initLineChart(int type,List<TempHeartAlertModel> resData){
        int totalMinutes = 1440; // 总共的分钟数
        int intervalInMinutes = 120; // 标签间隔为 2 小时
        int labelCount = totalMinutes / intervalInMinutes; // 计算标签数量
        float granularity = (float)intervalInMinutes; // 标签间隔,单位是分钟

        // background color
//        lineChart.setBackgroundColor(Color.WHITE);

        // disable description text
        lineChart.getDescription().setEnabled(false);

        //设置Legend
        lineChart.getLegend().setDirection(Legend.LegendDirection.LEFT_TO_RIGHT);
        lineChart.getLegend().setOrientation(Legend.LegendOrientation.HORIZONTAL);
        lineChart.getLegend().setVerticalAlignment(Legend.LegendVerticalAlignment.TOP);


        // enable touch gestures
        lineChart.setTouchEnabled(true);

        // set listeners
        lineChart.setDrawGridBackground(false);
        // create marker to display box when values are selected
//       MyMarkerView mv = new MyMarkerView(this, R.layout.custom_marker_view);
//        // Set the marker to the chart
//       mv.setChartView(lineChart);
//       lineChart.setMarker(mv);
//
//       lineChart.setOnChartValueSelectedListener(new OnChartValueSelectedListener() {
//           @Override
//           public void onValueSelected(Entry e, Highlight h) {
//               lineChart.centerViewToAnimated(e.getX(), e.getY(), lineChart.getData().getDataSetByIndex(h.getDataSetIndex()).getAxisDependency(), 500);
//           }
//
//           @Override
//           public void onNothingSelected() {
//
//           }
//       });

        // enable scaling and dragging
        lineChart.setDragEnabled(false);
        lineChart.setScaleEnabled(false);
        // chart.setScaleXEnabled(true);
        // chart.setScaleYEnabled(true);

        // force pinch zoom along both axis
        lineChart.setPinchZoom(false);

        // // Y-Axis Style // //
        YAxis yAxis = lineChart.getAxisLeft();
        // disable dual axis (only use LEFT axis)
        lineChart.getAxisRight().setEnabled(false);
        // horizontal grid lines
//        yAxis.setSpaceBottom(0);

        yAxis.setDrawLimitLinesBehindData(true);
        yAxis.setDrawZeroLine(false);

    /**
     * 绘制虚线网格线,
     * DashPathEffect:
     * @params:new float[]{30,20,30,20}   先绘制30px实线,再绘制20px透明,再绘制30px实线,再绘制20px透明
     * @params:0  偏移量,若为20,则效果为:先绘制10px实线,再绘制20px透明,再绘制30px实线,再绘制20px透明
     */
        yAxis.setGridDashedLine(new DashPathEffect(new float[]{30,20,30,20},0));
        // axis range
        if (type==0){       //心率
            yAxis.setAxisMinimum(0f);       //设置Y轴最小值
            yAxis.setAxisMaximum(180f);     //设置Y轴最大值
            yAxis.setLabelCount(10);          //设置Y轴标签数
            yAxis.setGranularity(20f);       //设置Y轴标签单位间隔
             // 限制线
            addChartLimitLine(yAxis, 60f, "心率过缓",LimitLine.LimitLabelPosition.RIGHT_BOTTOM);
            addChartLimitLine(yAxis, 100f, "心率过速",LimitLine.LimitLabelPosition.RIGHT_TOP);

            lineChart.getAxisLeft().setDrawLabels(true);
            lineChart.getAxisLeft().setDrawTopYLabelEntry(true);
            lineChart.getAxisLeft().setPosition(YAxis.YAxisLabelPosition.OUTSIDE_CHART);

            //设置数据数据
            for (int i=0;i<resData.size();i++){
                long reportTime = resData.get(i).getReportTime();
                String hms = DateUtils.getHmsByLongMills(reportTime);
                String[] split = hms.split(":");
                Integer heart = resData.get(i).getHeart();
                int vX= Integer.parseInt(split[0])*60+Integer.parseInt(split[1]);
                float vY= Float.parseFloat(heart.toString());
                valuesResp.add(new Entry(vX,vY));
            }
        }else {              //体温
            yAxis.setAxisMinimum(32f);  //设置Y轴最小值
            yAxis.setAxisMaximum(43f);  //设置Y轴最大值
            yAxis.setLabelCount(11);      //设置Y轴标签数
            yAxis.setGranularity(1f);   //设置Y轴标签单位间隔
             // 限制线
            addChartLimitLine(yAxis, 35f, "体温过低",LimitLine.LimitLabelPosition.RIGHT_BOTTOM);
            addChartLimitLine(yAxis, 38f, "体温过高",LimitLine.LimitLabelPosition.RIGHT_TOP);

            lineChart.getAxisLeft().setDrawLabels(true);
            lineChart.getAxisLeft().setDrawTopYLabelEntry(true);
            lineChart.getAxisLeft().setPosition(YAxis.YAxisLabelPosition.OUTSIDE_CHART);


            for (int i=0;i<resData.size();i++){
                long reportTime = resData.get(i).getReportTime();
                String hms = DateUtils.getHmsByLongMills(reportTime);
                String[] split = hms.split(":");
                float temp = resData.get(i).getTemp();
                int vX= Integer.parseInt(split[0])*60+Integer.parseInt(split[1]);
                valuesResp.add(new Entry(vX,temp));
            }
        }

        XAxis xAxis = lineChart.getXAxis();    // 获取X轴
        xAxis.setPosition(XAxis.XAxisPosition.BOTTOM);  // X轴绘制位置,默认是顶部
        xAxis.setDrawGridLines(false);   //不绘制x轴格网线
        //x坐标轴设置  下面几个属性很重要
        xAxis.setAxisMinimum(0f);           //设置x轴最小值
        xAxis.setAxisMaximum(1440f);        //设置x轴最大值
        xAxis.setLabelCount(labelCount);    //设置x轴显示的标签个数
        xAxis.setGranularity(granularity); //设置最小间隔,
        xAxis.setAxisLineWidth(1f);//设置x轴宽度, ...其他样式、
        xAxis.setDrawLabels(true);
        xAxis.setCenterAxisLabels(false);//x轴居中显示
        xAxis.setValueFormatter(new ValueFormatter() {
            @Override
            public String getFormattedValue(float value) {
                int hours = (int)(value / 60); // 将分钟转换成小时
                int minutes = (int)(value % 60); // 获取剩余的分钟数
                if (hours == 24) { // 如果是 24 小时,返回空字符串,表示不显示标签
                    return "";
                } else {
                    return hours+"点"; // 将小时和分钟格式化为字符串
                }
            }
        });

        //y轴设置
        yAxis.setPosition(YAxis.YAxisLabelPosition.OUTSIDE_CHART);//y轴标签绘制的位置
        yAxis.setDrawGridLines(true); // 显示Y轴网格线
        yAxis.setGridColor(Color.BLACK); // 线条颜色
        yAxis.setGridLineWidth(1f); // 线条宽度
        yAxis.enableGridDashedLine(10f, 10f, 0f);  // 线条为虚线
        yAxis.setValueFormatter(new ValueFormatter() {
            @Override
            public String getFormattedValue(float value) {
                 if (value>0){
                     return String.valueOf(value);
                 }else {
                     return "";
                 }
            }
        });

        LineDataSet dataSets;
        //设置数据
            if (lineChart.getData() != null && lineChart.getData().getDataSetCount() > 0) {
                dataSets = (LineDataSet) lineChart.getData().getDataSetByIndex(0);
                dataSets.setValues(valuesResp);

                lineChart.getData().notifyDataChanged();
                lineChart.notifyDataSetChanged();
            } else {
                //创建一个数据集,并给它一个类型
                dataSets = new LineDataSet(valuesResp,type==0?"心率测量(次/min)":"体温测量(℃)");

                dataSets.setColor(getResources().getColor(R.color.red));
                dataSets.setLineWidth(1f);
                dataSets.setDrawCircleHole(false);
                dataSets.setCircleColor(getResources().getColor(R.color.red));
                dataSets.setValueTextSize(13f);
                dataSets.setValueTextColor(getResources().getColor(R.color.red));
                dataSets.setDrawValues(true);
                //填充两条限制线之间的背景颜色
                lineChart.setBackground(new Drawable() {
                    @Override
                    public void draw(@NonNull Canvas canvas) {
                        Paint paint = new Paint();
                        paint.setStyle(Paint.Style.FILL);
                        paint.setColor(COLOR_LIMIT);
                        paint.setAlpha(80);
                        //获取X轴的最小值
                        float xChartMin = lineChart.getXChartMin();
                        //获取X轴的最大值
                        float xChartMax = lineChart.getXChartMax();
                        //获取X轴的最小值的屏幕横坐标
                        double xMin = lineChart.getTransformer(lineChart.getAxis(YAxis.AxisDependency.LEFT).getAxisDependency()).getPixelForValues(xChartMin, 0).x;
                        //获取X轴的最大值的屏幕横坐标
                        double xMax= lineChart.getTransformer(lineChart.getAxis(YAxis.AxisDependency.RIGHT).getAxisDependency()).getPixelForValues(xChartMax, 0).x;
                        //获取第一条限制线
                        LimitLine limitLine0 = lineChart.getAxisLeft().getLimitLines().get(0);
                        //获取第二条限制线
                        LimitLine limitLine1 = lineChart.getAxisLeft().getLimitLines().get(1);
                        //获取第一条限制线的屏幕纵坐标
                        double y0 = lineChart.getTransformer(lineChart.getAxis(YAxis.AxisDependency.LEFT).getAxisDependency()).getPixelForValues(xChartMin, limitLine0.getLimit()).y;
                        //获取第二条限制线的屏幕纵坐标
                        double y1 = lineChart.getTransformer(lineChart.getAxis(YAxis.AxisDependency.LEFT).getAxisDependency()).getPixelForValues(xChartMin, limitLine1.getLimit()).y;

                        canvas.drawRect(Float.parseFloat(String.valueOf(xMin)),Float.parseFloat(String.valueOf(y0)),Float.parseFloat(String.valueOf(xMax)),Float.parseFloat(String.valueOf(y1)),paint);
                    }

                    @Override
                    public void setAlpha(int alpha) {

                    }

                    @Override
                    public void setColorFilter(@Nullable ColorFilter colorFilter) {

                    }

                    @Override
                    public int getOpacity() {
                        return PixelFormat.OPAQUE;
                    }
                });

                LineData data = new LineData(dataSets);
                //设置数据
                lineChart.setData(data);
            }

        lineChart.invalidate();
    }


 /**
     * 设置限制线
     * @param limitValue 限制线的值
     * @param labelContent 限制线标签内容
     * @param pos 限制线标签相对于限制线的位置
     */
    private int COLOR_LIMIT=Color.parseColor("#48e2c2");
    private void addChartLimitLine(YAxis yAxis, float limitValue, String labelContent, LimitLine.LimitLabelPosition pos) {
        // 添加限制线到轴上
        LimitLine mLimitLine = new LimitLine(limitValue, labelContent);
        mLimitLine.setLineColor(COLOR_LIMIT);  //设置限制线颜色
        mLimitLine.enableDashedLine(10f, 10f, 0f);   //设置限制线为虚线
        mLimitLine.setTextColor(COLOR_LIMIT);
        mLimitLine.setLabelPosition(pos);
        yAxis.setDrawLimitLinesBehindData(true); // 将限制线绘制在数据之后
        yAxis.addLimitLine(mLimitLine);
    }
MyMarkerView
public class MyMarkerView extends MarkerView {

    private final TextView tvContent;

    public MyMarkerView(Context context, int layoutResource) {
        super(context, layoutResource);

        tvContent = findViewById(R.id.tvContent);
    }

    // runs every time the MarkerView is redrawn, can be used to update the
    // content (user-interface)
    @Override
    public void refreshContent(Entry e, Highlight highlight) {

        if (e instanceof CandleEntry) {

            CandleEntry ce = (CandleEntry) e;

            tvContent.setText(Utils.formatNumber(ce.getHigh(), 0, true));
        } else {


//            tvContent.setText(Utils.formatNumber(e.getY(), 0, true));
            float x = e.getX();
            float hour= x/60;
            tvContent.setText(saveNeedFormat(hour)); //修改为显示x轴的值
        }

        super.refreshContent(e, highlight);
    }

    @Override
//    public MPPointF getOffset() {
//        return new MPPointF(-(getWidth() / 2), -getHeight());
//    }
    public MPPointF getOffset() {
        //修改为自己需要的
        return new MPPointF(-(getWidth() / 2), -getHeight()-30);
    }


    public String saveNeedFormat(float number){
        DecimalFormat decimalFormat = new DecimalFormat("#.##");
        String formattedNumber = decimalFormat.format(number);
        String replace = formattedNumber.replace(".", ":");
        return replace;
    }

}
MarkView布局文件
<?xml version="1.0" encoding="utf-8"?>
<RelativeLayout xmlns:android="http://schemas.android.com/apk/res/android"
    xmlns:tools="http://schemas.android.com/tools"
    android:layout_width="50dp"
    android:layout_height="40dp"
    android:background="@drawable/marker2"
    tools:ignore="Overdraw">

    <TextView
        android:id="@+id/tvContent"
        android:layout_width="wrap_content"
        android:layout_height="wrap_content"
        android:layout_centerHorizontal="true"
        android:layout_marginTop="7dp"
        android:layout_marginLeft="5dp"
        android:layout_marginRight="5dp"
        android:text=""
        android:textSize="12sp"
        android:textColor="@android:color/white"
        android:ellipsize="end"
        android:singleLine="true"
        android:textAppearance="?android:attr/textAppearanceSmall" />

</RelativeLayout>
marker2.png


 1550
1550


 被折叠的 条评论
为什么被折叠?
被折叠的 条评论
为什么被折叠?
 到【灌水乐园】发言


