


先借助配色网站coolors,调整saturation, brightness和temperature,配出默认色加深色,颜色代码如下
export const HighchartColorsEnum = [
    '#7cb5ec',
    '#90ed7d',
    '#f7a35c',
    '#8085e9',
    '#f15c80',
    '#e4d354',
    '#2b908f',
    '#f45b5b',
    '#91e8e1'
  ]

  // brightness: -50, temperature 10, saturation 0
export const HighchartColorsDarkEnum = [
  '#245591',
  '#409020',
  '#A14708',
  '#2B258D',
  '#980D2B',
  '#877015',
  '#1B4343',
  '#9D0B0B',
  '#2D8F87'
]
效果如下

在Highcharts中,线条分色的配置项是series.line.zones
An array defining zones within a series. Zones can be applied to the X axis, Y axis or Z axis for bubbles, according to the zoneAxis option. The zone definitions have to be in ascending order regarding to the value.
如何配置可以查阅该示例,我们将zoneAxis设置成横轴坐标轴,然后将数据按照时间进行分区,分为以下三个区域
0:00-8:59 夜盘
9:00-19:00 日盘
19:00-23:59 夜盘
计算最小的最大的timestamp对应的年月日为startDate, endDate,days为开始和结束之间相隔的天数,我们再循环内,针对每一天进行时间的分区,算法如下
getZones(res, index) {
      const zones = []
      if (res.values && res.values.length) {
        const startTimeStamp = res.values[0][0]
        const startMoment = moment(startTimeStamp)
        const endTimeStamp = res.values[res.values.length -1][0]
        const startDate = {
          year: startMoment.year(),
          month: startMoment.month(),
          day: startMoment.date()
        }
        const days = Math.ceil((endTimeStamp - startTimeStamp) / (1000 * 3600 * 24))

        for (let i = 0; i < days + 1; i++) {
          zones.push(...[{
              value: Date.UTC(startDate.year, startDate.month, startDate.day + i, 0, 0),
              color: HighchartColorsEnum[index]
            }, {
              value: Date.UTC(startDate.year, startDate.month, startDate.day + i, 8, 59),
              color: HighchartColorsEnum[index]
            }, {
              value: Date.UTC(startDate.year, startDate.month, startDate.day + i, 19, 0),
              color: HighchartColorsDarkEnum[index]
            }, {
              value: Date.UTC(startDate.year, startDate.month, startDate.day + i, 23, 59),
              color: HighchartColorsEnum[index]
            }
          ])
        }
      }
      return zones
    }
在series.line配置
{
    zoneAxis: 'x',
    yAxis: index % 2,
    data: [],
    name: `${res.strategy}.${res.data_name}`,
    tooltip: { valueDecimals: 4 },
    type: 'line',
    data: res.values,
    zones: day_night ? this.getZones(res, index) : []
}
这里的res是接口返回的数据,示例如下
{
"values": [
[
1702558813000,
0.5
],
[
1702558824000,
0.5
],
[
1702558836000,
0.5
],
[
1702558848000,
0.5
],
[
1702558860000,
0.5
],
[
1702558872000,
0.533059
],
[
1702558887000,
0.535286
],
[
1702558900000,
0.535286
],
[
1702558911000,
0.533924
],
[
1702558924000,
0.532048
],
[
1702558938000,
0.533799
],
[
1702558950000,
0.53583
],
[
1702558963000,
0.53935
],
[
1702558974000,
0.543211
],
[
1702558985000,
0.543905
],
[
1702558998000,
0.542447
],
[
1702559013000,
0.538705
],
[
1702559025000,
0.534785
],
[
1702559036000,
0.535363
],
[
1702559063000,
0.536544
],
[
1702559076000,
0.537351
],
[
1702559089000,
0.536926
],
[
1702559101000,
0.538045
],
[
1702559112000,
0.539609
],
[
1702559124000,
0.54059
],
[
1702559137000,
0.541295
],
[
1702559148000,
0.540882
]
],
"strategy": "***",
"data_name": "***"
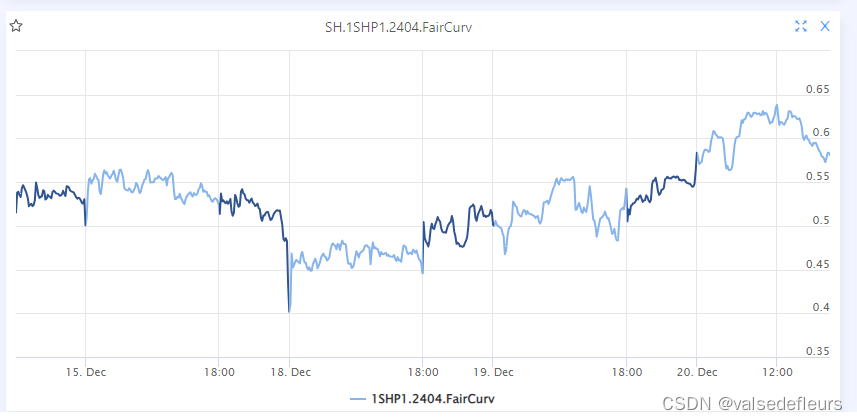
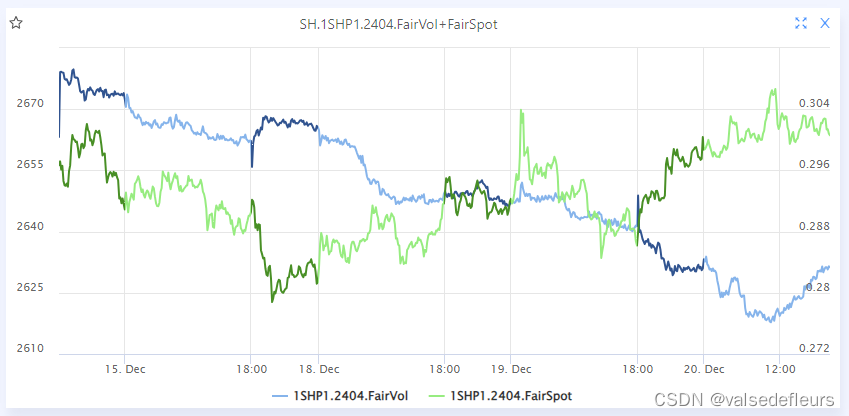
}最后效果如下:
推荐下列配色网站:
-
Material Palette:https://www.materialpalette.com
-
Flat UI Colors: Flat UI Colors 2 - 14 Color Palettes, 280 colors 🎨
-
Brand Colors: BrandColors - official brand color hex codes
-
中国风配色: http://zhongguose.com
-
uiGradients: http://uigradients.com


 1402
1402


 被折叠的 条评论
为什么被折叠?
被折叠的 条评论
为什么被折叠?
 到【灌水乐园】发言


