


知识要点
canvas中的坐标是从左上角开始的,x轴沿着水平方向(按像素)向右延伸,y轴沿垂直方向向下延伸。左上角坐标为x=0,y=0的点称作原点。在默认坐标系中,每一个点的坐标都是直接映射到一个CSS像素上。
代码
对于canvas的初学者,我们可以在绘制坐标系来辅助canvas设计,以下是一段示例代码:
HTML
<div id="coordinates">X: 0, Y: 0</div>
<canvas id="canvas" width="800" height="600" style="border:1px solid #000;"></canvas>
JavaScript
const canvas = document.getElementById('canvas');
const ctx = canvas.getContext('2d');
const coordinatesDiv = document.getElementById('coordinates');
// 绘制箭头
function drawArrow(fromX, fromY, toX, toY, label) {
const headlen = 10; // 箭头长度
const angle = Math.atan2(toY - fromY, toX - fromX);
ctx.beginPath();
ctx.moveTo(fromX, fromY);
ctx.lineTo(toX, toY);
ctx.lineTo(toX - headlen * Math.cos(angle - Math.PI / 6), toY - headlen * Math.sin(angle - Math.PI / 6));
ctx.moveTo(toX, toY);
ctx.lineTo(toX - headlen * Math.cos(angle + Math.PI / 6), toY - headlen * Math.sin(angle + Math.PI / 6));
ctx.stroke();
ctx.font = "16px Arial";
ctx.fillText(label, toX + (label === 'X' ? -20 : 10), toY + (label === 'Y' ? -10 : 20));
}
// 绘制坐标轴
function drawAxes() {
const width = canvas.width;
const height = canvas.height;
// X轴
ctx.beginPath();
ctx.moveTo(0, 0);
ctx.lineTo(width, 0);
ctx.strokeStyle = 'black';
ctx.lineWidth = 2;
ctx.stroke();
drawArrow(0, 0, width, 0, 'X');
// Y轴
ctx.beginPath();
ctx.moveTo(0, 0);
ctx.lineTo(0, height);
ctx.strokeStyle = 'black';
ctx.lineWidth = 2;
ctx.stroke();
drawArrow(0, 0, 0, height, 'Y');
}
// 绘制坐标刻度
function drawTicks() {
const width = canvas.width;
const height = canvas.height;
// X轴刻度
for (let i = 0; i < width; i += 50) {
ctx.beginPath();
ctx.moveTo(i, -5);
ctx.lineTo(i, 5);
ctx.strokeStyle = 'black';
ctx.lineWidth = 1;
ctx.fillText(i, i - 8, 20); // X轴刻度数值
ctx.stroke();
}
// Y轴刻度
for (let i = 0; i < height; i += 50) {
ctx.beginPath();
ctx.moveTo(- 5, i);
ctx.lineTo(+ 5, i);
ctx.strokeStyle = 'black';
ctx.lineWidth = 1;
ctx.fillText(i, 8, i + 8); // Y轴刻度数值
ctx.stroke();
}
}
// 绘制坐标系
function drawCoordinateSystem() {
drawAxes();
drawTicks();
}
drawCoordinateSystem();
// 更新坐标显示
function updateCoordinatesDisplay(x, y) {
coordinatesDiv.textContent = `X: ${x}, Y: ${y}`;
}
// 处理鼠标移动事件
canvas.addEventListener('mousemove', (event) => {
const rect = canvas.getBoundingClientRect();
const x = event.clientX - rect.left;
const y = event.clientY - rect.top;
updateCoordinatesDisplay(x, y);
});
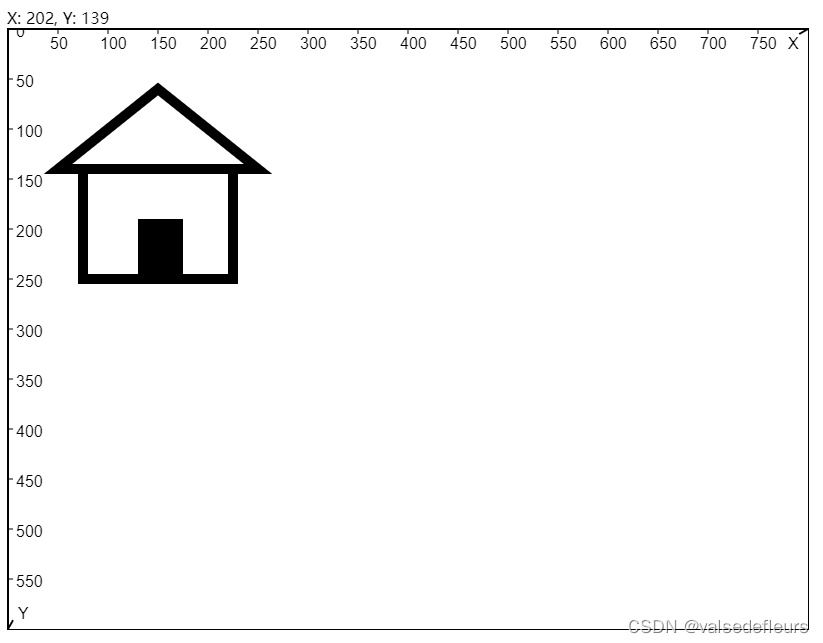
// 以下代码是实例,你可以写自己的代码
function drawHouse() {
// Set line width
ctx.lineWidth = 10;
// Wall
ctx.strokeRect(75, 140, 150, 110);
// Door
ctx.fillRect(130, 190, 45, 65);
// Roof
ctx.beginPath();
ctx.moveTo(50, 140);
ctx.lineTo(150, 60);
ctx.lineTo(250, 140);
ctx.closePath();
ctx.stroke();
}
drawHouse()
完整的示例请查看Codepen
效果


 1622
1622

 被折叠的 条评论
为什么被折叠?
被折叠的 条评论
为什么被折叠?
 到【灌水乐园】发言


