


 本文详细介绍MySQL的Profiling功能,从开启到关闭的全流程,以及如何分析SQL执行状态、系统锁和表锁的时间消耗,帮助定位SQL语句的I/O和CPU消耗。适用于MySQL5.0.3及以上版本,特别指出在5.7版本后,Profiling信息将被Performance Schema替代。
一。前言
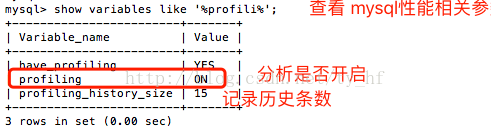
当我们要对某一条sql的性能进行分析时,可以使用它。
Profiling是从 mysql5.0.3版本以后才开放的。
启动profile之后,所有查询包括错误的语句都会记录在内。
关闭会话或者set profiling=0 就关闭了。(如果将profiling_history_size参数设置为0,同样具有关闭MySQL的profiling效果。)
此工具可用来查询SQL执行状态,System lock和Table lock 花多少时间等等,
对定位一条语句的I/O消耗和CPU消耗 非常重要。(SQL 语句执行所消耗的最大两部分资源就是IO和CPU)
--在mysql5.7之后,profile信息将逐渐被废弃,mysql推荐使用performance schema
二。流程
简易流程大概如下:
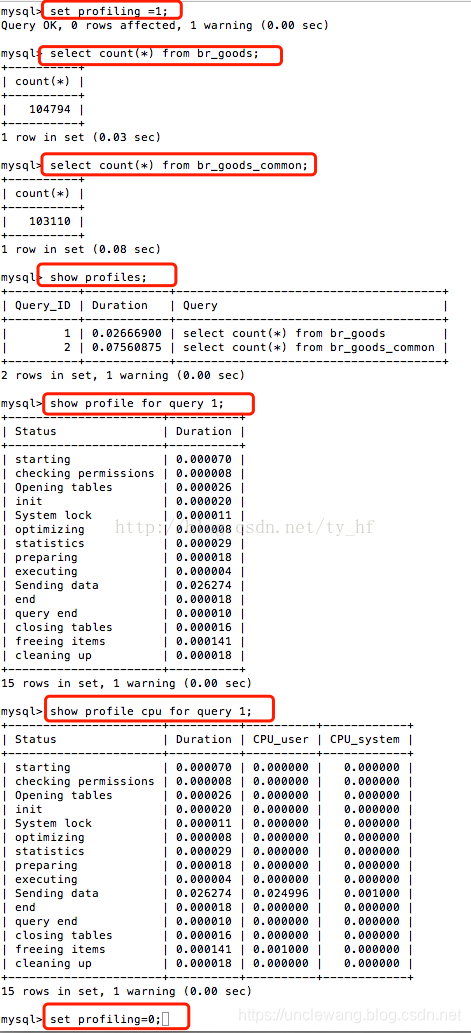
set profiling=1; //打开分析
run your sql1;
run your sql2;
show profiles; //查看sql1,sql2的语句分析
show profile for query 1; //查看sql1的具体分析
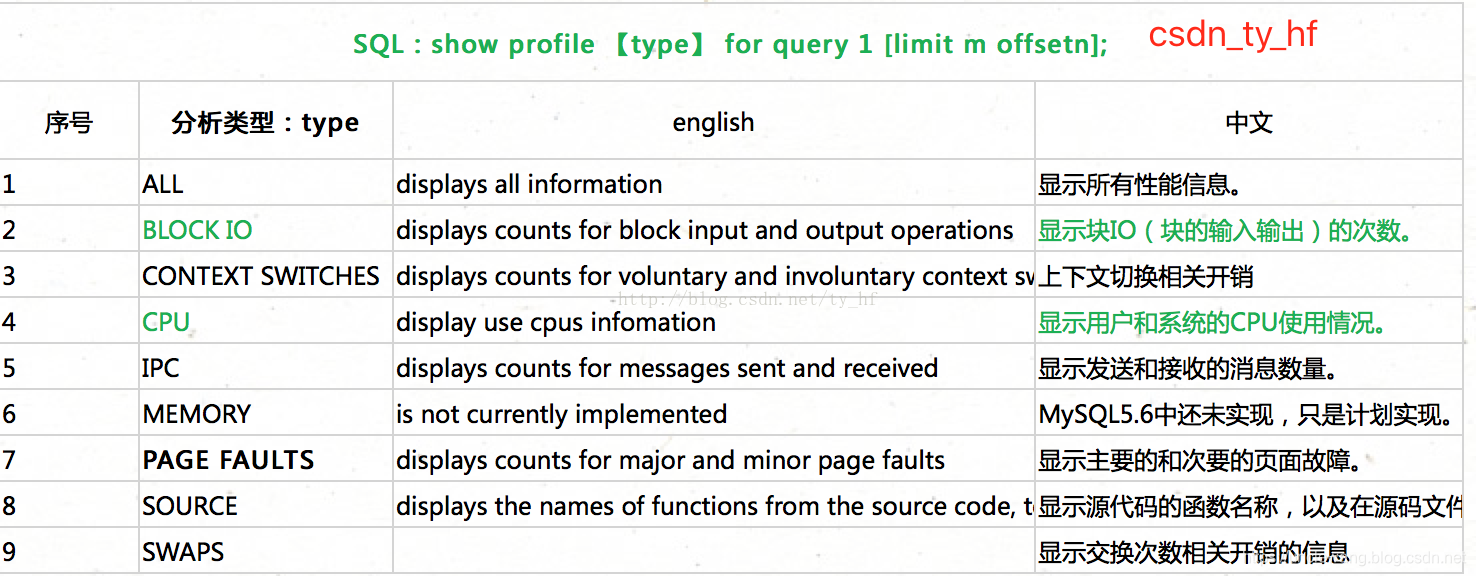
show profile ALL for query 1; //查看sql1相关的所有分析【主要看i/o与cpu,下边分析中有各项意义介绍】
set profiling=0; //关闭分析
三。含义分析
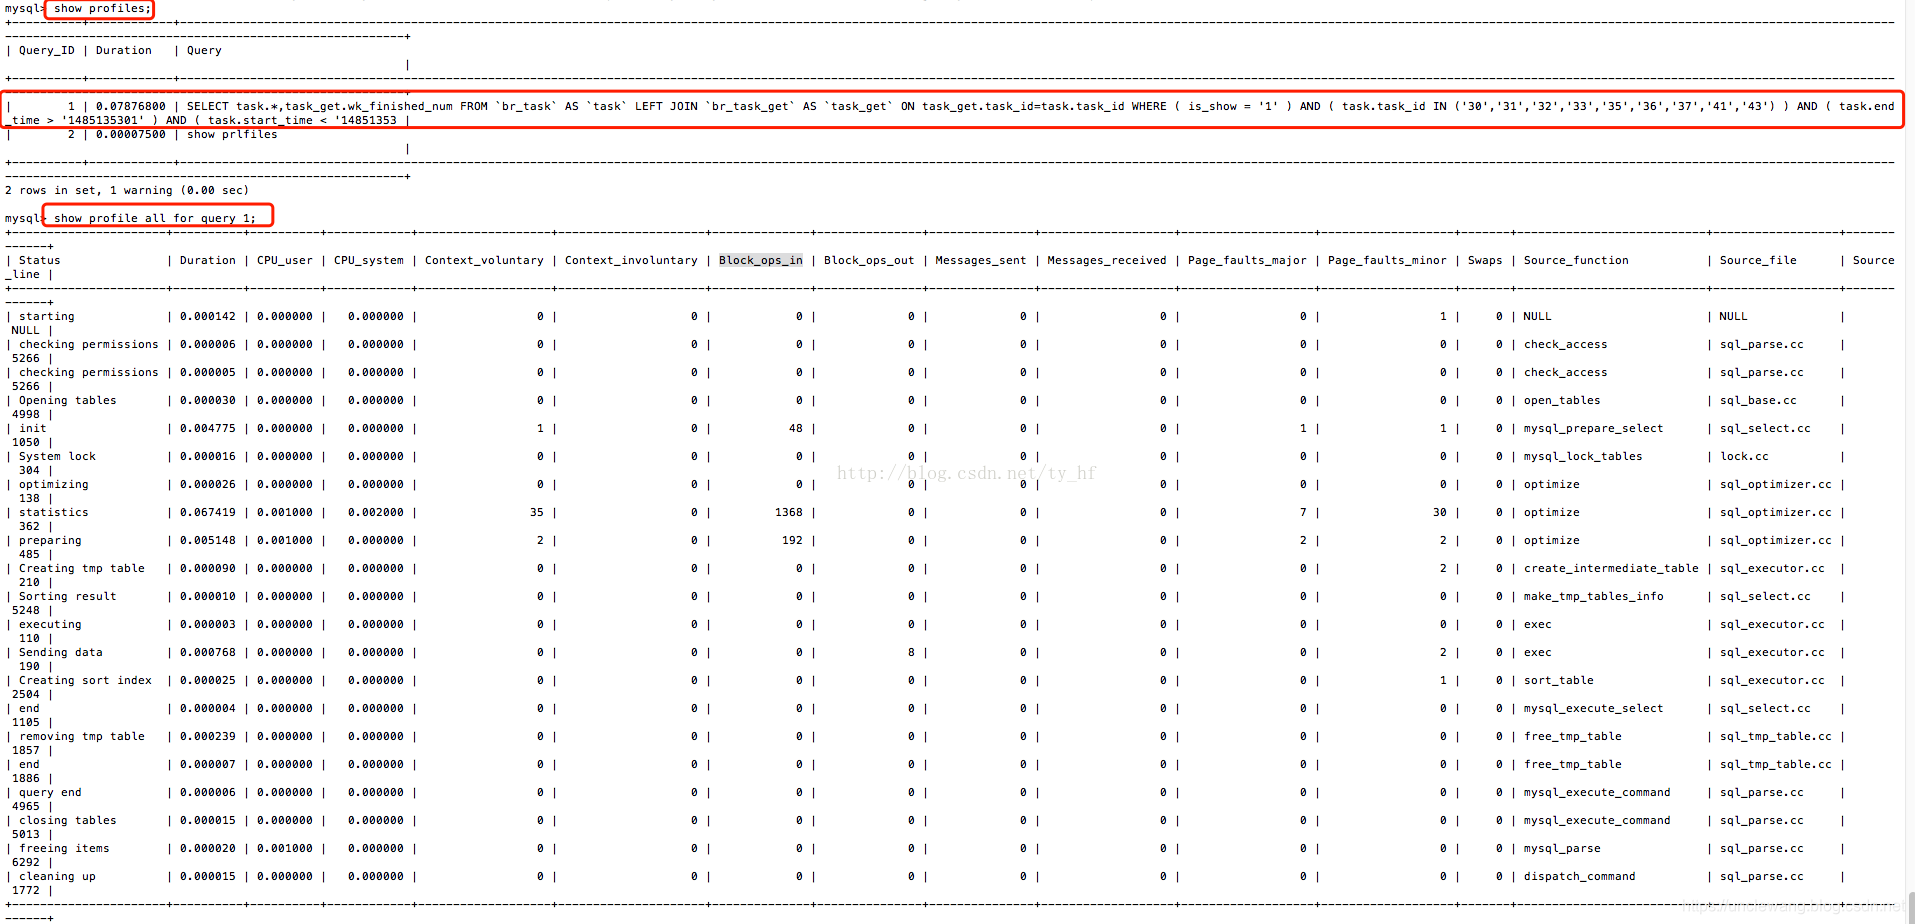
上图中横向栏意义
+----------------------+----------+----------+------------+
"Status": "query end", 状态
"Duration": "1.751142", 持续时间
"CPU_user": "0.008999", cpu用户
"CPU_system": "0.003999", cpu系统
"Context_voluntary": "98", 上下文主动切换
"Context_involuntary": "0", 上下文被动切换
"Block_ops_in": "8", 阻塞的输入操作
"Block_ops_out": "32", 阻塞的输出操作
"Messages_sent": "0", 消息发出
"Messages_received": "0", 消息接受
"Page_faults_major": "0", 主分页错误
"Page_faults_minor": "0", 次分页错误
"Swaps": "0", 交换次数
"Source_function": "mysql_execute_command", 源功能
"Source_file": "sql_parse.cc", 源文件
"Source_line": "4465" 源代码行
+----------------------+----------+----------+------------+
上图中纵向栏意义
+----------------------+----------+----------+------------+
starting:开始
checking permissions:检查权限
Opening tables:打开表
init : 初始化
System lock :系统锁
optimizing : 优化
statistics : 统计
preparing :准备
executing :执行
Sending data :发送数据
Sorting result :排序
end :结束
query end :查询 结束
closing tables : 关闭表 /去除TMP 表
freeing items : 释放物品
cleaning up :清理
+----------------------+----------+----------+------------+
一般情况下,常用以下语句也就够了 :
mysql->SHOW profile CPU,BLOCK IO io FOR query 2;
四。相关外链
另外附上profiling 的学习质料
profiling 基础
http://www.tuicool.com/articles/ZFrUzia
http://www.xaprb.com/blog/2006/10/12/how-to-profile-a-query-in-mysql/
http://www.xaprb.com/blog/2006/10/15/a-case-study-in-profiling-queries-in-mysql/
http://www.xaprb.com/blog/2006/10/17/mysql-profiling-case-study-part-2/
profiling 进阶
http://www.mysqlperformanceblog.com/2009/01/19/profiling-mysql-stored-routines/
http://www.mysqlperformanceblog.com/2008/05/18/wanted-better-memory-profiling-for-mysql/maatkit–perldoc mk-query-profiler
profiling高级
http://dev.mysql.com/tech-resources/articles/pro-mysql-ch6.html
http://dev.mysql.com/tech-resources/articles/using-new-query-profiler.html
profiling骨灰级
http://www.scribd.com/doc/2669413/DTrace-and-MySQL-Presentation
http://forge.mysql.com/wiki/Using_DTrace_with_MySQL
http://wikis.sun.com/display/BluePrints/Optimizing+MySQL+Database+Application+Performan
http://blog.csdn.net/lihuayong/article/details/42044593


 1000
1000

 被折叠的 条评论
为什么被折叠?
被折叠的 条评论
为什么被折叠?
 到【灌水乐园】发言


