


附源代码
data:{
list:[//数据格式
{
"field_name": "~/Forms/frmTyForm.aspx?ObjectID=9157&ep=J%3D福建设计院|fstartyear%3d2020|endyear%3d2022",
"field_value": 1,
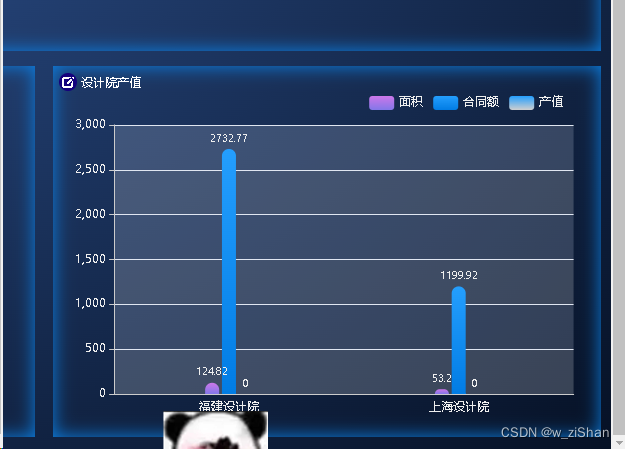
"name": "福建设计院",
"value1": 0,
"value2": 0,
"value3": 69.527311697975,
"value4": 2737.77,
"value5": 70.7563764292,
"value6": 128.72
},
{
"field_name": "~/Forms/frmTyForm.aspx?ObjectID=9157&ep=J%3D上海设计院|fstartyear%3d2020|endyear%3d2022",
"field_value": 2,
"name": "上海设计院",
"value1": 0,
"value2": 0,
"value3": 30.472688302025,
"value4": 1199.92,
"value5": 29.2436235708,
"value6": 53.2
}
]
}
methods:{
dataAll(list,chartId){
option = {
calculable: true,
legend: {
// 指示框名字 注意!要和下方series中的name一起改
data: ['面积', '合同额','产值'],
// 指示框位置 距离上下左右多少
right: '5%',
// top: '50%',
textStyle: {
color: '#eee' //字体颜色
}
},
xAxis: [
{
type: 'category',
data: list.map(item => {return item.name}),
axisLine: { //x轴线的颜色以及宽度
show: true, //是否显示X轴
lineStyle: {
color: "#ccc",
}
},
axisLabel: {
color: '#eee'
},
axisTick: {
//是否显示刻度线
show: false
},
}
],
yAxis: [
{
type: 'value',
axisTick: {
//y轴刻度线
show: true
},
axisLabel: {
color: '#eee'
},
axisLine: {
show: true, // Y轴
lineStyle: {
color: "#ccc",
}
},
splitArea : {show : true}
}
],
// 整体大小
grid: {
left: '3%',
right: '4%',
top: '10%',
bottom: '5%',
containLabel: true
},
series: [
{
barWidth: 14,//柱子宽度
name: '面积',
type: 'bar',
data: list.map(item => {return item.value6}),
itemStyle: {
//颜色样式部分
normal: {
barBorderRadius: [20, 20, 0, 0], //圆角[上左,上右,下右,下左]
label: {
show: true, //开启数字显示
position: 'top', //在上方显示数字
textStyle: { //数值样式
color: '#eee', //字体颜色
fontSize: 10 //字体大小
}
},
// 柱状图颜色渐变
color: new echarts.graphic.LinearGradient(0, 1, 0, 0, [
{ offset: 0, color: "#8277E9" },
{ offset: 1, color: "#CC77E9" },
]),
}
}
},
{
barWidth: 14,//柱子宽度
name: '合同额',
type: 'bar',
data: list.map(item => {return item.value4}),
itemStyle: {
//颜色样式部分
normal: {
barBorderRadius: [20, 20, 0, 0], //圆角[上左,上右,下右,下左]
label: {
show: true, //开启数字显示
position: 'top', //在上方显示数字
textStyle: { //数值样式
color: '#eee', //字体颜色
fontSize: 10 //字体大小
}
},
// 柱状图颜色渐变
color: new echarts.graphic.LinearGradient(0, 1, 0, 0, [
{ offset: 0, color: "#017CE4" },
{ offset: 1, color: "#249EFD" },
]),
}
}
},
{
barWidth: 14,//柱子宽度
name: '产值',
type: 'bar',
data: list.map(item => {return item.value2}),
itemStyle: {
//颜色样式部分
normal: {
barBorderRadius: [20, 20, 0, 0], //圆角[上左,上右,下右,下左]
label: {
show: true, //开启数字显示
position: 'top', //在上方显示数字
textStyle: { //数值样式
color: '#eee', //字体颜色
fontSize: 10 //字体大小
}
},
// 柱状图颜色渐变
color: new echarts.graphic.LinearGradient(0, 1, 0, 0, [
{ offset: 0, color: "#cfcfcf" },
{ offset: 1, color: "#249EFD" },
]),
}
}
}
]
}
var curChart = echarts.init(document.getElementById(chartId));
curChart.setOption(option);
curChart.on('click', onClickPieItem); //此处为图形点击事件 有多种方式
function onClickPieItem(param){
var data = param.data;
//218.6.62.85:66
var url = ".."
var url_si = data["field_name"]
var url_list = url_si.split('~')
url +=url_list[1]
openTab(url, '项目列表');
}
},
}


 2837
2837


 被折叠的 条评论
为什么被折叠?
被折叠的 条评论
为什么被折叠?
 到【灌水乐园】发言


