echarts+DateV.GeoAtlas 绘制地图

这篇教程介绍了如何结合Echarts和DateV.GeoAtlas来创建地图图形。通过导入Echarts组件和注册china.json数据,设置地图样式和配置项,实现了地图的展示。示例中展示了如何在React应用中初始化Echarts地图,并提供了详细的配置代码。注意,地图名称为'chinaMap'以避免显示南海缩略图。你可以根据Echarts的文档进一步定制图形。

DateV.GeoAtlas 使用教程地址:DataV.GeoAtlas地理小工具系列

echarts参考地址:Documentation - Apache ECharts

原理:

echarts做为图形绘制工具 配置参数进行绘制 

DateV.GeoAtlas提供json数据来源,提供无数个密密麻麻点点然后 绘制成 地图形状

示例:

从 DateV.GeoAtlas  上面的地址中下载json数据   命名:china.json

页面 index.jsx. (需要 给外层设置宽高)

import React, {useEffect} from 'react';
import * as echarts from 'echarts/core';
import { TitleComponent, TooltipComponent, GeoComponent, GridComponent, LegendComponent } from 'echarts/components';
import { ScatterChart } from 'echarts/charts';
import { CanvasRenderer } from 'echarts/renderers';
import { EffectScatterChart } from 'echarts/charts';
import { LinesChart } from 'echarts/charts';
import chinaMapJson from './china.json';


echarts.use([
    TitleComponent,
    TooltipComponent,
    GeoComponent,
    GridComponent,
    LegendComponent,
    ScatterChart,
    CanvasRenderer,
    EffectScatterChart,
    LinesChart,
]);
const EchartsMap = () => {

    useEffect(() => {

        const echartsConDom = document.getElementById('echarts-map');
        const myChart = echarts.init(echartsConDom); // 初始化
        echarts.registerMap('chinaMap', chinaMapJson);

        const series = [];

        const option = {
            backgroundColor: '#fff',

            geo: {
                map: 'chinaMap', // 地图选择
                // silent: true, // 禁止图形响应鼠标事件
                itemStyle: {
                    color: '#FFE8E7', // 背景颜色
                    borderColor: '#F7A6A3', // 边框颜色
                },
                label: {
                    show: false,
                },
                layoutCenter: ['50%', '65%'],
                layoutSize: 600,
                // zoom: 1.5, // 当前视角的缩放比例
                roam: true, // 是否开启鼠标缩放和平移漫游
                scaleLimit: {min: 1.2, max: 2}, // 滚轮缩放的极限控制
                // 高亮状态下的多边形和标签样式
                emphasis: {
                    label: {
                        show: true,
                    },
                    itemStyle: {
                        color: '#F7A6A3',
                    },
                },
            },
            tooltip: {
                formatter: function (params) {
                    return `${params.name}`;
                },
            },
            series: series,
            // 图例
            legend: {
                show: false, // 不展示默认样式,使用事件切换图例展示
                selectedMode: 'single', // 设置单选多选模式
            },
        };
        myChart.setOption(option);

    }, [])

    return <div className="echarts-map">
        <Layout>
        <div id="echarts-map" style={{ width: '100%', height: '600px' }}>

        </div>
        </Layout>
    </div>
};

export default EchartsMap;

具体的echarts配置可 根据echarts的配置项进行修改Documentation - Apache ECharts 参考

效果:

注意事项:registerMap的 名字为 “china”的话。会自动显示南海缩略图 如果不需要则可以换一个名字,我这里用的另外的名字(chinaMap)就没有缩略图
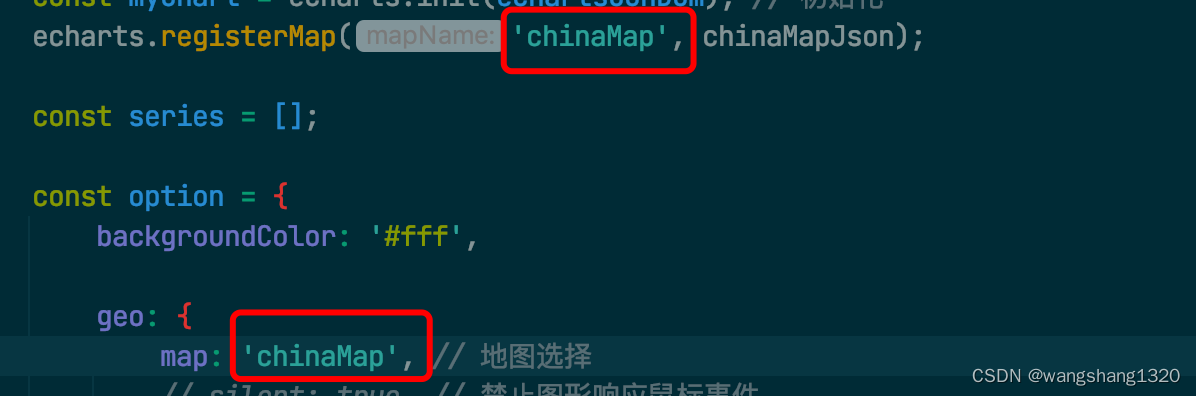
 南海缩略图:

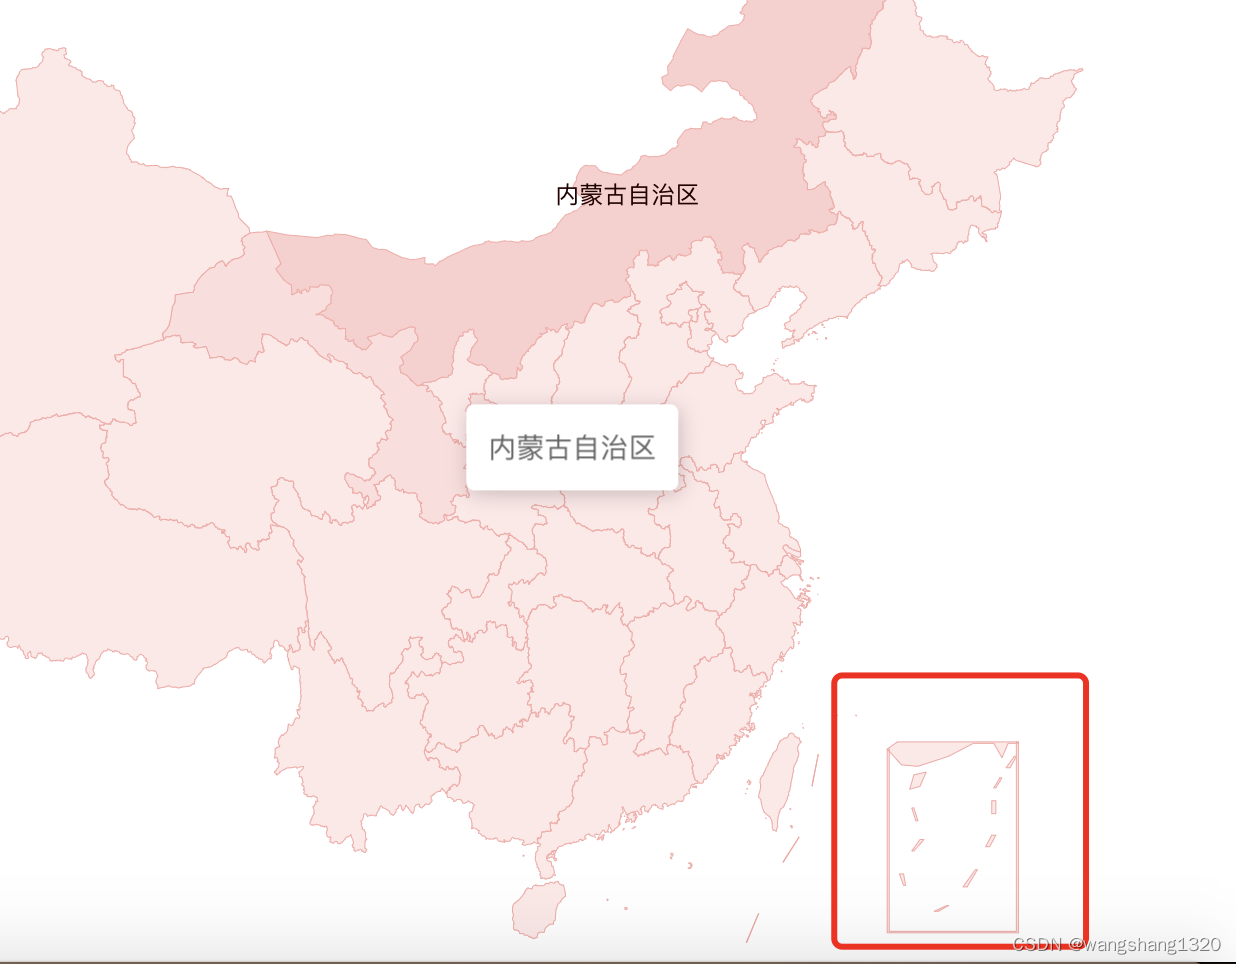
注: 也可以使用svg方式来实现。原理类似。只是数据 在svg里面了  详情看官方文档

C++ defines a class DateV3 with the following: private member variables: int year, month, day; Has three constructors and one destructor as follows: The first constructor takes three parameters, int y, int m, int n; The second is the copy constructor that takes a DateV3 object as the parameter; The third is the default constructor that takes no parameter; The destructor takes no parameter. (3) Has overloaded operators: int operator-(DateV3 & oneDate); // return difference in days between the calling object and oneDate DateV3 operator+(int inc); // return a Date object that is inc days later than the calling object DateV3 operator-(int dec); // return a Date object that is dec days earlier than the calling object DateV3 operator++(); // overload the prefix ++ operator DateV3 operator++(int); // overload the postfix ++ operator friend ostream& operator<< (ostream& outputStream, DateV3& theDate); // overload the << operator Test class DateV3 in the main function as follows: Declare and initialize an object to represent today, which should be the date that you work on this assignment.Declare and initialize an object to represent your OWN birthday.Express John’s birthday given John is 5 days older than yours. Create Tom’s birthday by using the copy constructor, assuming Tom has the same birthday as you. Display how many days have passed since your birth, John’s birth, and Tom’s birth, respectively. Create an DateV3 object, someday, by cloning Tom’s birthday. Increment someday by the prefix operator ++ once, and by postfix operator ++ once.Display someday, today, your birthday, John’s birthday, and Tom’s birthday. Declare a DateV3 object to represent 28 February 2024, display it, apply the prefix ++ operator on it, display it again, and apply the postfix ++ operator on it and display it again.
06-12
评论
成就一亿技术人!
拼手气红包6.0元
还能输入1000个字符
 
红包 添加红包
表情包 插入表情
 条评论被折叠 查看
添加红包

请填写红包祝福语或标题

红包个数最小为10个

红包金额最低5元

当前余额3.43前往充值 >
需支付:10.00
成就一亿技术人!
领取后你会自动成为博主和红包主的粉丝 规则
hope_wisdom
发出的红包
实付
使用余额支付
点击重新获取
扫码支付
钱包余额 0

抵扣说明:

1.余额是钱包充值的虚拟货币,按照1:1的比例进行支付金额的抵扣。
2.余额无法直接购买下载,可以购买VIP、付费专栏及课程。

余额充值