


oom 内存溢出,内存泄漏,相当于TiDB不能用了
TiDB Server OOM对业务的影响
- TiDB Server上的业务SQL会失败
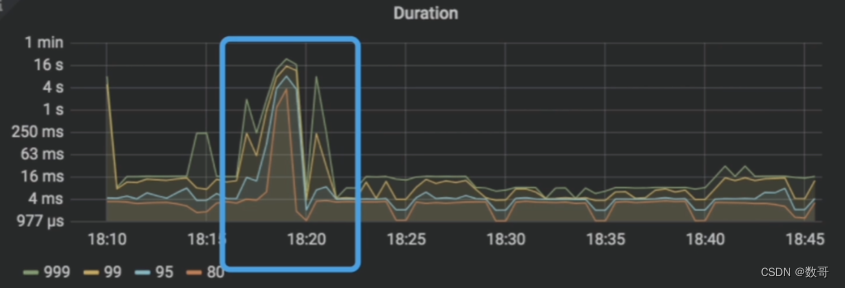
- 业务响应时间升高
- 前端体验变差
诊断方法
- 客户端应用
ERROR 2013(HY000): Lost connection to MySQL Server during query
- 日志
- dmesg -T | grep tidb-server 结果中有事故发生的附近时间点的OOM-killer的日志
- tidb.log(事故发生后附近时间的"Welcome to TiDB的日志" <即TiDB server发生的重启>)
- tidb_stderr.log( fatal error: “runtime: out of memory” 或 cannot allocate memory)
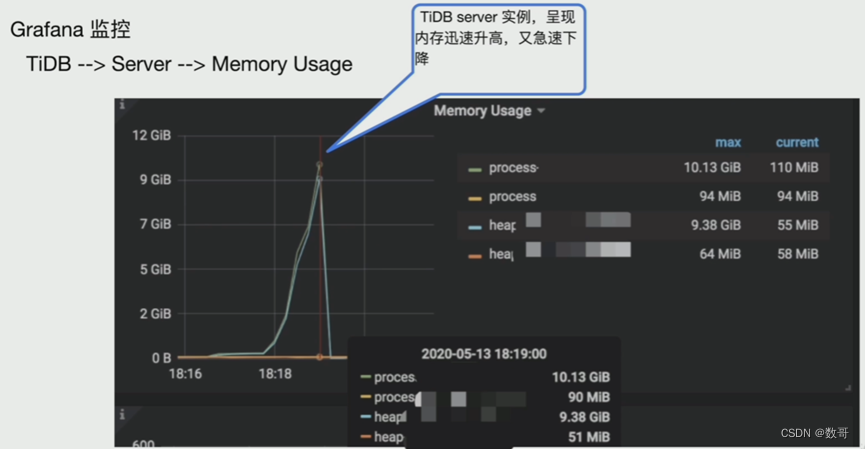
- Grafana 监控
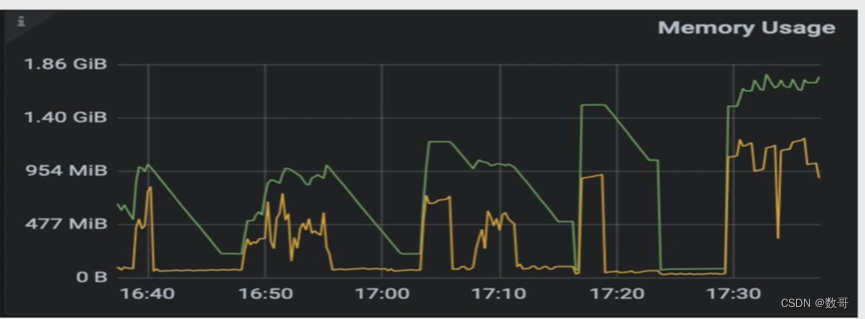
TiDB —> Server —> Memory Usage
TiDB Server实例呈现内存迅速升高,然后急速下降。
TiDB —> Server —> Uptime
和Memory Usage配合一起使用,确认TiDB Server实例的运行情况,观察是否同时有内存使用率飚高的情况

造成OOM的原因
- SQL语句的执行
- GoLang内存释放机制
TiDB-Runtime —> Memory Usage
这个可以定位是SQL问题,还是GO语言的问题
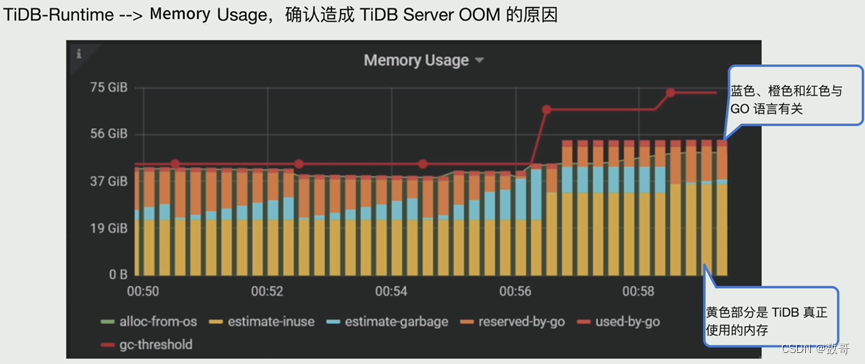
黄色部分(estimate-inuse)是TiDB真正使用的内存;
蓝色(estimate-garbage)、橙色(reserved-by-go)和红色(used-by-go)与Go语言有关
定位内存占用大的SQL
-
TiDB Dashboard 慢查询
在TiDB Dashboard的Slow Queries面板中,将时间范围调到TiDB Server OOM前,在Columns中选择按照Max Memory进行排序,可以找到集群中消耗内存较大的SQL语句。
注:TiDB Dashboard中看到的SQL是已经执行完的语句。 -
TiDB Dashboard SQL 语句分析
在TiDB Dashboard的SQL Statements面板中,将时间范围调到TiDB Server OOM前,在Columns中选择按照Mean Memory进行排序,可以找到集群中消耗内存较大的SQL语句。 -
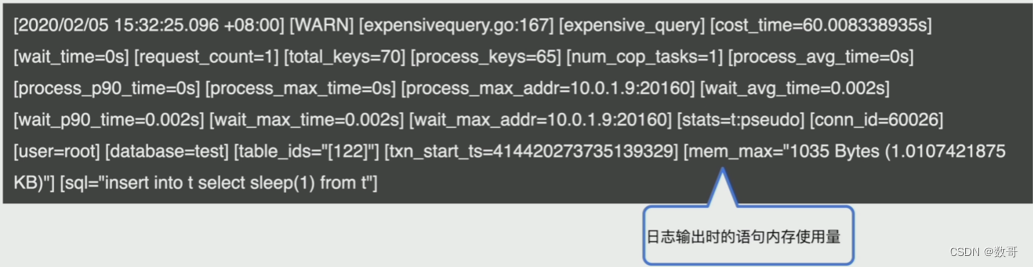
TiDB Server日志中的expensive query
当一条语句在执行过程中达到资源使用阈值(执行时间tidb_expensive_query_time_threshold或者使用内存量mem-quota-query)时,TiDB会即时将这条语句的相关信息写入tidb-server日志。 -
执行计划优化
- 优化器没有选择最有执行计划
- 未创建必要索引
- 执行计划准确,但内存占用高
more tidb.log | grep expensivequery
# cost_time: 已经执行的时间
# mem_max: 日志输出时语句的内存使用量
TiDB Server日志 - expensive query
与dashboard当中SQL语句的区别是,dashboard中的语句执行完后才会收集日志当中可以记录正在执行的的SQL。
当一条语句在执行过程中达到资源使用阈值时(执行时间<tidb_expensive_query_time_threshold>/使用内存量), TiDB会即时将这条语句的相关信息写入tidb-server日志
缓解TiDB Server OOM的措施
- SQL优化,减少非必要返回的数据量
- 执行计划优化
- 优化器没有选择最优计划执行
- 未创建必要索引
- 执行计划准确,但内存占用高
- 减少大事务,将大事务拆分成为小事务
- 调整TiDB Server相关参数,来限制单条SQL内存的使用
- 其他方法
调整TiDB Server参数
-
mem-quota-query
单条SQL占用的最大内存,默认为1G,超过该值会触发oom-action。 -
oom-action
单条SQL超出最大使用内存后的行为,默认为cancel,表示放弃执行。在单条SQL使用的内存达到mem-quota-query,且没有足够的临时磁盘空间可用时,会触发oom-action。 -
oom-use-tmp-storage
设置在单条SQL使用内存超过mem-quota-query时是否使用临时磁盘空间。 -
tmp-storage-path
临时磁盘空间的路径。 -
tmp-storage-quota
临时磁盘空间的使用上限,单位为byte。
其他减少内存占用的方法
调整Go内存释放策略
Go语言的Runtime在释放内存返回到内核时,在Linux平台有以下两种策略:
- MADV_DONTNEED
- MADV_FREE
- 在TiDB Server启动前添加环境变量GODEBUG=madvdontneed=1。滚动重启TiDB Server
实验
TiDB数据库中运行消耗内存较大的SQL语句,观察其对TiDB Server内存使用情况,对其进行监控和限制
1、初始化环境
使用TiUP bench组件构造包括对customer、lineitem、nation等在内的基础表结构以及数据。
tiup bench tpch -H 192.168.16.13 -P 4000 -pAa123ab! -D tpch prepare
mysql> use tpch;
Reading table information for completion of table and column names
You can turn off this feature to get a quicker startup with -A

Database changed
mysql> show tables;
+----------------+
| Tables_in_tpch |
+----------------+
| customer       |
| lineitem       |
| nation         |
| orders         |
| part           |
| partsupp       |
| region         |
| supplier       |
+----------------+
8 rows in set (0.02 sec)
mysql> select count(*) from customer;
+----------+
| count(*) |
+----------+
|   150000 |
+----------+
1 row in set (0.87 sec)
CREATE TABLE customer_test (
  `C_CUSTKEY` bigint(20) PRIMARY KEY AUTO_INCREMENT,
  `C_NAME` varchar(25) NOT NULL,
  `C_ADDRESS` varchar(40) NOT NULL,
  `C_NATIONKEY` bigint(20) NOT NULL,
  `C_PHONE` char(15) NOT NULL,
  `C_ACCTBAL` decimal(15,2) NOT NULL,
  `C_MKTSEGMENT` char(10) NOT NULL,
  `C_COMMENT` varchar(117) NOT NULL,
   KEY IDX_NAME(C_NAME)
) ENGINE=InnoDB DEFAULT CHARSET=utf8mb4 ;
2、 造数
[root@tidb2 ~]# for i in `seq 60` ; do mysql -uroot -pAa123ab! -P4000 -h192.168.16.13 -e "insert into tpch.customer_test (C_NAME,C_ADDRESS,C_NATIONKEY,C_PHONE,C_ACCTBAL,C_MKTSEGMENT,C_COMMENT) select C_NAME,C_ADDRESS,C_NATIONKEY,C_PHONE,C_ACCTBAL,C_MKTSEGMENT,C_COMMENT from tpch.customer ;"; done;
mysql> select count(*) from customer;
+----------+
| count(*) |
+----------+
|   900000 |
+----------+
1 row in set (0.05 sec)
3、执行测试SQL语句,观察内存消耗情况
explain analyze select t.c_name,t.c_address,s.c_custkey from customer_test t ,customer s where t.c_name=s.c_name order by t.c_address;
mysql> explain analyze select t.c_name,t.c_address,s.c_custkey from customer_test t ,customer s where t.c_name=s.c_name order by t.c_address;
+---------------------------------+------------+---------+-----------+---------------+----------------------------------------------------------------------------------------------------------------------------------------------------------------------------------------------------------------------------------------------------------------------------------------------------------------------------------+----------------------------------------------------------------------------------+----------+---------+
| id                              | estRows    | actRows | task      | access object | execution info                                                                                                                                                                                                                                                                                                                   | operator info                                                                    | memory   | disk    |
+---------------------------------+------------+---------+-----------+---------------+----------------------------------------------------------------------------------------------------------------------------------------------------------------------------------------------------------------------------------------------------------------------------------------------------------------------------------+----------------------------------------------------------------------------------+----------+---------+
| Sort_9                          | 4250323.83 | 5700000 | root      |               | time:3m16s, loops:5568                                                                                                                                                                                                                                                                                                           | tpch.customer_test.c_address                                                     | 495.8 MB | 0 Bytes |
| └─Projection_12                 | 4250323.83 | 5700000 | root      |               | time:49s, loops:5570, Concurrency:5                                                                                                                                                                                                                                                                                              | tpch.customer_test.c_name, tpch.customer_test.c_address, tpch.customer.c_custkey | 424.1 KB | N/A     |
|   └─HashJoin_26                 | 4250323.83 | 5700000 | root      |               | time:48.8s, loops:5570, build_hash_table:{total:4.28s, fetch:2.37s, build:1.9s}, probe:{concurrency:5, total:4m7.3s, max:49.5s, probe:3m14.7s, fetch:52.6s}                                                                                                                                                                      | inner join, equal:[eq(tpch.customer.c_name, tpch.customer_test.c_name)]          | 13.2 MB  | 0 Bytes |
|     ├─TableReader_28(Build)     | 150000.00  | 150000  | root      |               | time:2.37s, loops:148, cop_task: {num: 1, max: 2.38s, proc_keys: 150000, tot_proc: 2.2s, tot_wait: 1ms, rpc_num: 1, rpc_time: 2.38s, copr_cache_hit_ratio: 0.00}                                                                                                                                                                 | data:TableFullScan_27                                                            | 4.87 MB  | N/A     |
|     │ └─TableFullScan_27        | 150000.00  | 150000  | cop[tikv] | table:s       | tikv_task:{time:1.66s, loops:151}, scan_detail: {total_process_keys: 150000, total_process_keys_size: 30533765, total_keys: 150001, rocksdb: {delete_skipped_count: 0, key_skipped_count: 150000, block: {cache_hit_count: 506, read_count: 1, read_byte: 15.9 KB}}}                                                             | keep order:false                                                                 | N/A      | N/A     |
|     └─TableReader_30(Probe)     | 5700000.00 | 5700000 | root      |               | time:8.03s, loops:5571, cop_task: {num: 14, max: 42.1s, min: 3.12s, avg: 26.9s, p95: 42.1s, max_proc_keys: 448282, p95_proc_keys: 448282, tot_proc: 5m21.9s, tot_wait: 2.98s, rpc_num: 15, rpc_time: 6m21.3s, copr_cache_hit_ratio: 0.00}, ResolveLock:{num_rpc:1, total_time:2.57s}                                             | data:TableFullScan_29                                                            | 202.1 MB | N/A     |
|       └─TableFullScan_29        | 5700000.00 | 5700000 | cop[tikv] | table:t       | tikv_task:{proc max:12.6s, min:2.7s, p80:11.8s, p95:12.6s, iters:5626, tasks:14}, scan_detail: {total_process_keys: 5700000, total_process_keys_size: 1160283070, total_keys: 5850141, rocksdb: {delete_skipped_count: 127, key_skipped_count: 6000127, block: {cache_hit_count: 2381, read_count: 18465, read_byte: 609.6 MB}}} | keep order:false                                                                 | N/A      | N/A     |
+---------------------------------+------------+---------+-----------+---------------+----------------------------------------------------------------------------------------------------------------------------------------------------------------------------------------------------------------------------------------------------------------------------------------------------------------------------------+----------------------------------------------------------------------------------+----------+---------+
7 rows in set (3 min 16.08 sec)
4、反复执行测试用SQL语句,进行监控
for i in `seq 10` ; do mysql -uroot -pAa123ab! -P4000 -h192.168.16.13 -e "insert into tpch.customer_test (C_NAME,C_ADDRESS,C_NATIONKEY,C_PHONE,C_ACCTBAL,C_MKTSEGMENT,C_COMMENT) select C_NAME,C_ADDRESS,C_NATIONKEY,C_PHONE,C_ACCTBAL,C_MKTSEGMENT,C_COMMENT from tpch.customer ;"; done;
Grafana监控–>TiDB–>Server—>Memory Usage监控内存使用呈现上升趋势
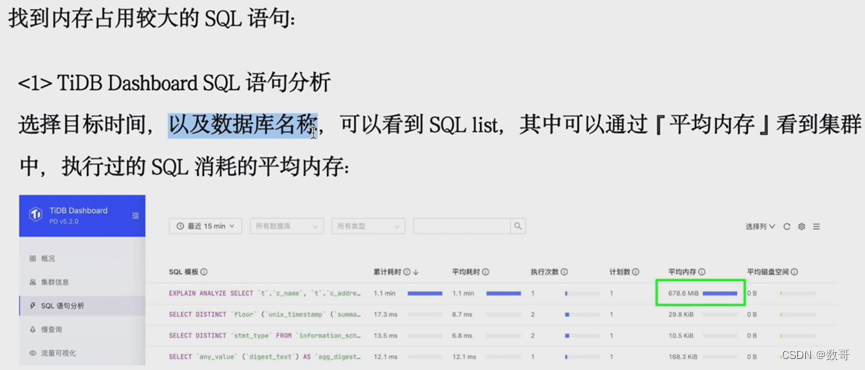
5、通过Dashboard找出内存占用较大的语句:
选择目标时间,以及数据库名称,可以看到SQL list,通过平均内存看到集群中,执行过的SQL消耗的平均内存
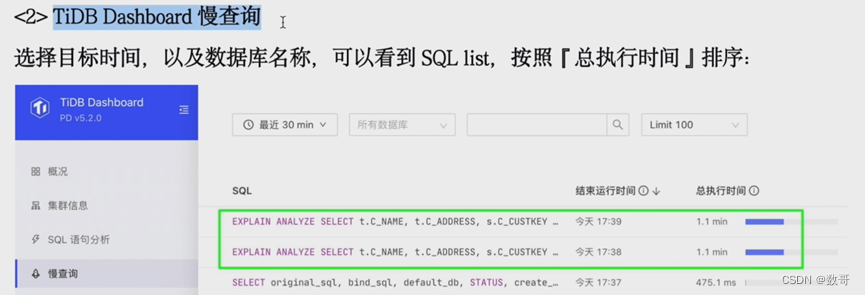
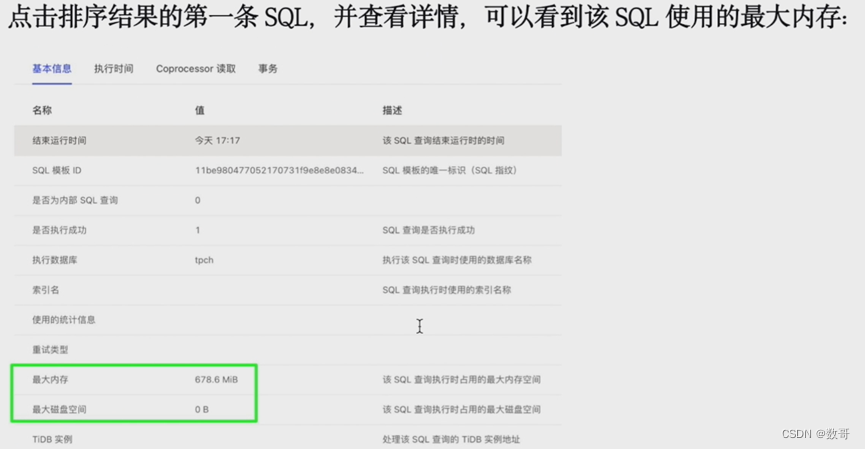
选择目标时间,以及数据库名称,可以看到SQL List,按照总执行时间排序
6、通过参数限制单条SQL语句对于内存的使用
修改参数tidb_mem_quota_query,限制测试SQL内存的使用为107M,
mysql> set tidb_mem_quota_query=107374100;
Query OK, 0 rows affected (0.00 sec)
mysql> show variables like ‘tidb_mem_quota_query%’;
±---------------------±----------+
| Variable_name | Value |
±---------------------±----------+
| tidb_mem_quota_query | 107374100 |
±---------------------±----------+
1 row in set (0.00 sec)
再次执行测试SQL 语句,观察内存和磁盘的消耗情况
mysql> explain analyze select t.c_name,t.c_address,s.c_custkey from customer_test t ,customer s where t.c_name=s.c_name order by t.c_address;
+---------------------------------+------------+---------+-----------+---------------+-------------------------------------------------------------------------------------------------------------------------------------------------------------------------------------------------------------------------------------------------------------------------------------------------------------------------------+----------------------------------------------------------------------------------+----------+----------+
| id                              | estRows    | actRows | task      | access object | execution info                                                                                                                                                                                                                                                                                                                | operator info                                                                    | memory   | disk     |
+---------------------------------+------------+---------+-----------+---------------+-------------------------------------------------------------------------------------------------------------------------------------------------------------------------------------------------------------------------------------------------------------------------------------------------------------------------------+----------------------------------------------------------------------------------+----------+----------+
| Sort_9                          | 4250323.83 | 5850000 | root      |               | time:1m51.9s, loops:5714                                                                                                                                                                                                                                                                                                      | tpch.customer_test.c_address                                                     | 508.9 MB | 463.3 MB |
| └─Projection_12                 | 4250323.83 | 5850000 | root      |               | time:20.6s, loops:5717, Concurrency:5                                                                                                                                                                                                                                                                                         | tpch.customer_test.c_name, tpch.customer_test.c_address, tpch.customer.c_custkey | 424.1 KB | N/A      |
|   └─HashJoin_26                 | 4250323.83 | 5850000 | root      |               | time:20s, loops:5717, build_hash_table:{total:2.02s, fetch:1.61s, build:404.9ms}, probe:{concurrency:5, total:1m43s, max:20.6s, probe:1m25.9s, fetch:17.1s}                                                                                                                                                                   | inner join, equal:[eq(tpch.customer.c_name, tpch.customer_test.c_name)]          | 13.2 MB  | 0 Bytes  |
|     ├─TableReader_28(Build)     | 150000.00  | 150000  | root      |               | time:1.53s, loops:148, cop_task: {num: 1, max: 1.48s, proc_keys: 150000, tot_proc: 1.43s, rpc_num: 1, rpc_time: 1.48s, copr_cache_hit_ratio: 0.00}                                                                                                                                                                            | data:TableFullScan_27                                                            | 4.87 MB  | N/A      |
|     │ └─TableFullScan_27        | 150000.00  | 150000  | cop[tikv] | table:s       | tikv_task:{time:1.27s, loops:151}, scan_detail: {total_process_keys: 150000, total_process_keys_size: 30533765, total_keys: 150001, rocksdb: {delete_skipped_count: 0, key_skipped_count: 150000, block: {cache_hit_count: 7, read_count: 503, read_byte: 11.4 MB}}}                                                          | keep order:false                                                                 | N/A      | N/A      |
|     └─TableReader_30(Probe)     | 5850000.00 | 5850000 | root      |               | time:2.26s, loops:5718, cop_task: {num: 14, max: 17.3s, min: 1.16s, avg: 10.4s, p95: 17.3s, max_proc_keys: 448282, p95_proc_keys: 448282, tot_proc: 2m4s, tot_wait: 365ms, rpc_num: 14, rpc_time: 2m25.5s, copr_cache_hit_ratio: 0.00}                                                                                        | data:TableFullScan_29                                                            | 227.4 MB | N/A      |
|       └─TableFullScan_29        | 5850000.00 | 5850000 | cop[tikv] | table:t       | tikv_task:{proc max:4.29s, min:967ms, p80:4.15s, p95:4.29s, iters:5773, tasks:14}, scan_detail: {total_process_keys: 5850000, total_process_keys_size: 1190816835, total_keys: 6000014, rocksdb: {delete_skipped_count: 0, key_skipped_count: 6000000, block: {cache_hit_count: 80, read_count: 19568, read_byte: 688.8 MB}}} | keep order:false                                                                 | N/A      | N/A      |
+---------------------------------+------------+---------+-----------+---------------+-------------------------------------------------------------------------------------------------------------------------------------------------------------------------------------------------------------------------------------------------------------------------------------------------------------------------------+----------------------------------------------------------------------------------+----------+----------+
7 rows in set (1 min 51.98 sec)
7、记录慢日志
修改参数tidb_expensive_query_time_threshold,使用SQL可以被记录到tidb.log中
mysql> show variables like 'tidb_expensive_query%';
+-------------------------------------+-------+
| Variable_name                       | Value |
+-------------------------------------+-------+
| tidb_expensive_query_time_threshold | 60    |
+-------------------------------------+-------+
1 row in set (0.01 sec)
mysql> set tidb_expensive_query_time_threshold=10;
Query OK, 0 rows affected, 1 warning (0.00 sec)

mysql> show variables like 'tidb_expensive_query%';
+-------------------------------------+-------+
| Variable_name                       | Value |
+-------------------------------------+-------+
| tidb_expensive_query_time_threshold | 10    |
+-------------------------------------+-------+
1 row in set (0.00 sec)
观察TiDB Server 日志
可以通过过滤tidb.log中的expensivequery 关键字,来发现内存占用高的SQL,如下:
[root@tidb2 log]# more tidb.log |grep expensivequery
[2023/07/26 09:18:10.569 -04:00] [WARN] [expensivequery.go:188] [expensive_query] [cost_time=10.125575748s] [cop_time=3.652980931s] [process_time=10.459s] [wait_time=0.03s] [request_count=4] [total_keys=1219018] [process_keys=1069014] [num_cop_tasks=4] [process_avg_time=2.61475s] [process_p90_time=4.321s] [process_max_time=4.321s] [process_max_addr=192.168.16.13:20160] [wait_avg_time=0.0075s] [wait_p90_time=0.027s] [wait_max_time=0.027s] [wait_max_addr=192.168.16.13:20160] [stats=customer:442995339811356673,customer_test:443108844633587713] [conn_id=2777144270413365659] [user=root] [database=tpch] [table_ids="[133,139]"] [txn_start_ts=443122314107682817] [mem_max="190909650 Bytes (182.1 MB)"] [sql="explain analyze select t.c_name,t.c_address,s.c_custkey from customer_test t ,customer s where t.c_name=s.c_name order by t.c_address"]
通过过滤tidb.log中的memory exceeds quota,split to disk now关键字,来发现SQL执行过程中的一部分中间结果使用了磁盘作为临时存储
[root@tidb2 log]# more tidb.log |grep 'memory exceeds quota'
[2023/07/26 09:18:20.615 -04:00] [INFO] [row_container.go:567] ["memory exceeds quota, spill to disk now."] [consumed=547270308] [quota=107374100]
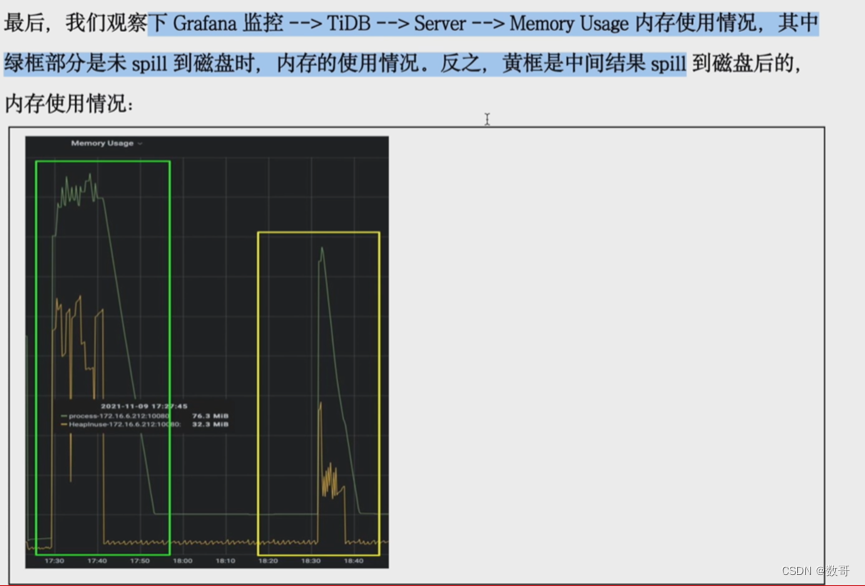
8、通过观察Grafana 观察内存情况
9、清理实验数据
[root@tidb2 log]# tiup bench tpch -H 192.168.16.13 -P 4000  -pAa123ab! -D tpch clean
tiup is checking updates for component bench ...
Starting component `bench`: /root/.tiup/components/bench/v1.12.0/tiup-bench tpch -H 192.168.16.13 -P 4000 -pAa123ab! -D tpch clean
DROP TABLE IF EXISTS lineitem
DROP TABLE IF EXISTS partsupp
DROP TABLE IF EXISTS supplier
DROP TABLE IF EXISTS part
DROP TABLE IF EXISTS orders
DROP TABLE IF EXISTS customer
DROP TABLE IF EXISTS region
DROP TABLE IF EXISTS nation
Finished


 3722
3722


 被折叠的 条评论
为什么被折叠?
被折叠的 条评论
为什么被折叠?
 到【灌水乐园】发言


