


1、实现图形报表需要几个js插件.可以去官方下载.
2、我这边还用到了Easyui。这样更美观一点,也是为了显示数据。废话不多说上代码
JS:
<script type="text/javascript">
$(function () {
$("#bg").datagrid({
data: <%=bg_DataInfo%>
});
});
$(function () {
$('#container').highcharts({
chart: {
plotBackgroundColor: null,
plotBorderWidth: null,
plotShadow: false
},
credits: {
enabled: false //屏蔽版权信息
},
//更改HighCharts默认下载图片打印操作,更改成中文
lang:
{
downloadJPEG:'下载jpeg',
downloadPDF:'下载pdf',
downloadPNG:'下载PNG',
downloadSVG:'下载SVG',
printChart:'打印图标',
contextButtonTitle:'打印操作'
},
title: {
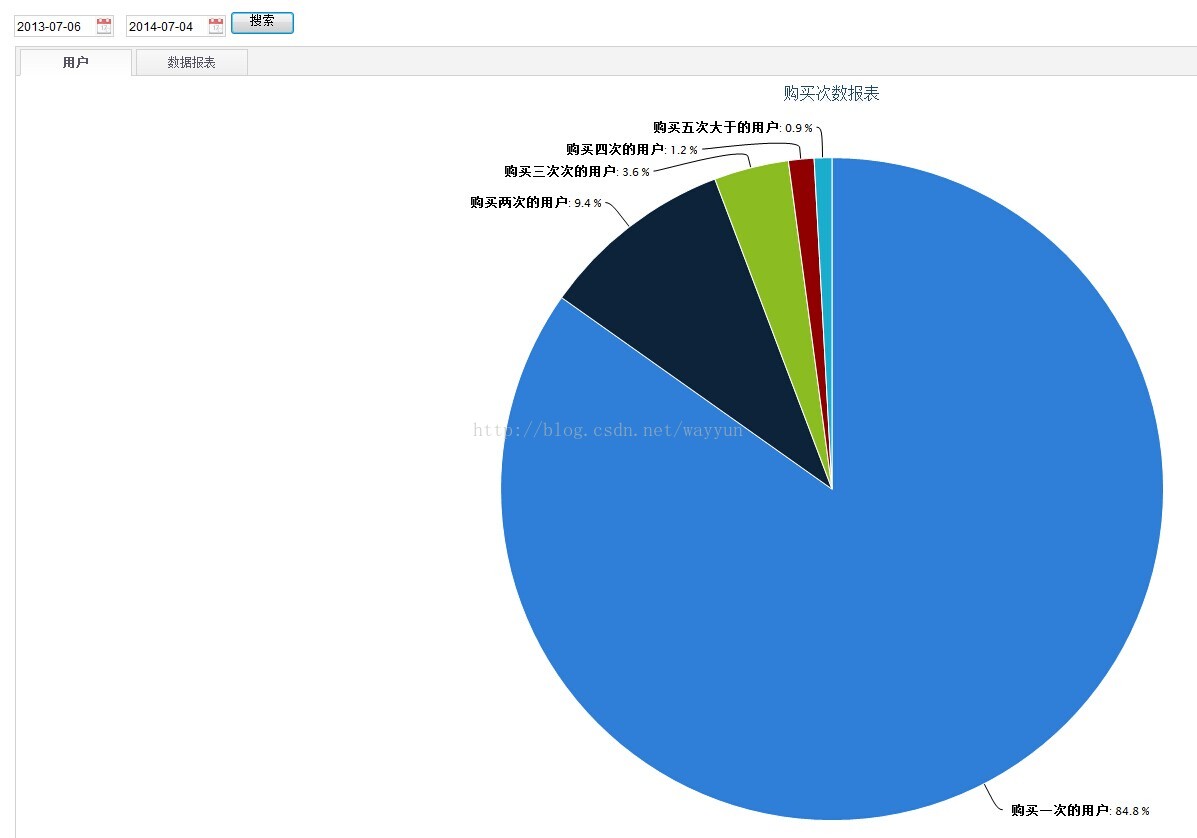
text: '购买次数报表'
},
tooltip: {
pointFormat: '{series.name}: <b>{point.percentage:.1f}%</b>'
},
plotOptions: {
pie: {
allowPointSelect: true,
cursor: 'pointer',
dataLabels: {
enabled: true,
color: '#000000',
connectorColor: '#000000',
format: '<b>{point.name}</b>: {point.percentage:.1f} %'
}
}
},
series: [{
type: 'pie',
name: ' ',
data: [
['购买一次的用户', <%=YiCi%>],
['购买两次的用户', <%=ErCi%>],
['购买三次次的用户', <%=SanCi%>],
['购买四次的用户', <%=SiCi%>],
['购买五次大于的用户', <%=WuCi%>]
]
}]
});
});
</script><div data-options="region:'north',iconCls:'icon-ok',title:'操作'" style="padding: 4px">
<asp:TextBox CssClass="easyui-datebox" ID="Start_Time" runat="server" Width="100px"></asp:TextBox>
<asp:TextBox CssClass="easyui-datebox" ID="End_Time" runat="server" Width="100px"></asp:TextBox>
<asp:Button ID="Button1" runat="server" Text="搜索" Width="65px" OnClick="btn_Search_Click" />
</div>
<div data-options="region:'center'" style="height:800px; padding: 5px;">
<div class="easyui-tabs" data-options="fit:true,tabWidth:112,fit:true">
<div title="用户" id="container">
</div>
<div title="数据报表">
<table class="easyui-datagrid" id="bg"
data-options="singleSelect:true,collapsible:true,fit:true,fitColumns:true">
<thead>
<tr>
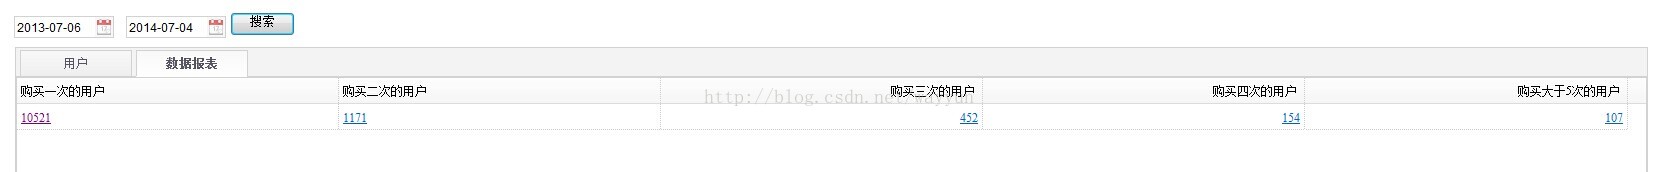
<th data-options="field:'A',width:80,formatter:OpeartionFormatterFirst">购买一次的用户</th>
<th data-options="field:'B',width:80,formatter:OpeartionFormatterFirst1">购买二次的用户</th>
<th data-options="field:'C',width:80,formatter:OpeartionFormatterFirst2,align:'right'">购买三次的用户</th>
<th data-options="field:'D',width:80,formatter:OpeartionFormatterFirst3,align:'right'">购买四次的用户</th>
<th data-options="field:'E',width:80,formatter:OpeartionFormatterFirst4,align:'right'">购买大于5次的用户</th>
</tr>
</thead>
</table>
</div>
</div>
</div><script>
//增加Checkbox
function OpeartionFormatterFirst(value, row, index,number) {
return "<a href='aaa.aspx?number=1&type=1'>"+value+"</a>";
}
function OpeartionFormatterFirst1(value, row, index,number) {
return "<a href='aaa.aspx?number=2&type=1'>"+value+"</a>";
}
function OpeartionFormatterFirst2(value, row, index,number) {
return "<a href='aaa.aspx?number=3&type=1'>"+value+"</a>";
}
function OpeartionFormatterFirst3(value, row, index,number) {
return "<a href='aaa.aspx?number=4&type=1'>"+value+"</a>";
}
function OpeartionFormatterFirst4(value, row, index,number) {
return "<a href='aaa.aspx?number=5&type=1'>"+value+"</a>";
}
</script>展示图:


 4420
4420


 被折叠的 条评论
为什么被折叠?
被折叠的 条评论
为什么被折叠?
 到【灌水乐园】发言


