


As its name suggests, AChartEngine is a charting library that can be used in Android applications.
It supports all the Android SDK versions from 1.6 and up. The 1.6 version offers only pan and button based zoom, while the 2.1 and newer add support for pinch zoom as this became available in the Android SDK 2.x and newer. A while ago, when AChartEngine dropped the support for older Android SDK versions than 2.1, many users asked it back in just a couple of days after the release. At that time, according to the official Android platform distribution available here, there were still about 5% of devices available worldwide that were running versions that are older than 2.x.
Adding charting to an Android application with AChartEngine, is as simple as adding the achartengine-x.y.z.jar to the application classpath and start coding against its APIs. The current stable version is 1.0.0 and the one under development 1.1.0. The jar file is only 110 KB is size, which is quite a small footprint nowadays. However, AChartEngine offers support for many chart types.
A little bit of history
In late 2008, Android developers were already looking for charting / graphing / plotting libraries. At that time there was no such free / open-source solution available.
I started evaluating Android for fun and after developing a couple of Android applications that needed some graphing, I decided I could open-source the charting code under the name of AChartEngine. Version 0.2.0 was launched in March 2009, being the first open-source charting library for Android. At that time, Android SDK was at version 1.1.
Features
There are three main types of charts that are supported by AChartEngine:
- XY charts - display data on 2 axis (line, cubic line, area, bar, scatter, bubble, range (high-low))
- "Round" charts - pie, doughnut, dial
- Combined chart - can display a combination of the XY charts
Overall Class Design
The diagram below shows the way the classes that handle the visual rendering of the charts are organized.
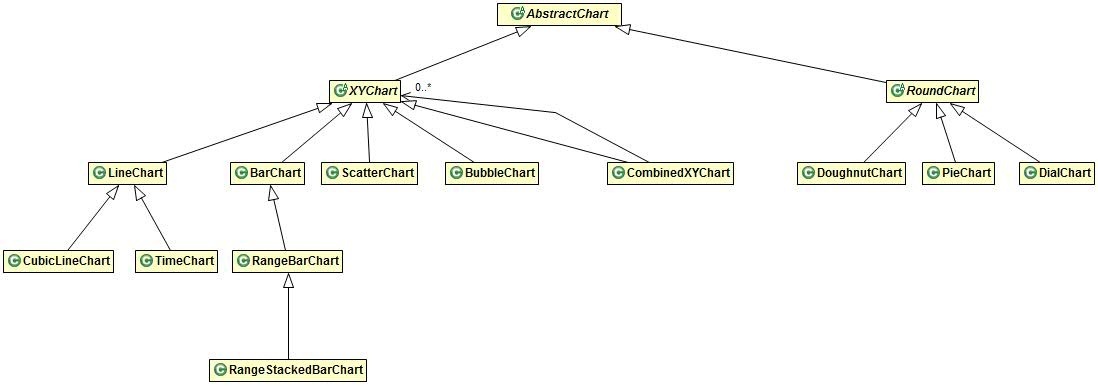
- The AbstractChart class describes behavior that is shared by all charts, including drawing background, legend, titles,...
- The XYChart class describes state and behavior that is common to the XY chart types like the rendering of axes, labels,...
- The RoundChart is similar to XYChart, but for the chart types that have a circular shape.
Design Components
The entire design is not limited to the visual / view part only. There are a few more components contributing to the overall picture.
- The model - datasets / series of data.
- The view - described above.
- Renderers - help in customizing the charts appearance (colors, fonts, axis, labels, formatting,...).
- ChartFactory - gets an instance of a dataset and an instance of a renderer and returns the desired chart embedded into an Intent (for the case when the chart fills an Activity) or a View (when the chart is a part of an Activity, together with other widgets).
- Tools - interaction tools for pan and zoom.
Code sample
The code below shows a simple example of how a chart can be initialized and added to an Activity. The package declaration and the imports have been removed for keeping the sample smaller.
public class SampleChart extends Activity {
    private GraphicalView mChart;

    private XYMultipleSeriesDataset mDataset = new XYMultipleSeriesDataset();

    private XYMultipleSeriesRenderer mRenderer = new XYMultipleSeriesRenderer();

    private XYSeries mCurrentSeries;

    private XYSeriesRenderer mCurrentRenderer;

    private void initChart() {
        mCurrentSeries = new XYSeries("Sample Data");
        mDataset.addSeries(mCurrentSeries);
        mCurrentRenderer = new XYSeriesRenderer();
        mRenderer.addSeriesRenderer(mCurrentRenderer);
    }

    private void addSampleData() {
        mCurrentSeries.add(1, 2);
        mCurrentSeries.add(2, 3);
        mCurrentSeries.add(3, 2);
        mCurrentSeries.add(4, 5);
        mCurrentSeries.add(5, 4);
    }

    protected void onCreate(Bundle savedInstanceState) {
        super.onCreate(savedInstanceState);
        setContentView(R.layout.activity_main);
    }

    protected void onResume() {
        super.onResume();
        LinearLayout layout = (LinearLayout) findViewById(R.id.chart);
        if (mChart == null) {
            initChart();
            addSampleData();
            mChart = ChartFactory.getCubeLineChartView(this, mDataset, mRenderer, 0.3f);
            layout.addView(mChart);
        } else {
            mChart.repaint();
        }
    }
}
In order to have the above example work, a simple layout file must be defined and that will need to include a LinearLayout with the android:id="@+id/chart".
Applications
Applications of all types are using AChartEngine for chart rendering. The appbrain.com Android market states that 0.52% of their total number of published applications (around 600K) are using AChartEngine, which means that over 3000 of them are using AChartEngine.
A list of the most popular applications using AChartEngine:
- MotoACTV - fitness tool developed by Motorola and pre-installed on their devices
- EKG viewers, bioharness applications
- Path trackers, fitness, biking applications
- Finance, business applications
- Others,...
Resources
- Official website http://achartengine.org
- Google code website providing downloadable jar, javadocs and demo application, issue tracker and source code SVN http://code.google.com/p/achartengine
- Search for "AChartEngine" on youtube. There is a bunch of helpful video tutorials.
- Browse stackoverflow.com for finding solutions or posting questions.
- Register on the AChartEngine Google group and post ideas.
- Visit the AChartEngine Facebook page facebook.com/achartengine
- Contact us at contact@achartengine.org
Contributors welcome
Contributing to an open-source project may look good in your CV. AChartEngine is an open-source project, so it is the result of a community effort. A suggested path to contributing to AChartEngine could be:
- Checkout the source code from SVN and try to understand it.
- Take a look at the opened issues and try fixing some of them. When done, provide patches.
- Ask for commiter rights.
- Answer questions on StackOverflow or other websites.
Meta: this post is part of the Java Advent Calendar and is licensed under the Creative Commons 3.0 Attribution license. If you like it, please spread the word by sharing, tweeting, FB, G+ and so on! Want to write for the blog? We are looking for contributors to fill all 24 slot and would love to have your contribution! Contact Attila Balazs to contribute!


 119
119

 被折叠的 条评论
为什么被折叠?
被折叠的 条评论
为什么被折叠?
 到【灌水乐园】发言


