


Echart案例分享
说明:echart版本为5及以上
文章目录
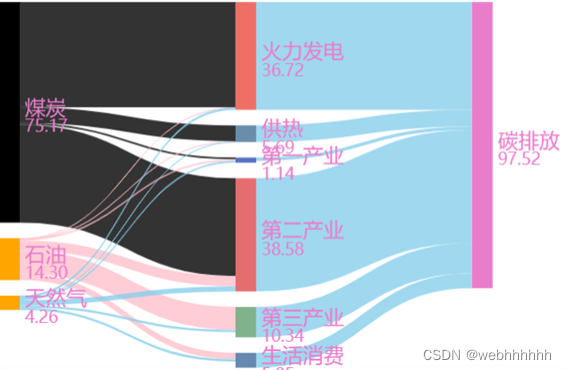
1、桑基图-1
相关配置:
在这里插入代码片
option = {
    backgroundColor:'#0A3D60',
    tooltip: { trigger: 'item', triggerOn: 'mousemove' },
    series: {
        type: 'sankey',
        layout: 'none',
        top: '12px',
        bottom: '4px',
        right: '72px',
        left: 'left',
        draggable: false,
        containLabel: { show: true },
          lineStyle: {
            color: 'source',
            opacity: 0.3,
            curveness: 0.5,
        },
        data: [
             { name: '煤炭',value: '75.17', itemStyle: { color: '#FB6E8B' } },
              { name: '石油',value: '14.30', itemStyle: { color: '#FB906E' } },
              { name: '天然气',value: '4.26', itemStyle: { color: '#FBCB6E' } },

            { name: '火力发电',value: '36.72', itemStyle: {color: '#F99EB1'} },
             { name: '供热',value: '5.69', itemStyle: {color: '#FFB49C'} },
             { name: '第一产业',value: '1.14', itemStyle: {color: '#FFE2AB'} },
              { name: '第二产业',value: '38.58', itemStyle: {color: '#C6D5FA'} },
               { name: '第三产业',value: '10.34', itemStyle: {color: '#98B5FF'} },
                { name: '生活消费',value: '5.05', itemStyle: {color: '#A698FF'} },

                 { name: '碳排放',value: '97.52', itemStyle: {color: '#C6FAE8'} },
                         ],
        links: [
            { source: '煤炭', target: '火力发电', value: '35.85',  },
            { source: '煤炭', target: '供热', value: '5.37', },
            { source: '煤炭', target: '第一产业', value: '0.60', },
            { source: '煤炭', target: '第二产业', value: '33.35',  },

             { source: '石油', target: '火力发电', value: '0.08',  },
            { source: '石油', target: '供热', value: '0.15',  },
            { source: '石油', target: '第一产业', value: '0.54',  },
            { source: '石油', target: '第二产业', value: '3.49',  },
             { source: '石油', target: '第三产业', value: '7.81',  },
              { source: '石油', target: '生活消费', value: '2.22',  },


               { source: '天然气', target: '火力发电', value: '0.79', },
            { source: '天然气', target: '供热', value: '0.17', },
            { source: '天然气', target: '第一产业', value: '0.60', },
            { source: '天然气', target: '第二产业', value: '1.73', },
             { source: '天然气', target: '第三产业', value: '0.75', },
              { source: '天然气', target: '生活消费', value: '0.82', },

                { source: '火力发电', target: '碳排放', value: '36.72', },
            { source: '供热', target: '碳排放', value: '5.69', },
            { source: '第一产业', target: '碳排放', value: '1.14', },
            { source: '第二产业', target: '碳排放', value: '38.58', },
             { source: '第三产业', target: '碳排放', value: '10.34', },
              { source: '生活消费', target: '碳排放', value: '5.05', },

        ],
        label: {
				normal:{
					color:"#A8CEF2",
					fontSize:16,
					formatter: function(params, i) {
				// 		console.log(params);
						return "{white|"+params.data.name +"\n}"+params.value;
					},
					rich:{
						white:{
							fontSize:20,
							padding:[10,0,0,0]
						}
					}
				}

			},
        curveness: 0.8,
        layoutIterations: 0,
        nodeGap: 15,
    },
};
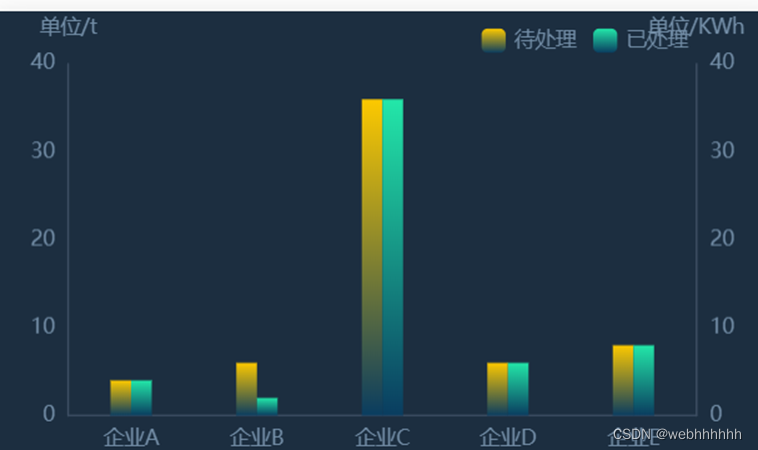
2、双y柱状图-1
相关配置:
option = {
    "backgroundColor": "#1c2e40",
    "color": "#384757",
    "tooltip": {
      "trigger": "axis",
      "axisPointer": {
        "type": "cross",
        "crossStyle": {
          "color": "#384757"
        }
      }
    },
    "legend": {
          itemHeight: 14,
          itemWidth: 14,
      "data": [
        {
          "name": "待处理",
          "icon": "roundRect",
          "textStyle": {
            "color": "#738EA7"
          }
        },
        {
          "name": "已处理",
          "icon": "roundRect",
          "textStyle": {
            "color": "#738EA7"
          }
        }
      ],
      "right": "10%",
      'top':'2%',
      "textStyle": {
        "color": "#fff"
      }
    },
    "xAxis": [
      {
        "type": "category",
        "data": [
          "企业A",
          "企业B",
          "企业C",
          "企业D",
          "企业E",
        ],
        "axisPointer": {
          "type": "shadow"
        },
         axisTick:{
          show:false//不显示坐标轴刻度线
    },
        "axisLabel": {
          "show": true,
          "textStyle": {
            "color": "#738EA7"
          }
        },
         "axisLine": {
          "show": true,
          lineStyle: {
                    color: "#3E4F64",
                }
        },
      }
    ],
    "yAxis": [
      {
        "type": "value",
        "name": "单位/t",
        "nameTextStyle": {
          "color": "#738EA7"
        },
        // "min": 0,
        // "max": 50,
        // "interval": 10,
        "axisLabel": {
          "show": true,
          "textStyle": {
            "color": "#738EA7"
          }
        },
        "axisLine": {
          "show": true,
          lineStyle: {
                    color: "#3E4F64",

                }
        //   color:'red'
        },
         splitLine:{
         show:false//不显示网格线
     },

      },
      {
        "type": "value",
        "name": "单位/KWh",
        "show": true,
        "nameTextStyle": {
          "color": "#738EA7"
        },
        "axisLine": {
          "show": true,
           lineStyle: {
                    color: "#3E4F64",

                }
        },
         splitLine:{
         show:false//不显示网格线
     },
        "axisLabel": {
          "show": true,
          "textStyle": {
            "color": "#738EA7"
          }
        }
      }
    ],
    "grid": {
      "top": "12%",
      'bottom':'8%',
      "containable":true
    },
    "series": [
      {
        "name": "待处理",
        "type": "bar",
        "data": [
          4,
          6,
          36,
          6,
          8,
          6
        ],
        "barWidth": "12",
        "itemStyle": {
          "normal": {
            "color": {
              "type": "linear",
              "x": 0,
              "y": 0,
              "x2": 0,
              "y2": 1,
              "colorStops": [
                {
                  "offset": 0,
                  "color": "#FDC900"
                },

                {
                  "offset": 1,
                  "color": "#0A3D60"
                }
              ],
              "globalCoord": false
            }
          }
        }
      },
      {
        "name": "已处理",
        "type": "bar",
         "yAxisIndex": 1,
        "data": [
          4,
          2,
          36,
          6,
          8,
          6
        ],
        "barWidth": "12",
        "itemStyle": {
          "normal": {
            "color": {
              "type": "linear",
              "x": 0,
              "y": 0,
              "x2": 0,
              "y2": 1,
              "colorStops": [
                {
                  "offset": 0,
                  "color": "#23E7A9"
                },
                {
                  "offset": 1,
                  "color": "#0A3D60"
                }
              ],
              "globalCoord": false
            }
          }
        },
        "barGap": "0"
      }
    ]
};
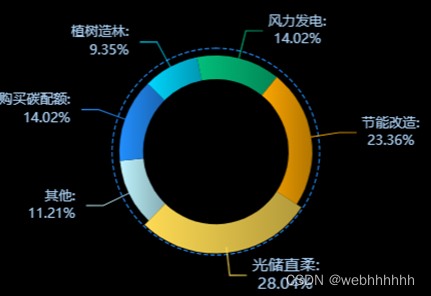
3、圆环图-1
相关配置:
var circlecol1=new echarts.graphic.LinearGradient(1, 0, 0, 0, [{
                                    offset: 0,
                                    color: 'rgba(0, 216, 255, 0.7)'
                                }, {
                                    offset: 1,
                                    color: 'rgba(0, 216, 255, 1)'
                                }]);
                                var circlecol2=new echarts.graphic.LinearGradient(1, 0, 0, 0, [{
                                    offset: 0,
                                    color: 'rgba(2, 191, 123, 0.7)'
                                }, {
                                    offset: 1,
                                    color: 'rgba(2, 191, 123, 1)'
                                }]);
                                var circlecol3=new echarts.graphic.LinearGradient(1, 0, 0, 0, [{
                                    offset: 0,
                                    color: 'rgba(253, 167, 0, 0.7)'
                                }, {
                                    offset: 1,
                                    color: 'rgba(253, 167, 0, 1)'
                                }]);
                                var circlecol4=new echarts.graphic.LinearGradient(1, 0, 0, 0, [{
                                    offset: 0,
                                    color: 'rgba(254, 219, 84, 0.7)'
                                }, {
                                    offset: 1,
                                    color: 'rgba(254, 219, 84, 1)'
                                }]);
                                var circlecol5=new echarts.graphic.LinearGradient(1, 0, 0, 0, [{
                                    offset: 0,
                                    color: 'rgba(191, 244, 254, 0.7)'
                                }, {
                                    offset: 1,
                                    color: 'rgba(191, 244, 254, 1)'
                                }]);
                                var circlecol6=new echarts.graphic.LinearGradient(1, 0, 0, 0, [{
                                    offset: 0,
                                    color: 'rgba(35, 143, 254, 0.7)'
                                }, {
                                    offset: 1,
                                    color: 'rgba(35, 143, 254, 1)'
                                }]);

option = {
    backgroundColor:'#000',
    "series": [{
        "type": "pie",
        "center": ["50%", "50%"],
        "radius": ["40%", "53%"],

        "color": [circlecol1,circlecol2, circlecol3, circlecol4, circlecol5,circlecol6],
        "startAngle": 135,
        "labelLine": {
            "normal": {
                "length": 25
            }
        },
        "label": {
            "normal": {
                "formatter": `{b|{b}:} \n {per|{d}%} `,
                "backgroundColor": "rgba(255, 147, 38, 0)",
                "borderColor": "transparent",
                "borderRadius": 4,
                "rich": {
                    "a": {
                        "color": "#999",
                        "lineHeight": 22,
                        "align": "center"
                    },
                    "hr": {
                        "borderColor": "#aaa",
                        "width": "100%",
                        "borderWidth": 1,
                        "height": 0
                    },
                    "b": {
                        "color": "#A8CEF2",
                        "fontSize": 12,
                        "lineHeight": 15
                    },

                    "per": {
                        "color": "#A8CEF2",
                        "fontSize": 12,
                        "borderRadius": 2
                    }
                },
                "textStyle": {
                    "color": "#fff",
                    "fontSize": 16
                }
            }
        },
        "emphasis": {
            "label": {
                "show": true,
                "formatter": "{b|{b}:} \n {per|{d}%}  ",
                "backgroundColor": "rgba(255, 147, 38, 0)",
                "borderColor": "transparent",
                "borderRadius": 4,
                 "rich": {
                    "a": {
                        "color": "#999",
                        "lineHeight": 22,
                        "align": "center"
                    },
                    "hr": {
                        "borderColor": "#aaa",
                        "width": "100%",
                        "borderWidth": 1,
                        "height": 0
                    },
                    "b": {
                        "color": "#A8CEF2",
                        "fontSize": 14,
                        "lineHeight": 17
                    },

                    "per": {
                        "color": "#A8CEF2",
                        "fontSize": 14,
                        "borderRadius": 2
                    }
                },
            }
        },
        "data": [{
            "name": "植树造林",
            "value": 10
        }, {
            "name": "风力发电",
            "value": 15
        }, {
            "name": "节能改造",
            "value": 25
        }, {
            "name": "光储直柔",
            "value": 30
        }, {
            "name": "其他",
            "value": 12
        }, {
            "name": "购买碳配额",
            "value": 15
        }]
    },
     {
            name:"饼图边框",
            type: 'pie',
            "center": ["50%", "50%"],
        "radius": [ '57%'],clockWise: false, //顺时加载
                    hoverAnimation: false, //鼠标移入变大
            data:[{value:1}],
            label:{
                show:false
            },
            z:1,
            itemStyle:{
                color:'transparent',
                borderColor:'#238FFE',
                width:10,
                borderType:'dashed'
            }
        },

    ]
}
4、进度条,且插入自定义图片

相关配置:
var option = {
            backgroundColor: 'transparent',
            grid: {
                top: '0',
                left: '0',
                right: '5%',
                bottom: '0',
                containLabel: true
            },
            yAxis: [{
                type: 'category',
                data: [''],
                inverse: true,
                axisTick: {
                    show: false
                },
                axisLabel: {
                    margin: 20,
                    textStyle: {
                        fontSize: 36,
                        color: '#D1DFFF'
                    }
                },
                axisLine: {
                    show: false
                }
            }],
            xAxis: [{
                type: 'value',
                axisLabel: {
                    show: false
                },
                axisLine: {
                    show: false
                },
                splitLine: {
                    show: false
                }
            }],
            series: [{
                type: 'bar',
                barWidth: 20,
                data: [60],
                label: {
                    normal: {
                        show: true,
                        position: 'insideBottomRight',
                        formatter: '',
                        distance: 0,
                        offset: [35, 24],
                        padding: [100, 70, 0, 0],
                        backgroundColor: {
                            image: '../../img/AiCarbenChart5_opImg.png'
                        }
                    }
                },
                itemStyle: {
                    normal: {
                        color: new echarts.graphic.LinearGradient(0, 0, 1, 0, [{
                            offset: 0,
                            color: '#061D46' // 0% 处的颜色
                        }, {
                            offset: 1,
                            color: '#00D8FF' // 100% 处的颜色
                        }], false),
                        barBorderRadius: 14
                    }
                }
            }, {
                type: 'bar',
                barWidth: 20,
                data: [60],
                label: {
                    normal: {
                        show: true,
                        position: 'right',
                        formatter: '{c}%',
                        distance: 30,
                        color: '#A8E1F2',
                        fontSize: 28,
                    }
                },
                itemStyle: {
                    normal: {
                        color: 'transparent',
                        barBorderRadius: 14
                    }
                }
            }, {
                type: "bar",
                barWidth: 20,
                xAxisIndex: 0,
                barGap: "-100%",
                data: [100],
                itemStyle: {
                    normal: {
                        color: "rgba(209, 223, 255, 0.12)",
                        barBorderRadius: 14
                    }
                },
                zlevel: -1
            }]
        };
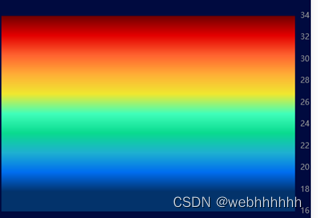
5、彩虹条
相关配置:
option = {
  backgroundColor:"#000a3f",
      tooltip: {
          show:false,

      },
      grid: {
          top: '15%',
          right: '5%',
          left: "5%",
          bottom: '12%'
      },
      xAxis: [{
          show:false,
          type: 'category',

      }],
      yAxis: [{
          name: "",
          position: 'right',
          min:16,
          max:34,
          interval:2,
          axisLabel:{
              color:'#999999'},
          axisTick: {
              show: false
          },
          axisLine: {
              show: false,
          },
          splitLine: {
              show:false,
          }
      }],
      series: [{
          type: 'bar',
          data: [34],
          barWidth: '100%',
          itemStyle: {
              normal: {
                  color: new echarts.graphic.LinearGradient(0, 0, 0, 1, [{
                      offset: 0,
                      color: '#6F0000' // 0% 处的颜色
                  }, {
                      offset: 0.1,
                      color: '#E40000' // 100% 处的颜色
                  },
                  {
                      offset: 0.2,
                      color: '#FF6230' // 100% 处的颜色
                  },
                  {
                      offset: 0.3,
                      color: '#FFAF37' // 100% 处的颜色
                  },
                  {
                      offset: 0.4,
                      color: '#F0E830' // 100% 处的颜色
                  },
                  {
                      offset: 0.5,
                      color: '#41FFBB' // 100% 处的颜色
                  },
                  {
                      offset: 0.6,
                      color: '#0ADB90' // 100% 处的颜色
                  },
                  {
                      offset: 0.7,
                      color: '#1FB1D1' // 100% 处的颜色
                  },
                  {
                      offset: 0.8,
                      color: '#006EF0' // 100% 处的颜色
                  },
                  {
                      offset: 0.9,
                      color: '#03336B' // 100% 处的颜色
                  },
                   {
                      offset: 1,
                      color: '#03336B' // 100% 处的颜色
                  }


                  ], false),

              }
          },

      }]
  };
6、散点图+折线图
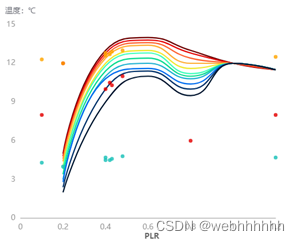
相关配置:
var TemperatureColor=['#6F0000','#E40000','#FF6230','#FFAF37','#F0E830','#41FFBB','#0ADB90','#1FB1D1','#006EF0','#03336B','#011731'];
 var tooltipData2 = ['1#冷机', '2#冷机','3#冷机','4#冷机','5#冷机','6#冷机','7#冷机','8#冷机','9#冷机','10#冷机','11#冷机'];
            var LD2 = ['冷却塔实际功率', '冷却塔名义功率'];
            var serieData2 = [

                {
                    // 红点
                    name: "",
                    type: 'scatter',
                    lineStyle: {
                        width: 1,
                        color: '#E40000'
                    },
                    color: '#E40000',
                    symbolSize: 6,
                    z:99,
                    data: [[0.2, 12], [0.1, 8], [0.8, 6], [1.2, 8],[0.4, 10],[0.43, 10.3],[0.42, 10.5],[0.48, 11]],
                },

                {
                    // 黄点
                    name: "",
                    type: 'scatter',
                    lineStyle: {
                        width: 1,
                        color: 'orange'
                    },
                    color: 'orange',
                    symbolSize: 6,
                    z:99,
                    data: [[0.2, 12], [0.1, 12.3], [0.4, 12.6], [1.2, 12.5],[0.4, 12.8],[0.43, 12.9],[0.42, 12.7],[0.48, 13]],
                },
                {
                    // 蓝点
                    name: "",
                    type: 'scatter',
                    lineStyle: {
                        width: 1,
                        color: '#18C0B8'
                    },
                    color: '#18C0B8',
                    symbolSize: 6,
                    z:99,
                    data: [[0.2, 4], [0.1, 4.3], [0.4, 4.5], [1.2, 4.7],[0.4, 4.7],[0.43, 4.6],[0.42, 4.5],[0.48, 4.8]],
                },


            ];
            var metaDate2 = [
                [ [0.2, 5], [0.4, 13], [0.6, 14], [0.8, 13], [1.0, 12],[1.2, 11.5]],
                 [ [0.2, 4.8], [0.4, 12.8], [0.6, 13.8], [0.8, 12.8], [1.0, 12],[1.2, 11.5]],
                  [ [0.2, 4.6], [0.4, 12.6], [0.6, 13.6], [0.8, 12.4], [1.0, 12],[1.2, 11.5]],
                   [ [0.2, 4.4], [0.4, 12.4], [0.6, 13.4], [0.8, 12], [1.0, 12],[1.2, 11.5]],
                    [ [0.2, 4], [0.4, 12], [0.6, 13], [0.8, 11.6], [1.0, 12],[1.2, 11.5]],
                     [ [0.2, 3.8], [0.4, 11.8], [0.6, 12.8], [0.8, 11.2], [1.0, 12],[1.2, 11.5]],
                      [ [0.2, 3.4], [0.4, 11.4], [0.6, 12.4], [0.8, 11], [1.0, 12],[1.2, 11.5]],
                       [ [0.2, 3], [0.4, 11], [0.6, 12], [0.8, 10.8], [1.0, 12],[1.2, 11.5]],
                        [ [0.2, 2.8], [0.4, 10.8], [0.6, 11.6], [0.8, 10.4], [1.0, 12],[1.2, 11.5]],
                         [ [0.2, 2.4], [0.4, 10], [0.6, 11.4], [0.8, 10], [1.0, 12],[1.2, 11.5]],
                          [ [0.2, 2], [0.4, 9], [0.6, 11], [0.8, 9.5], [1.0, 12],[1.2, 11.5]],
                // [[0,10], [0.2, 3], [0.4, 4], [0.6, 8], [0.8, 4], [1.0, 8],[1.2, 8]],
            ]

            for (var v = 0; v < tooltipData2.length; v++) {
                var serie = {
                    name: tooltipData2[v],
                    type: 'line',
                    smooth: true,
                    symbol: 'none',
                    lineStyle: {
                        width: 2
                    },
                    symbolSize: 10,
                    data: metaDate2[v]
                };
                serieData2.push(serie)
            }
           option= {
                backgroundColor: 'transparent',
                 title: {
                    text: "PLR",
                    left: "center",
                    bottom: "3%",
                    textStyle: {
                        color: "#666666",
                        fontSize: 12
                    }
                },
                legend: {
                    show: true, right: 40,
                    data: LD2,
                    y: "5%",
                    itemWidth: 18,
                    itemHeight: 12,
                    textStyle: { color: "#999", fontSize: 12 },
                },
                color: TemperatureColor,
                grid: {
                    left: '3%',
                    right: '10%',
                    top: '10%',
                    bottom: '8%',
                    containLabel: true
                },
                tooltip: {
                    trigger: 'axis',
                    formatter: function (params) {
                        var html = '';
                        var This_xAxis = '';
                        params.forEach(v => {
                            html += ` <br/>${v.seriesName}:<span style="color:#365CAD;margin-left:10px">${v.value[1]}</span> `

                            This_xAxis = `${v.value[0]}`
                        })
                        return This_xAxis + html
                    },
                },
                xAxis: [
                    {
                        name: '',
                        boundaryGap: false,
                        splitLine: { show: false },
                        axisLine: { show: true, lineStyle: { color: '#999' } },
                        axisLabel: { interval: 0, textStyle: { color: '#999', fontSize: 12 } },
                        axisTick: { show: false },
                    },
                ],
                yAxis: [
                    {
                        type: 'value',
                        name: '温度:℃',
                        axisTick: { show: false },
                        splitLine: { show: false },
                        axisLabel: { textStyle: { color: '#999', fontSize: 12 }, formatter: "{value}" },
                        axisLine: { show: false },
                    },
                ],
                series: serieData2
            };
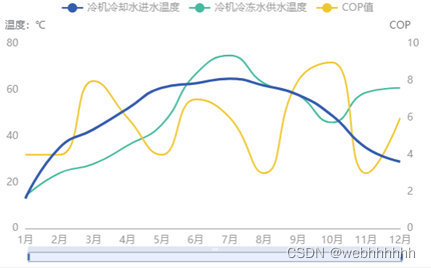
7、双y轴循环数据折线+伸缩轴
相关配置:
var xAxisData3 = ["1月", '2月', '3月', '4月', '5月', '6月', '7月', '8月', '9月', '10月', '11月', '12月'];
            // var LD3 = ['PLR', '电流百分比']
            var legendData3 = ['冷机冷却水进水温度', '冷机冷冻水供水温度','COP值']
            var serieData3 = [
                {
                    name: "冷机冷却水进水温度",
                    type: 'line',
                    smooth: true,
                    symbol: 'none',
                     yAxisIndex: 0,
                    lineStyle: {
                        width: 2,
                        color: '#365CAD'
                    },
                    color: '#365CAD',
                },
                {
                    name: "冷机冷冻水供水温度",
                    type: 'line',
                    smooth: true,
                    symbol: 'none',
                     yAxisIndex: 0,
                    lineStyle: {
                        width: 2,
                        color: '#46B99E'
                    },
                    color: '#46B99E',
                    data: [14, 24, 28, 36, 45, 67, 75, 63, 58, 46, 59, 61]
                },
                {
                    name: "COP值",
                    type: 'line',
                    smooth: true,
                    symbol: 'none',
                     yAxisIndex: 1,
                    lineStyle: {
                        width: 2,
                        color: '#F0C630'
                    },
                    color: '#F0C630',
                    data: [4, 4,8, 6, 4, 7, 6, 3, 8, 9, 3, 6]
                },
            ];
            var metaDate3 = [
                [13, 35, 43, 52, 61, 63, 65, 62, 58, 49, 35, 29],
            ]
            for (var v = 0; v < legendData3.length; v++) {
                var serie = {
                    name: legendData3[v],
                    type: 'line',
                    smooth: true,
                    symbol: 'none',
                    lineStyle: {
                        width: 3
                    },
                    symbolSize: 10,
                    data: metaDate3[v]
                };
                serieData3.push(serie)
            }
            option = {
                backgroundColor: 'transparent',
                legend: {
                    show: true,
                    right: 20,
                    data: legendData3,
                    y: "2%",
                    x:'center',
                    textStyle: { color: "#999", fontSize: 12 },
                },
                color: '#365CAD',
                grid: {
                    left: '3%',
                    right: '5%',
                    bottom: '8%',
                    containLabel: true
                },
                tooltip: {
                    trigger: 'axis',
                },

                xAxis: [
                    {
                        type: 'category',
                        boundaryGap: false,
                        axisLine: { show: true, lineStyle: { color: '#999' } },
                        axisLabel: { interval: 0, textStyle: { color: '#999', fontSize: 12 } },
                        axisTick: { show: false },
                        data: xAxisData3,
                    },
                ],
                yAxis: [
                    {
                        type: 'value',
                        name: '温度:℃',
                        axisTick: { show: false },
                        splitLine: { show: false },
                        axisLabel: { textStyle: { color: '#999', fontSize: 12 } },
                        axisLine: { show: false },

                    },
                     {
                        type: 'value',
                        name: 'COP',
                        axisTick: { show: false },
                        splitLine: { show: false },
                        axisLabel: { textStyle: { color: '#999', fontSize: 12 } },
                        axisLine: { show: false },

                    },
                ],
                 "dataZoom": [{
                    "show": true,
                    "height": 12,
                    "xAxisIndex": [
                        0
                    ],
                    bottom: '4%',
                    handleSize: '110%',
                    handleStyle: {
                        color: "#365CAD",
                    },
                    textStyle: {
                        color: "#365CAD"
                    },
                    borderColor: "#90979c"
                }, {
                    "type": "inside",
                    "show": true,
                    "height": 15,
                }],
                series: serieData3
            };
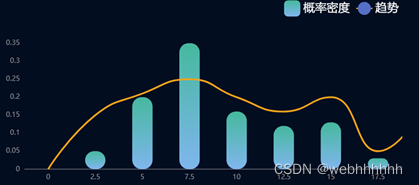
8、柱状图+折线图
相关配置:
var data1 = [0, 0.05, 0.2, 0.35, 0.16, 0.12, 0.13, 0.03, 0.14];
var data2 = [0, 0.15, 0.21, 0.25, 0.2, 0.16, 0.2, 0.05, 0.18];
var xData =[0,2.5,5,7.5,10,12.5,15,17.5]
option = {
    backgroundColor: '#020D20',
    tooltip: {
        trigger: 'axis',
        axisPointer: {
            type: 'shadow',

            textStyle: {
                color: '#05294D',
            },
        },
        backgroundColor: '#05294D',
        borderColor: '#135469',
        borderWidth: 2,
        padding: [20, 20, 20, 20],
        formatter: function (params) {
            // console.log(params.length == 0);
            if (params.length === 0) {
                let result =
                    '<span style="font-size: 24px;font-family: MicrosoftYaHeiUISemibold;color: #FFFFFF;ine-height: 41px;">' +
                    '至少选中一条图例' +
                    '</span>' +
                    '<br>';
                return result;
            } else if (params.length == 1) {
                const paramsArray = [];
                params.forEach((v) => {
                    // console.log(v.name);
                    if (v.seriesName == '趋势') {
                        v.color = '#F3C452';
                    } else {
                        v.color = '#02DBF1';
                    }
                    paramsArray.push({
                        name: v.name,
                        seriesName: v.seriesName,
                        data: v.data,
                        color: v.color,
                    });
                });
                // console.log(paramsArray);
                let result =
                    '<span style="font-size: 24px;font-family: MicrosoftYaHeiUISemibold;color: #FFFFFF;ine-height: 41px;">' +
                    paramsArray[0].name +
                    '</span>' +
                    '<br>';
                result +=
                    '<div style="display:flex;">' +
                    '<div style="font-size: 20px;font-family: MicrosoftYaHeiUI;color: ' +
                    paramsArray[0].color +
                    ';line-height: 25px;margin-top:10px;margin-right:28px;">' +
                    '旅客' +
                    paramsArray[0].seriesName +
                    '<div style="font-size: 24px;font-family: DINAlternate-Bold, DINAlternate;font-weight: bold;color:' +
                    paramsArray[0].color +
                    ';line-height: 33px;">' +
                    paramsArray[0].data +
                    '人公里' +
                    '</div>' +
                    '</div>' +
                    '</div>';
                return result;
            } else {
                let result =
                    '<span style="font-size: 24px;font-family: MicrosoftYaHeiUISemibold;color: #FFFFFF;ine-height: 41px;">' +
                    params[0].name +
                    '</span>' +
                    '<br>';
                result +=
                    '<div style="display:flex;">' +
                    '<div style="font-size: 20px;font-family: MicrosoftYaHeiUI;color: #02DBF1;line-height: 25px;margin-top:10px;margin-right:28px;">' +
                    '旅客' +
                    params[0].seriesName +
                    '<div style="font-size: 24px;font-family: DINAlternate-Bold, DINAlternate;font-weight: bold;color: #02DBF1;line-height: 33px;">' +
                    params[0].data +
                    '人公里' +
                    '</div>' +
                    '</div>' +
                    '<div style="margin-top:10px;font-size: 20px;font-family: MicrosoftYaHeiUI;color: #F3C452;line-height: 25px;">' +
                    '旅客' +
                    params[1].seriesName +
                    '<div style="font-size: 24px;font-family: DINAlternate-Bold, DINAlternate;font-weight: bold;color: #F3C452;line-height: 33px;">' +
                    params[1].data +
                    '人公里' +
                    '</div>' +
                    '</div>' +
                    '</div>';
                return result;
            }
        },
    },
    grid: {
        borderWidth: 0,
        top: '20%',
        left: '65',
        bottom: '25%',
        textStyle: {
            color: '#fff',
        },
    },
    legend: {
        top: '0%',
        right: '10%',
        textStyle: {
            fontSize: '20px',
            fontFamily: 'MicrosoftYaHeiUI',
            color: '#FFFFFF',
        },
        itemWidth: 28,
        itemHeight: 28,
        data: [
            {
                name: '概率密度',
                },
            {
                name: '趋势',
                },
        ],
    },
    xAxis: [
        {
            type: 'category',
            splitLine: {
                show: false,
            },
            axisTick: {
                show: false,
            },
            splitArea: {
                show: false,
            },
            axisLine: { show: true, lineStyle: { color: '#999' } },
            axisLabel: { interval: 0, textStyle: { color: '#999', fontSize: 12 } },
            data: xData,
        },
    ],
    yAxis: [
        {
            type: 'value',
            splitLine: {
                show: false,
            },
            axisLine: {
                show: false,
            },
            axisTick: {
                show: false,
            },
          axisLabel: { textStyle: { color: '#999', fontSize: 12 }},
            splitArea: {
                show: false,
            },
        },
    ],
    series: [
        {
            name: '概率密度',
            type: 'bar',
            // "stack": "总量",
            barMaxWidth: 35,
            barGap: '10%',
            itemStyle: {
                normal: {
                     barBorderRadius: 16,
                    color: {
                        type: 'linear',
                        x: 0,
                        y: 0,
                        x2: 0,
                        y2: 1,
                        colorStops: [
                            {
                                offset: 0,
                                color: '#46B99E', // 0% 处的颜色
                            },
                            {
                                offset: 1,
                                color: '#80B6EE', // 45% 处的颜色
                            },
                        ],
                        global: false, // 缺省为 false
                    },
                },
            },
            data: data1,
        },
        {
            name: '趋势',
            type: 'line',
             smooth: true,
             symbol: 'none',
            // symbolSize: 10,
            // symbol: 'circle',

            lineStyle: {
                normal: {
                    width: 3,
                    color:'#F3A41B'
                },
            },
            data: data2,
        },
    ],
};
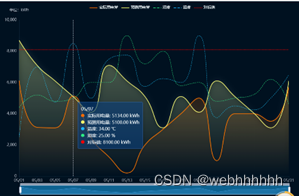
9、区域面积图
相关配置:
var datas = {
    title: ['05/01','05/03','05/05','05/07','05/09','05/11','05/13','05/15','05/17','05/19','05/21','05/23','05/25','05/27','05/29','05/31'],
    D1: [6120, 3132, 3101, 5134, 2490, 1230, 210,2000,3000,4000,5000,1000,4000,4000,3523,5688],
    D2: [10, 28, 19, 34, 20, 30, 31,23,25,24,36,15,18,17,20,26],
    D3: [ 22,26, 24, 25, 30, 30,45,36,40,29,30,24,25,26,31,23],
      D4:[8100, 8100, 8100, 8100, 8100, 8100, 8100,8100,8100,8100,8100,8100,8100,8100,8100,8100,],

    D5:[8700, 7100, 6100, 5100, 4100, 7100, 6100,5100,3100,5100,4100,6100,5100,4100,3100,6100,]
};
option = {
    backgroundColor: '#001120',
    tooltip : {
        show:true,
        trigger: 'axis',
        axisPointer: {
            // type: 'cross',
            label: {
                backgroundColor: '#283b56'
            }
        },
        backgroundColor:  'rgba(8, 61, 123, 0.6)',
         borderWidth: "1", //边框宽度设置1
  borderColor: "rgba(79, 149, 255, 0.5)", //设置边框颜色
         textStyle: {
    color: "#EDF3F6" //设置文字颜色
  },
        formatter:function(params){
            var axValue='';
            let astr=''
            params.forEach((ele,index)=>{
            axValue=ele.axisValue
            console.log(ele.seriesName,66)
            console.log(ele.color,444)
            var color='';
           var  LineName=ele.seriesName;
           var LineData=ele.data.toFixed(2);
           if(LineName=="实际用电量"){
               color='#FF6B00';
                LineData=LineData+' kWh'
           }else if(LineName=="预测用电量"){
               color='#FCFF6D';
                LineData=LineData+' kWh'
           }else if(LineName=="湿度"){color='#2DE883';
           LineData=LineData+' %'

           }else if(LineName=="温度"){
               color='#1BB4FF';
               LineData=LineData+' ℃'

           }else if(LineName=="对标值"){
               color='#FF0000';
                LineData=LineData+' kWh'

           }

            astr +=`<div ><i style="width: 10px;height: 10px;display: inline-block;background: ${color};border-radius: 10px;margin-right:10px"></i><span>${ele.seriesName}: ${LineData}</span></div>`
            })
            const Newastr=`<div>${axValue}</div>${astr}`
            return Newastr;

        }

    },
    color:[],
    legend: {
        data:['实际用电量','预测用电量','湿度','温度','对标值'],
        top:10,
        textStyle: {
            color: '#EDF3F6'
        }
    },
    grid: {
        left: '3%',
        right: '2%',
        bottom: '10%',
        containLabel: true
    },
    xAxis : [
        {
            type : 'category',
            data : datas.title,
            boundaryGap: false,
            splitLine: {
                show: false
            },
            axisLine: {
                lineStyle: {
                     color: 'rgba(78, 128, 163, 0.2)'
                }

            },
             axisLabel: {
           textStyle: {
                color: '#A9AFBA',
                fontSize: '12',
            }
        }
        }
    ],
    yAxis : [
        {
            name:'单位:kWh',
             nameTextStyle: {
            color: "#A9AFBA",
            fontSize: 12,
            padding: [0, 0, 10, 0]
        },
            type : 'value',
             axisLabel: {
                textStyle: {
                color: '#A9AFBA',
                fontSize: '12',
            }

            },
            splitLine: {
                show: false
            },
            axisLine: {
                show:true,
                lineStyle: {
                    color: 'rgba(78, 128, 163, 0.2)'
                }
            }
        },
        {
            name:'温度:℃',
            show:false,
             nameTextStyle: {
            color: "#A9AFBA",
            fontSize: 12,
            padding: [0, -20, 10, 0]
        },
            type : 'value',
            splitLine: {
                show: false
            },
             axisLabel: {
                textStyle: {
                color: '#A9AFBA',
                fontSize: '12',
            }

            },
            axisLine: {
                show:true,
                lineStyle: {
                    color: 'rgba(78, 128, 163, 0.2)'
                }
            }
        },
        {
            name:'湿度:%',
            show:false,
             nameTextStyle: {
            color: "#A9AFBA",
            fontSize: 12,
            padding: [0, -20, 10, 0]
        },
            type : 'value',
            offset:70,
            splitLine: {
                show: false
            },
             axisLabel: {
                textStyle: {
                color: '#A9AFBA',
                fontSize: '12',
            }

            },
            axisLine: {
                show:true,
                lineStyle: {
                    color: 'rgba(78, 128, 163, 0.2)'
                }
            }
        },
    ],
     "dataZoom": [
        {
            "show": true,
            "height": 30,
            "xAxisIndex": [
                0
            ],
            bottom:'5%',
             fillerColor:"rgba(27, 180, 255, 0.5)",
        },
        {
            "type": "inside",

        }
    ],

    series : [
         {
            name:'实际用电量',
             type:'line',
            yAxisIndex: 0,
            barWidth: 20,
             smooth:true,
             symbol:"none",
            itemStyle: {
            normal:{lineStyle:{
                  width:2,
                    color: '#FF6B00',
              }}
            },
             areaStyle: {
                normal: {
                    color: new echarts.graphic.LinearGradient(0, 0, 0, 1, [{
                            offset: 0,
                            color: 'rgba(255,107,0,0.3)'
                        },
                        {
                            offset: 1,
                            color: 'rgba(255,107,0,0)'
                        }
                    ], false),
                    shadowColor: 'rgba(217,247,249,0.9)',
                    // shadowBlur: 5
                }
            },
            // itemStyle: {
            //   barBorderRadius: 20,
            //   color: new echarts.graphic.LinearGradient(0, 0, 0, 1, [{
            //             offset: 0,
            //             color: "#FDA344"
            //         },
            //         {
            //             offset: 1,
            //             color: "rgba(253,163,68,0)"
            //         }
            //     ])
            // },
            data:datas.D1
        },
        {
            name:'预测用电量',
            type:'line',
            yAxisIndex: 0,
            barWidth: 20,
             smooth:true,
             symbol:"none",
            itemStyle: {
            normal:{lineStyle:{
                  width:2,
                    color: '#FCFF6D',
              }}
            },
               areaStyle: {
                normal: {
                    color: new echarts.graphic.LinearGradient(0, 0, 0, 1, [{
                            offset: 0,
                            color: 'rgba(252,255,109,0.3)'
                        },
                        {
                            offset: 1,
                            color: 'rgba(252,255,109,0)'
                        }
                    ], false),
                    shadowColor: 'rgba(217,247,249,0.9)',
                    shadowBlur: 20
                }
            },
            // itemStyle: {
            //   barBorderRadius: 20,
            //   color: new echarts.graphic.LinearGradient(0, 0, 0, 1, [{
            //             offset: 0,
            //             color: "#FDA344"
            //         },
            //         {
            //             offset: 1,
            //             color: "rgba(253,163,68,0)"
            //         }
            //     ])
            // },
            data:datas.D5
        },

           {
            name:'温度',
            type:'line',
            yAxisIndex: 1,
           symbol:"none",
            smooth:true,

            itemStyle: {
                color:'pink',
               normal:{lineStyle:{
                  width:1,
                    color: '#1BB4FF',
                    type:'dashed'
              }}

            },


            data:datas.D2
        },
         {
            name:'湿度',
            type:'line',
            yAxisIndex: 2,
            symbol:"none",
            smooth:true,
            itemStyle: {
            normal:{lineStyle:{
                  width:1,
                    color: '#2DE883',
                     type:'dashed'
              }}
            },
            data:datas.D3
        },
        // 虚线
         {
            name:'对标值',
            type:'line',
            yAxisIndex: 0,
           symbol:"none",
            itemStyle: {
              barBorderRadius: 20,

              normal:{
                   lineStyle:{
                  width:2,
                  color: '#FF0000',
                  type:'dotted'
              }
              }

            },
            data:datas.D4
        },

    ]};

myChart.setOption(option)
10、双x轴,共用y轴柱状图
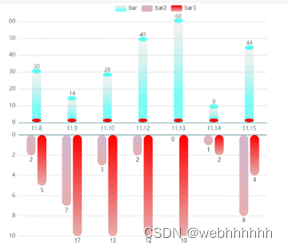
相关配置:
var dataAll = [
            [30,14,28,49,60,9,44],
            [2,7,3,2,0,1,8],
            [5,17,13,12,10,2,4],


        ];
        option = {
            color: ['#3398DB'],
            tooltip : {
               show: true,
                    trigger: 'axis',
                     axisPointer : {            // 坐标轴指示器,坐标轴触发有效
                    type : 'shadow'        // 默认为直线,可选为:'line' | 'shadow'
                },
                    backgroundColor: 'rgba(8, 61, 123, 0.6)',
                    borderWidth: "1", //边框宽度设置1
                    borderColor: "rgba(79, 149, 255, 0.5)", //设置边框颜色
                    textStyle: {
                        color: "#EDF3F6" //设置文字颜色
                    },
            },
            legend: {
                data: ['bar', 'bar2','bar3'],
                align: 'left'
            },
            grid: [
                {x: '7%', y: '7%', width: '78%', height: '38%'},

                {x: '7%', y2: '12.3%', width: '78%', height: '38%'},

            ],
            xAxis : [
                {gridIndex: 0, data : ['11.8', '11.9', '11.10', '11.12', '11.13', '11.14', '11.15'],  axisTick: {show: false},nameGap:'50'},
                {gridIndex: 1, data : ['11.8', '11.9', '11.10', '11.12', '11.13', '11.14', '11.15'],axisLabel:{show:false},axisTick: {show: false},},
            ],
            yAxis : [
                {gridIndex: 0, min: 0, max: 60,splitLine:{lineStyle:{type:'dashed'}}},
                {gridIndex: 1, min: 0, max: 10,inverse:true,splitLine:{lineStyle:{type:'dashed'}}},

            ],
            series : [
                {
                    name: 'bar',
                    type: 'bar',
                    xAxisIndex: 0,
                    yAxisIndex: 0,
                    data: dataAll[0],
                     itemStyle: {
                normal: {
                    color: new echarts.graphic.LinearGradient(0, 0, 0, 0.7, [
                        {
                            offset: 0,
                            color: 'rgba(210,210,210,0.3)',
                        },
                        {
                            offset: 1,
                            color: '#5BFCF4',
                        },
                    ]),
                    opacity: 0.8,
                },
            },
                    barWidth:20,

                    label: {
                        normal: {
                            show: true,
                            position: 'top'
                        }
                    },
                },
                 {
            name: '上部圆',
            type: 'pictorialBar',
            silent: true,
            symbolSize: [20, 10],
            symbolOffset: [0, -7],
            symbolPosition: 'end',
            z: 12,
            color: '#5BFCF4',
            tooltip:{show:false},
            data: dataAll[0],
        },
        {
            name: '底部圆',
            type: 'pictorialBar',
            silent: true,
            symbolSize: [20, 8],
            symbolOffset: [0, -1],
            z: 12,
            color: 'red',
             tooltip:{show:false},
           data: dataAll[0],
        },
        // 下面柱状图1
                {
                    name: 'bar2',
                    type: 'bar',
                    xAxisIndex: 1,
                    yAxisIndex: 1,
                    data: dataAll[1],
                    itemStyle:{normal:{
                        color:new echarts.graphic.LinearGradient(
                      0, 1, 0, 0,
                    [
                        {offset: 1, color: 'rgb(210,184,206)'},
                        {offset: 0, color: 'rgb(230,176,176)'}
                    ]
                 ),barBorderRadius: 12,}


                    },
                    barWidth:20,
                    label: {
                        normal: {
                            show: true,
                            position: 'bottom'
                        }
                    },
                },
                // 下面柱状图2
                  {
                    name: 'bar3',
                    type: 'bar',
                    xAxisIndex: 1,
                    yAxisIndex: 1,
                    data: dataAll[2],
                    itemStyle:{normal:{color:new echarts.graphic.LinearGradient(
                      0, 1, 0, 0,
                    [
                        {offset: 1, color: 'red'},
                        {offset: 0, color: 'rgb(230,176,176)'}
                    ]
                 ),barBorderRadius: 12,}},
                    barWidth:20,
                    label: {
                        normal: {
                            show: true,
                            position: 'bottom'
                        }
                    },
                },
            ]
        };
11、双层饼图
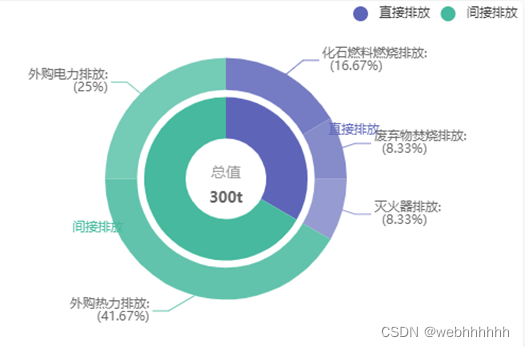
相关配置:
setpagec()
        function setpagec() {
            var myChart = echarts.init(document.getElementById("page3"));
            option = {
                backgroundColor: "#FFF",
                // tooltip: {
                //   trigger: "item",
                //   formatter: "{a} <br/>{b}: {c} ({d}%)",
                // },
                legend: {
                    top: '0',
                    right: "left",
                    icon: "circle",
                    data: [
                        "直接排放",
                        "间接排放"
                    ],
                },
                title: [
                    {
                        text: '总值',
                        subtext: "300t",
                        left: "center",
                        top: "45%",
                        textStyle: {
                            fontSize: 14,
                            fontWeight: "normal",
                            color: "#999999",
                            lineHeight: 0,
                        },
                        subtextStyle: {
                            fontSize: 14,
                            lineHeight: 0,
                            fontWeight: "bolder",
                            color: "#666666",
                        },
                    },
                ],
                series: [
                    {
                        type: "pie",
                        selectedMode: "single",
                        center: ["center", "center"],
                        radius: ['38', "46%"],
                        color: ["rgba(94, 101, 184, 1)", "rgba(70, 185, 158, 1)"],
                        label: {
                            show: false
                        },
                        labelLine: {
                            normal: {
                                show: false,
                            },
                        },
                        data: [
                            //{value:335, name:'食品生产', selected:true},
                            { value: 100, name: "直接排放" },
                            { value: 200, name: "间接排放" },
                        ],
                    },
                    {
                        type: "pie",
                        radius: ["50%", "68%"],
                        center: ["center", "center"],
                        color: [
                            "rgba(94, 101, 184, 0.85)",
                            "rgba(94, 101, 184, 0.75)",
                            "rgba(94, 101, 184, 0.65)",

                            "rgba(70, 185, 158, 0.85)",
                            "rgba(70, 185, 158, 0.75)",
                        ],
                        label: {
                            normal: {
                                // formatter: "{b}:\n  {c}t ({d}%)",
                                formatter: "{b}:\n  ({d}%)",
                                lineHeight: 14,
                                color: '#666666',
                            },
                        },
                        data: [
                            { value: 40, name: "化石燃料燃烧排放" },
                            { value: 20, name: "废弃物焚烧排放" },
                            { value: 20, name: "灭火器排放" },

                            { value: 100, name: "外购热力排放" },
                            { value: 60, name: "外购电力排放" },
                        ],
                    },
                ],
            };

            if (option && typeof option === "object") {
                myChart.setOption(option, true);
            }
            //监听窗口改变,图形重置大小
            window.addEventListener('resize', function () {
                myChart.resize()
            });
        }
12、圆环图2

相关配置:
option =
{
                backgroundColor: "#FFF",
                tooltip: {
                  trigger: "item",
                  formatter: "{a} <br/>{b}: {c} ({d}%)",
                },
                legend: {
                    bottom: '20',
                    right: "center",
                    icon: "circle",
                    data: [
                        "空压机组20t",
                        "冷水机组100t",
                        "水泵70t"
                    ],
                },
                title: [
                    {
                        text: '节省标煤',
                        subtext: "186t",
                        left: "center",
                        top: "45%",
                        textStyle: {
                            fontSize: 16,
                            fontWeight: "normal",
                            color: "#3B4A6A",
                            lineHeight: 0,
                        },
                        subtextStyle: {
                            fontSize: 18,
                            lineHeight: 0,
                            fontWeight: "bolder",
                            color: "#3B4A6A",
                        },
                    },
                ],
                series: [

                    {
                        type: "pie",
                        radius: ["50%", "68%"],
                        center: ["center", "center"],
                        color: [
                            "#F9BE00",
                            "#3F85FF",
                            "#78D376",
                        ],
                        label: {
                            normal: {
                                // formatter: "{b}:\n  {c}t ({d}%)",
                                formatter: "{b}:\n  ({d}%)",
                                lineHeight: 14,
                                color: '#666666',
                            },
                        },
                        data: [
                            { value: 40, name: "空压机组20t" },
                            { value: 20, name: "冷水机组100t" },
                            { value: 20, name: "水泵70t" },
                        ],
                    },
                ],
            };
13、排名
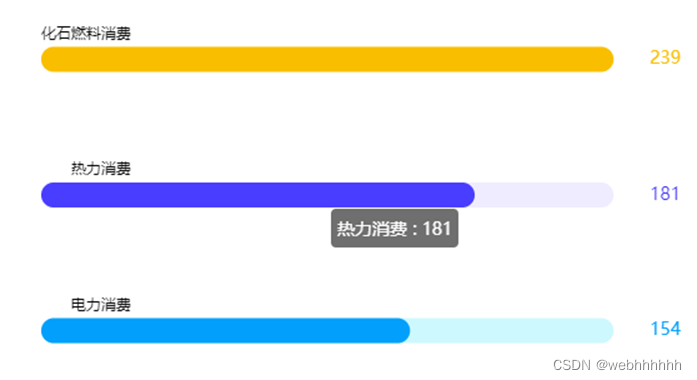
相关配置:
var salvProName =["化石燃料消费","热力消费","电力消费"];
var salvProValue =[239,181,154];
var ColorList=["#F9BE00","#4339F2","#02A0FC"];
var bgColorList=["#FFF5CC","#DAD7FE","#CCF8FE"];
var salvProMax =[];//背景按最大值
for (let i = 0; i < salvProValue.length; i++) {
    salvProMax.push(salvProValue[0])
}
option = {
    backgroundColor:"transparent",
    grid: {
        left: '0',
        right: '3%',
        bottom: '2%',
        top: '2%',
        containLabel: true
    },
     legend: {
                    bottom: '20',
                    // right: "center",
                    icon: "circle",
                    // color:'#fff',
                    show:"true",
                    data: [
                        "化石燃料消费",
                        "热力消费",
                        "电力消费"
                    ],
                },
    tooltip: {
        trigger: 'axis',
        axisPointer: {
            type: 'none'
        },
        formatter: function(params) {
            return params[0].name  + ' : ' + params[0].value
        }
    },
    xAxis: {
        show: false,
        type: 'value'
    },
    yAxis: [
        {
        type: 'category',
        inverse: true,
        axisLabel: {
            show: true,
            padding: [0, -80, 40,0],
            textStyle: {
                color: '#000'
            },
        },
        splitLine: {
            show: false
        },
        axisTick: {
            show: false
        },
        axisLine: {
            show: false
        },
        data: salvProName
    }, {
        type: 'category',
        inverse: true,
        axisTick: 'none',
        axisLine: 'none',
        show: true,
        axisLabel: {
            textStyle: {
                color: function(params,index) {
                   return ColorList[index]
                    },
                fontSize: '14'
            },
        },
        data:salvProValue
    }],
    series: [{
            name: '值',
            type: 'bar',
            zlevel: 1,
            itemStyle: {
                normal: {
                    barBorderRadius: 30,
                    color: function(params) {
                            var num=ColorList.length;
                            return ColorList[params.dataIndex%num]
                    },
                },
            },
            barWidth: 20,
            data: salvProValue
        },
        {
            name: '背景',
            type: 'bar',
            barWidth: 20,
            barGap: '-100%',
            data: salvProMax,
            itemStyle: {
                normal: {
                   color: function(params) {
                            var num=bgColorList.length;
                            return bgColorList[params.dataIndex%num]
                    },
                    barBorderRadius: 30,
                }
            },
        },
    ]
};
14、饼图
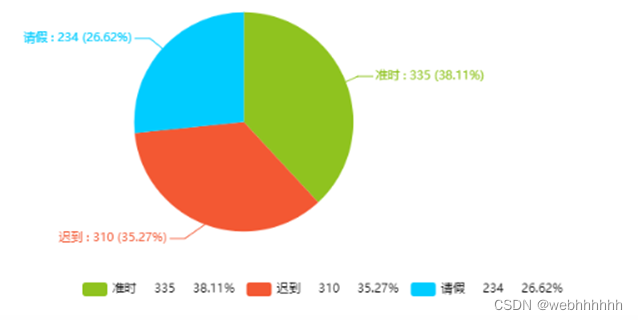
相关配置:
option = {
	    tooltip : {
	        trigger: 'item',
	        formatter: "{a} <br/>{b} : {c} ({d}%)"
	    },
	    color:['#8fc31f','#f35833','#00ccff','#ffcc00'],
	    legend: {
	       // orient: 'vertical',
	       // x: 'center',
	       // y:'bottom',
	        data: ['准时','迟到','请假'],
	        formatter:function(name){
	        	var oa = option.series[0].data;
	        	var num = oa[0].value + oa[1].value + oa[2].value ;
	        	for(var i = 0; i < option.series[0].data.length; i++){
                    if(name==oa[i].name){
                    	return name + '     ' + oa[i].value + '     ' + (oa[i].value/num * 100).toFixed(2) + '%';
                    }
	        	}
	        },
	          bottom: '5%',
        textStyle: {
            color: '#000',
        },
        itemGap: 12,
	    },
	    series : [
	        {
	            name: '签到比例分析',
	            type: 'pie',
	            radius : '55%',
	            center: ['40%', '50%'],
	            data:[
	                {value:335, name:'准时'},
	                {value:310, name:'迟到'},
	                {value:234, name:'请假'},

	            ],
	            itemStyle: {
	                emphasis: {
	                    shadowBlur: 10,
	                    shadowOffsetX: 0,
	                    shadowColor: 'rgba(0, 0, 0, 0.5)'
	                }
	            },
	            itemStyle: {
	                normal: {
	                    label:{
                            show: true,
//	                            position:'inside',
                            formatter: '{b} : {c} ({d}%)'
                        }
	                },
                    labelLine :{show:true}
	            }
	        }
	    ]
	};
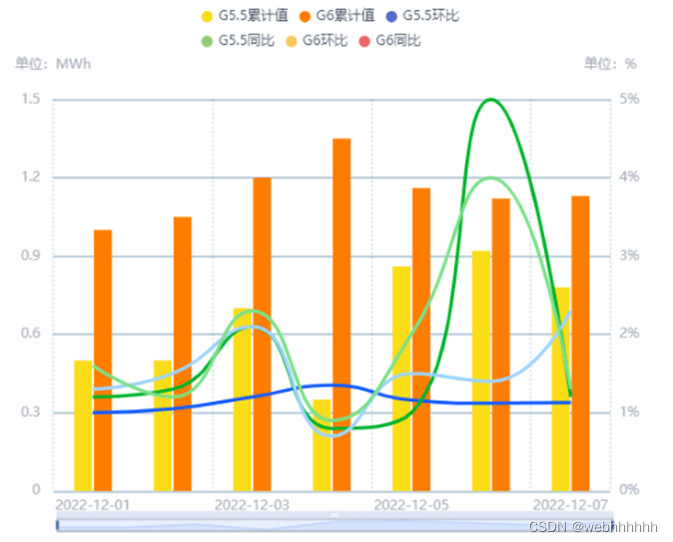
15、柱状折线图
相关配置:
Opiton配置:

// G5.5累计值
var G5Data = [0.5, 0.5, 0.7, 0.35, 0.86, 0.92, 0.78, 0.63, 0.84];
// G6累计值
var G6Data=[1, 1.05, 1.2, 1.35, 1.16, 1.12, 1.13, 1.03, 1.14]

// G5.5环比
var G5HuanData=[1, 1.05, 1.2, 1.35, 1.16, 1.12, 1.13, 1.03, 1.14]

// G5.5同比
var G5TongData=[1.2,1.3,2.1,0.8,1,5,1.2,2.3,1.8,2.1]
// G6环比
var G6HuanData=[1.3,1.5,2.1,0.7,1.5,1.4,2.3,2.3,2.4,1.6]
// G6同比
var G6TongData=[1.6,1.2,2.3,0.9,2,4,1.3,1.3,2.8,2.4]
var data2 = [0, 0.15, 0.21, 0.25, 0.2, 0.16, 0.2, 0.05, 0.18];
var xData =["2022-12-01","2022-12-02","2022-12-03","2022-12-04","2022-12-05","2022-12-06","2022-12-07"]
option = {
    backgroundColor: 'transparent',
    tooltip: {
        trigger: 'axis',
        padding: [20, 20, 20, 20],
    },
    grid: {
        borderWidth: 0,
        top: '20%',
        left: '65',
        bottom: '10%',
        textStyle: {
            color: '#fff',
        },
    },
    legend: {
        top: '3%',
        right: 'center',
        textStyle: {
            fontSize: '12px',
            color: '#4E5969',
        },
        icon: "circle",   //  这个字段控制形状  类型包括 circle,rect ,roundRect,triangle,diamond,pin,arrow,none
        itemWidth: 10,  // 设置宽度
        itemHeight: 10, // 设置高度
        itemGap: 10, // 设置间距
    },
    xAxis: [
        {
            type: 'category',
            splitLine: {
                        show: true,
                        lineStyle: {
                            color: 'rgba(78, 128, 163, 0.2)',
                             width: 2,
                              type: 'dotted'
                        }
                    },

            axisTick: {
                show: false,
            },
            splitArea: {
                show: false,
            },
            axisLine: {
                        show: false,
                        lineStyle: {
                            color: '#A9AFBA'
                        }
                    },

             axisLabel: {
                        color: '#A9AFBA',
                        fontSize: 12,
                    },

            data: xData,
        },
    ],
    yAxis: [
        {
            type: 'value',
             name:'单位:MWh',
             nameTextStyle: {
            color: "#A9AFBA",
            fontSize: 12,
            padding: [0, 0, 10, 0]
        },

          splitLine: {
                        show: true,

                        lineStyle: {
                            color: 'rgba(78, 128, 163, 0.2)',
                             width: 2,

                        }
                    },

             axisLine: {
                        lineStyle: {
                            color: '#A9AFBA'
                        }
                    },

            axisTick: {
                show: false,
            },
           axisLabel: {
                        formatter: '{value} ',
                        textStyle: {
                            color: '#A9AFBA',
                            fontSize: 12,
                        }
                    },

            splitArea: {
                show: false,
            },
        },
        {
             type: 'value',
              name:'单位:%',
             nameTextStyle: {
            color: "#A9AFBA",
            fontSize: 12,
            padding: [0, 0, 10, 0]
        },

          splitLine: {
                        show: true,

                        lineStyle: {
                            color: 'rgba(78, 128, 163, 0.2)',
                             width: 2,

                        }
                    },

             axisLine: {
                        lineStyle: {
                            color: '#A9AFBA'
                        }
                    },

            axisTick: {
                show: false,
            },
           axisLabel: {
                        formatter: '{value}% ',
                        textStyle: {
                            color: '#A9AFBA',
                            fontSize: 12,
                        }
                    },

            splitArea: {
                show: false,
            },

        }
    ],
     "dataZoom": [{
                    "show": true,
                    "height": 12,
                    "xAxisIndex": [
                        0
                    ],
                    bottom: '4%',
                    handleSize: '110%',
                    handleStyle: {
                        color: "#365CAD",
                    },
                    textStyle: {
                        color: "#365CAD"
                    },
                    borderColor: "#90979c"
                }, {
                    "type": "inside",
                    "show": true,
                    "height": 15,
                }],

    series: [
        {
            name: 'G5.5累计值',
            type: 'bar',
            // "stack": "总量",
            barMaxWidth: 16,
            barGap: '10%',
            itemStyle: {
                normal: {
                     color:'#FADC19'
                },
            },
            data: G5Data,
        },
        {
            name: 'G6累计值',
            type: 'bar',
            // "stack": "总量",
            barMaxWidth: 16,
            barGap: '10%',
            itemStyle: {
                normal: {
                     color:'#FF7D00'
                },
            },
            data: G6Data,
        },


        {
             name: 'G5.5环比',
              yAxisIndex: 1,
            type: 'line',
             smooth: true,
             symbol: 'none',
            lineStyle: {
                normal: {
                    width: 3,
                   color:'#165DFF'
                },
            },
            data:G5HuanData
        },

        {
             name: 'G5.5同比',
             yAxisIndex: 1,
            type: 'line',
             smooth: true,
             symbol: 'none',
            lineStyle: {
                normal: {
                    width: 3,
                   color:'#00B42A'
                },
            },
            data:G5TongData
        },
         {
             name: 'G6环比',
             yAxisIndex: 1,
            type: 'line',
             smooth: true,
             symbol: 'none',
            lineStyle: {
                normal: {
                    width: 3,
                   color:'#9FD4FD'
                },
            },
            data:G6HuanData
        },
        {
             name: 'G6同比',
             yAxisIndex: 1,
             type: 'line',
             smooth: true,
             symbol: 'none',
            lineStyle: {
                normal: {
                    width: 3,
                   color:'#7BE188'
                },
            },
            data:G6TongData
        },
    ],
};
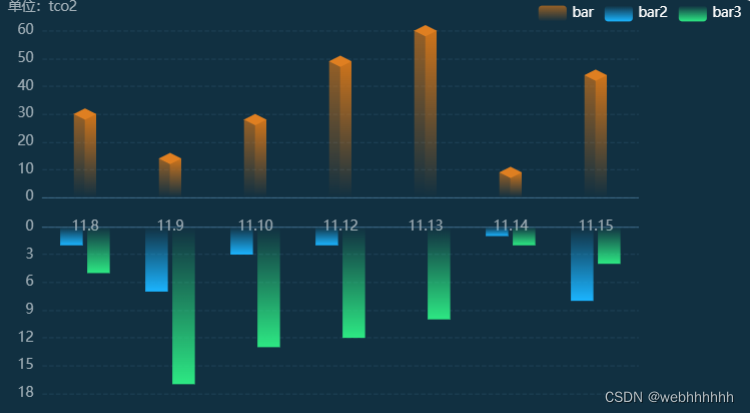
16、双x轴
相关配置:
 var dataAll = [
            [30, 14, 28, 49, 60, 9, 44],
            [2, 7, 3, 2, 0, 1, 8],
            [5, 17, 13, 12, 10, 2, 4],
        ];

        option = {
            color: ['#3398DB'],
            backgroundColor: '#113041',
            tooltip: {
                show: true,
                trigger: 'axis',
                axisPointer: {            // 坐标轴指示器,坐标轴触发有效
                    type: 'shadow'        // 默认为直线,可选为:'line' | 'shadow'
                },
                backgroundColor: 'rgba(8, 61, 123, 0.6)',
                borderWidth: "1", //边框宽度设置1
                borderColor: "rgba(79, 149, 255, 0.5)", //设置边框颜色
                textStyle: {
                    color: "#EDF3F6" //设置文字颜色
                },
            },
            legend: {
                // orient: 'vertical',
                x: 'right',
                padding: [5, 10],
                //         y: 'bottom',
                textStyle: { //图例文字的样式
                    color: '#fff',
                    fontSize: 12
                },
                data: ['bar', 'bar2', 'bar3'],
                // align: 'left',

            },
            grid: [
                { x: '7%', y: '7%', width: '78%', height: '38%' },

                { x: '7%', y2: '10.3%', width: '78%', height: '38%' },

            ],
            xAxis: [
                {
                    gridIndex: 0,
                    data: ['11.8', '11.9', '11.10', '11.12', '11.13', '11.14', '11.15'],
                    axisTick: { show: false },
                    axisLine: {
                        lineStyle: {
                            color: 'rgba(78, 128, 163, 0.6)',
                            width: 1,//这里是为了突出显示加上的
                        }
                    },
                    axisLabel: { //坐标轴刻度标签的相关设置
                        margin: 20, //刻度标签与轴线之间的距离
                        color: '#A1AFB7'

                    }
                },
                {
                    gridIndex: 1,
                    data: ['11.8', '11.9', '11.10', '11.12', '11.13', '11.14', '11.15'],
                    axisLabel: { show: false, },
                    axisLine: {
                        lineStyle: {
                            color: 'rgba(78, 128, 163, 0.6)',
                            width: 1,//这里是为了突出显示加上的
                        }
                    },
                    axisTick: { show: false, },

                },
            ],
            yAxis: [
                {
                    name: "单位:" + "tco2",
                    gridIndex: 0, min: 0,
                    splitLine: {
                        lineStyle: { type: 'dashed', color: 'rgba(78, 128, 163, 0.2)' }

                    },
                    axisLine: {
                        lineStyle: {
                            color: '#A1AFB7',
                            width: 1,//这里是为了突出显示加上的
                        }
                    }

                },
                {
                    gridIndex: 1, min: 0, inverse: true,
                    splitLine: {
                        lineStyle: { type: 'dashed', color: 'rgba(78, 128, 163, 0.2)' }

                    },
                    axisLine: {
                        lineStyle: {
                            color: '#A1AFB7',
                            width: 1,//这里是为了突出显示加上的
                        }
                    }

                },

            ],
            series: [
                {
                    name: 'bar',
                    type: 'bar',
                    xAxisIndex: 0,
                    yAxisIndex: 0,
                    data: dataAll[0],
                    itemStyle: {
                        normal: {
                            color: {
                                x: 0,
                                y: 0,
                                x2: 0,
                                y2: 1,
                                colorStops: [
                                    { offset: 0, color: 'rgba(206,116,27, 1)' },
                                    { offset: 1, color: 'rgba(206,116,27, 0)' }
                                ]
                            },
                            opacity: 0.7
                        },
                    },
                    barWidth: 10,

                    label: {
                        show: false,
                        position: [20 / 2, -(20 + 20)],
                        color: '#ffffff',
                        fontSize: 14,
                        fontStyle: 'bold',
                        align: 'center',
                    },
                }, {
                    z: 1,
                    type: 'bar',
                    barWidth: 10,
                    barGap: '-2%',
                    symbolOffset: [0, -8],
                    data: dataAll[0],
                    offset: 10,
                    itemStyle: {
                        normal: {
                            color: {
                                x: 0,
                                y: 0,
                                x2: 0,
                                y2: 1,
                                colorStops: [
                                    { offset: 0, color: 'rgba(206,116,27, 1)' },
                                    { offset: 1, color: 'rgba(206,116,27, 0)' }
                                ]
                            },
                            opacity: 1
                        }
                    }
                },


                {
                    z: 3,
                    type: 'pictorialBar',
                    symbolPosition: 'end',
                    data: dataAll[0],
                    symbol: 'diamond',
                    symbolOffset: [0, '-50%'],
                    symbolSize: [20, 20 * 0.5],
                    itemStyle: {
                        normal: {
                            borderWidth: 0,
                            color: function (params) {
                                return 'rgba(223,127,33,1)'
                            },

                        }
                    },
                },
                // 下面柱状图1-蓝
                {
                    name: 'bar2',
                    type: 'bar',
                    xAxisIndex: 1,
                    yAxisIndex: 1,
                    data: dataAll[1],
                    itemStyle: {
                        normal: {
                            color: new echarts.graphic.LinearGradient(
                                0, 1, 0, 0,
                                [
                                    { offset: 1, color: 'rgb(27,180,255,0)' },
                                    { offset: 0, color: 'rgb(27,180,255,1)' }
                                ]
                            ), barBorderRadius: 0,
                        }

                    },
                    barWidth: 20,
                    label: {
                        normal: {
                            show: false,
                            position: 'bottom'
                        }
                    },
                },
                // 下面柱状图2-绿
                {
                    name: 'bar3',
                    type: 'bar',
                    xAxisIndex: 1,
                    yAxisIndex: 1,
                    data: dataAll[2],
                    itemStyle: {
                        normal: {
                            color: new echarts.graphic.LinearGradient(
                                0, 1, 0, 0,
                                [
                                    { offset: 1, color: 'rgba(45,232,131,0)' },
                                    { offset: 0, color: 'rgba(45,232,131,1)' }
                                ]
                            ), barBorderRadius: 0,
                        }
                    },
                    barWidth: 20,
                    label: {
                        normal: {
                            show: false,
                            position: 'bottom'
                        }
                    },
                },
            ]
        }
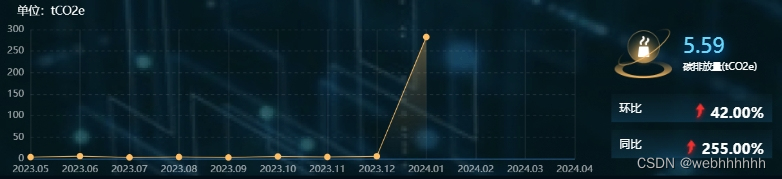
17、折线图,重新定义tooltip且显示在图表右侧,鼠标移入对应数据上右侧数据跟着变动
相关代码:
注意:
(1)代码示例是一个vue2.0写的一个组件,数据由父组件传递过来,格式类似于"chartData "
(2)图片此处使用的是本地图片,想要正确显示需要替换成正确图片路径
(3)./mixins/resize文件为监听容器尺寸变化的js,可不用
(4)tooltip里面return的内容里面自定义的class需要设置为全局才会生效
<template>
  <!-- 碳排放总量 -->
  <div class="ub h100 w100">
    <div
      class="flex1"
      :class="className"
      :style="{ height: height, width: width }"
    ></div>
  </div>
</template>


      <script>
import * as echarts from "echarts"; //echarts
import resize from "./mixins/resize";//可不用
import upImg from "@/assets/images/home/upicon.png";
import downImg from "@/assets/images/home/downicon2.png";
export default {
  mixins: [resize],
  props: {
    className: {
      type: String,
      default: "chart",
    },
    width: {
      type: String,
      default: "500px",
    },
    height: {
      type: String,
      default: "100%",
    },
    chartData: {
      type: Object,
      default: () => {},
    },
  },
  watch: {
    chartData: {
      deep: true, //深度监听
      //   immediate: true, //立即监听
      handler(val) {
        this.initChart();
      },
    },
  },
  data() {
    return {
      chart: null,
      data1: "右边数据",
      upImg: upImg,
      downImg: downImg,
      tooltipData: {},
    };
  },
  created() {
    this.initChart();
  },
  mounted() {
    this.$nextTick(() => {
      this.initChart();
    });
  },
  computed: {},
  beforeDestroy() {
    if (!this.chart) {
      return;
    }
    this.chart.dispose();
    this.chart = null;
  },
  methods: {
    initChart() {
      this.chart = echarts.init(this.$el, "macarons");
      //   let chartData = {
      //     xData: ["1", "2", "3", "4", "5", "6"],
      //     list: [
      //       {
      //         value: 60,
      //         tong: 12,
      //         huan: 20,
      //       },
      //       {
      //         value: 50,
      //         tong: 1,
      //         huan: 2,
      //       },
      //       {
      //         value: 40,
      //         tong: 112,
      //         huan: 120,
      //       },
      //       {
      //         value: 30,
      //         tong: 31,
      //         huan: 52,
      //       },
      //       {
      //         value: 70,
      //         tong: 62,
      //         huan: 40,
      //       },
      //       {
      //         value: 60,
      //         tong: 51,
      //         huan: 32,
      //       },
      //     ],
      //   };

      let chartData = this.chartData;
      let option = {
        backgroundColor: "transparent",
        grid: {
          left: "20",
          right: "250",
          top: "40",
          bottom: "60",
          containLabel: true,
        },
        tooltip: {
          //   show: true,
          //   触发方式为坐标轴触发
          trigger: "axis",
          position: ["78%", 0],
          show: true, // 默认显示提示框
          backgroundColor: "rgba(0,0,0,0)", // 提示框背景颜色
          borderColor: "rgba(0,0,0,0)", // 提示框边框颜色
          borderWidth: 1, // 提示框边框宽度
          padding: 10, // 提示框内边距
          textStyle: {
            color: "#fff", // 提示框文字颜色
          },
          // 总是显示提示框内容
          alwaysShowContent: true,
          formatter: (params) => {
            let huanImg = "";
            let tongImg = "";
            if (params[0].data.huan > 0) {
              huanImg = `<img class='tooltipHuanUpImg'  src='${this.upImg}' />`;
            } else if (params[0].data.huan < 0) {
              huanImg = `<img  class='tooltipHuanUpImg' src='${this.downImg}' />`;
            }
            if (params[0].data.tong > 0) {
              tongImg = `<img class='tooltipHuanUpImg'  src='${this.upImg}' />`;
            } else if (params[0].data.tong < 0) {
              tongImg = `<img  class='tooltipHuanUpImg' src='${this.downImg}' />`;
            }

            this.tooltipData = params[0].data;
            let html = `
            <div class="ub f-col tooltip">
              <div class="ub f-ac">
                <div class="icon"></div>
                <div class="ub f-col ml10">
                  <div class="tooltipText">
                    ${this.mathRound(params[0].data.value)}
                  </div>
                  <div class="fz12">碳排放量(tCO2e)</div>
                </div>
              </div>
              <div class="ub tooltipList">
                <div class="flex1">环比</div>
                <div  class="fz18 fw">
                   ${huanImg}
                  ${this.mathRound(params[0].data.huan)}%
                </div>
              </div>
              <div class="ub tooltipList">
                <div class="flex1">同比</div>
                <div class="fz18 fw">
                    ${tongImg}
                  ${this.mathRound(params[0].data.tong)}%
                </div>
              </div>
            </div>

            `;
            return html;
          },
        },
        legend: {
          show: false,
          x: "right",
          y: "0",
          icon: "stack",
          itemWidth: 10,
          itemHeight: 10,
          textStyle: {
            color: "#fff",
            fontSize: 16,
          },
        },
        xAxis: [
          {
            type: "category",
            boundaryGap: false,
            axisLabel: {
              color: "rgba(255,255,255,0.6)",
              interval: 0,
              top: 10,
              padding: [0, 0, -10, 0],
              fontSize: 12,
            },
            axisLine: {
              show: true,
              lineStyle: {
                color: "#397cbc",
                fontSize: 16,
              },
            },
            axisTick: {
              show: false,
            },
            splitLine: {
              show: true,
              lineStyle: {
                color: "rgba(255,255,255,0.1)",
              },
            },
            axisPointer: {
              snap: true,
            },
            data: chartData.xData,
          },
        ],
        yAxis: [
          {
            type: "value",
            name: "单位:tCO2e",
            nameTextStyle: {
              padding: [0, -50, 0, 0],
              color: "#fff",
              fontSize: 14,
            },
            min: 0,
            axisLabel: {
              formatter: "{value}",
              textStyle: {
                color: "rgba(255,255,255,0.6)",
                fontSize: 12,
              },
            },
            axisLine: {
              show: false,
              lineStyle: {
                color: "#27b4c2",
              },
            },
            axisTick: {
              show: false,
            },
            splitLine: {
              show: true,
              lineStyle: {
                color: "rgba(255,255,255,0.1)",
                type: "dashed",
              },
            },
            splitArea: {
              show: false,
            },
          },
        ],
        series: [
          {
            name: "已发布",
            type: "line",
            stack: "总量",
            smooth: false,
            symbol: "circle",
            symbolSize: 8,
            itemStyle: {
              normal: {
                color: "rgba(255, 191, 102, 1)",
                lineStyle: {
                  color: "rgba(255, 191, 102, 1)",
                  width: 1,
                },
                areaStyle: {
                  color: new echarts.graphic.LinearGradient(0, 1, 0, 0, [
                    {
                      offset: 0,
                      color: "rgba(255, 191, 102, 0)",
                    },
                    {
                      offset: 0.6,
                      color: "rgba(255, 191, 102, 0.2)",
                    },
                    {
                      offset: 1,
                      color: "rgba(255, 191, 102, 0.5)",
                    },
                  ]),
                },
              },
            },
            data: chartData.list,
          },
        ],
      };
      this.chart.setOption(option);
      let myChart = this.chart;
      // 在此之后设置option
      myChart.dispatchAction({
        type: "showTip",
        seriesIndex: 0,
        dataIndex: 9, //默认选中第二个
      });
    },
  },
};
</script>
<style>
.icon {
  width: 79px;
  height: 79px;
  background: url("~@/assets/images/Cockpit/tooltip.png") no-repeat 100% 100%;
}
.tooltipText {
  font-size: 26px;
  color: #66d9ff;
  line-height: 30px;
  text-shadow: 0px 4px 16px #0080ff;
  width: 110px;
}
.tooltip {
  width: 200px;
  margin-top: 20px;
}
.tooltipList {
  background: linear-gradient(
    180deg,
    rgba(64, 101, 128, 0.05) 0%,
    rgba(57, 172, 255, 0.15) 100%
  );
  color: #fff;
  line-height: 35px;
  margin-top: 10px;
  padding-left: 10px;
  padding-right: 10px;
  height: 35px;
}
.tooltipStyle {
  width: 220px;
  height: 100%;
}
.tooltipStyle .topIcon1 {
  background: url("~@/assets/images/Cockpit/1.png") no-repeat 100% 100%;
  width: 40px;
  height: 40px;
  display: flex;
}
.tooltipStyle .item {
  height: 80px;
  margin-right: 10px;
  text-align: left;
  background-image: url(~@/assets/images/Cockpit/bgl.png),
    url(~@/assets/images/Cockpit/bgr.png);
  background-position: left center, right center;
  background-repeat: no-repeat;
  overflow: hidden;
}
.tooltipStyle .item .right {
  width: calc(100% - 90px);
}
.tooltipHuanUpImg {
  height: 30px;
  position: relative;
  top: 26%;
  left: 4px;
}
</style>
18、等级柱状图对应右边图表基线区间
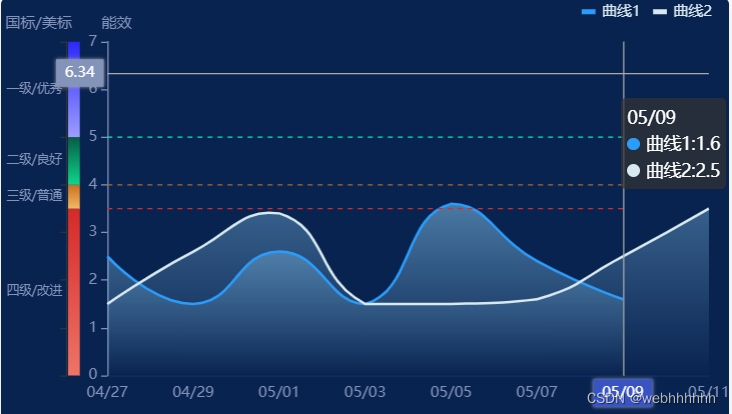
相关配置(复制到查看效果):
var option = {
backgroundColor:"#092350",
tooltip: {
formatter: function (params) {
console.log("param",params)
return '<div>' + params[0].name + '<br>' + params[0].marker + params[0].seriesName + ':' + params[0].value + '<br>' + params[1].marker + params[1].seriesName + ':' + params[1].value + '</div>';
}
},
grid: [{
top: 35,
bottom: 30,
width: '2%',
left: "9%",
containLabel: true
}, {
top: 35,
bottom: 30,
left: '12%',
width: '85%',
containLabel: true
}
],
color: ['#2A9CFC', '#D8E9F1'],
legend: {
show: true,
textStyle: {
fontSize: 12,//字体大小
color: '#D8E9F1'//字体颜色
},
right: 10,
icon: "rect", // 这个字段控制形状 类型包括 circle,rect ,roundRect,triangle,diamond,pin,arrow,none
itemWidth: 11, // 设置宽度
itemHeight: 4, // 设置高度
data: ["曲线1", "曲线2"],
},
axisPointer: {
show: true,
},
xAxis: [{
boundaryGap: false,
gridIndex: 0,
type: 'category',
data: ['美标/国标'],
show: false,
}, {
boundaryGap: false,
gridIndex: 1, axisTick: {
show: false//不显示坐标轴刻度线
},
type: 'category',
axisLabel: {
textStyle: {
color: '#8493BA',
fontSize: 12
}
},
axisLine: {
show: true,
lineStyle: {
color: '#3954C2',
opacity: 0.2
}
},
data: ['04/27', '04/29', '05/01', '05/03', '05/05', '05/07', '05/09', '05/11']
},
],
yAxis: [
{
gridIndex: 0,
type: 'value',
name: '国标/美标',
max: 7,
interval: 1,
nameTextStyle: {
color: "#8493BA",
fontSize: 12,
padding: [0, 0, -7, -45]
},
splitLine: {show: false},
axisLabel: {
show: false,
},
},
{
name: '能效',
gridIndex: 1,
max: 7,
interval: 1,
type: 'value',
nameTextStyle: {
color: "#8493BA",
fontSize: 12,
padding: [0, -15, -7, 0],
},
axisLine: {
lineStyle: {
color: "#8493BA",
}
},
splitLine: {show: false},
axisLabel: {
show: true,
},
}
],
series: [
{
"data": [3.5],
"name": "四级/改进",
"stack": "one",
"type": "bar",
tooltip: {
trigger: 'item',
show: false
},
"color": {
type: 'linear',
x: 0,
y: 1,
x2: 0,
y2: 0,
colorStops: [{
offset: 0, color: 'rgba(239, 116, 103, 1)'
}, {
offset: 1, color: 'rgba(213, 41, 41, 1)'
}],
global: false
},
label: {
show: true,
color: 'rgba(132, 147, 186, 1)',
formatter: "{a}",
position: 'left',
fontSize: 10
}
},
{
"data": [0.5],
"name": "三级/普通",
"stack": "one",
"type": "bar",
tooltip: {
trigger: 'item',
show: false
},
"color": {
type: 'linear',
x: 0,
y: 1,
x2: 0,
y2: 0,
colorStops: [{
offset: 0, color: 'rgba(239, 186, 103, 1)'
}, {
offset: 1, color: 'rgba(206, 109, 31, 1)'
}],
global: false
},
label: {
show: true,
color: 'rgba(132, 147, 186, 1)',
formatter: "{a}",
position: 'left',
fontSize: 10
}
},
{
"data": [1],
"name": "二级/良好",
"stack": "one",
"type": "bar",
tooltip: {
trigger: 'item',
show: false
},
"color": {
type: 'linear',
x: 0,
y: 1,
x2: 0,
y2: 0,
colorStops: [{
offset: 0, color: 'rgba(14, 214, 139, 1)'
}, {
offset: 1, color: 'rgba(7, 91, 71, 1)'
}],
global: false
},
label: {
show: true,
color: 'rgba(132, 147, 186, 1)',
formatter: "{a}",
position: 'left',
fontSize: 10
}
},
{
"data": [2],
"name": "一级/优秀",
"stack": "one",
"type": "bar",
tooltip: {
trigger: 'item',
show: false
},
"color": {
type: 'linear',
x: 0,
y: 1,
x2: 0,
y2: 0,
colorStops: [{
offset: 0, color: 'rgba(157, 157, 255, 1)'
}, {
offset: 1, color: 'rgba(45, 40, 248, 1)'
}],
global: false
},
label: {
show: true,
color: 'rgba(132, 147, 186, 1)',
formatter: "{a}",
position: 'left',
fontSize: 10
}
},
{
name: '曲线1',
xAxisIndex: 1,
yAxisIndex: 1,
symbol: "none",
type: 'line',
lineStyle: {
normal: {
color: 'rgba(42, 156, 252, 1)',
width: 2
}
},
areaStyle: {
color: {
type: 'linear',
x: 0,
y: 0,
x2: 0,
y2: 1,
colorStops: [{
offset: 0, color: 'rgba(142, 209, 251, 0.7)'
}, {
offset: 1, color: 'rgba(142, 209, 251, 0)'
}],
global: false
}
},
smooth: true,
data: ["2.5", "1.5", "2.6", "1.5", "3.6", "2.4", "1.6"]
},
{
name: '曲线2',
xAxisIndex: 1,
yAxisIndex: 1,
symbol: "none",
type: 'line',
itemStyle: {
normal: {
lineStyle: {
color: '#D8E9F1',
width: 2
}
}
},
areaStyle: {
color: {
type: 'linear',
x: 0,
y: 0,
x2: 0,
y2: 1,
colorStops: [{
offset: 0, color: 'rgba(142, 209, 251, 0.5)'
}, {
offset: 1, color: 'rgba(142, 209, 251, 0)'
}],
global: false
}
},
smooth: true,
data: ["1.5", "2.6", "3.4", "1.5", "1.5", "1.6", "2.5", "3.5"]
},
{
name: '三级/普通',
xAxisIndex: 1,
yAxisIndex: 1,
symbol: "none",
type: 'line',
tooltip: {
trigger: 'item',
show: false
},
symbol: "none",
itemStyle: {
normal: {
lineStyle: {
color: 'rgba(214, 44, 44, 1',
type:'dashed',
width: 1// 0.1的线条是非常细的了
}
}
},
data: [3.5, 3.5, 3.5, 3.5, 3.5, 3.5, 3.5]
},
{
name: '二级/良好',
xAxisIndex: 1,
yAxisIndex: 1,
symbol: "none",
type: 'line',
tooltip: {
trigger: 'item',
show: false
},
itemStyle: {
normal: {
lineStyle: {
color: 'rgba(182, 103, 40, 1',
type:'dashed',
width: 1// 0.1的线条是非常细的了
}
}
},
data: [4, 4, 4, 4, 4, 4, 4]
},
{
name: '一级/优秀',
xAxisIndex: 1,
yAxisIndex: 1,
symbol: "none",
type: 'line',
tooltip: {
trigger: 'item',
show: false
},
itemStyle: {
normal: {
lineStyle: {
color: 'rgba(0, 242, 176, 1)',
type:'dashed',
width: 1// 0.1的线条是非常细的了
}
}
},
data: [5, 5, 5, 5, 5, 5, 5]
},
]
};


 5476
5476


 被折叠的 条评论
为什么被折叠?
被折叠的 条评论
为什么被折叠?
 到【灌水乐园】发言


