


2014-12-11 09:30左右收到短信告警信息,如下:
orclrac1[172.19.0.87] resoure offline NAME=ora.ons
TYPE=ora.ons.type
TARGET=ONLINE , ONLINE
STATE=OFFLINE, ONLINE on orclrac2
从告警信息可以看出ons资源offline了 (问题出现多次)
影响:
从业务人员反馈来看当时出现大量的异常订单,订单处理失败
当时紧急处理是:
先把启动停止的ons服务,发现启动失败,启动不了,就把整改集群资源重启
如下:
crsctl stop has;
crsctl start has;
重启后ons资源恢复正常
进一步分析原因:
cd /oracle/grid/11ggrid/app/11.2.0/grid/log/orclrac1
1.查看集权clusterware日志alertorclrac1.log
发现如下错误,意思无法启动新的进程,从下面的日志还不出什么原因
[ctssd(9679)]CRS-2408:The clock on host orclrac1 has been updated by the Cluster Time Synchronization Service to be synchronous with the mean cluster time.
2014-12-11 09:21:38.403:
[/oracle/grid/11ggrid/app/11.2.0/grid/bin/oraagent.bin(9946)]CRS-5016:Process "/oracle/grid/11ggrid/app/11.2.0/grid/opmn/bin/onsctli" spawned by agent "/oracle/grid/11ggrid/app/11.2.0/grid/bin/oraagent.bin" for action "check" failed: details at "(:CLSN00010:)" in "/oracle/grid/11ggrid/app/11.2.0/grid/log/orclrac1/agent/crsd/oraagent_grid/oraagent_grid.log"
2014-12-11 09:23:06.674:
[/oracle/grid/11ggrid/app/11.2.0/grid/bin/oraagent.bin(9946)]CRS-5013:Agent "/oracle/grid/11ggrid/app/11.2.0/grid/bin/oraagent.bin" failed to start process "/oracle/grid/11ggrid/app/11.2.0/grid/bin/lsnrctl" for action "check": details at "(:CLSN00008:)" in "/oracle/grid/11ggrid/app/11.2.0/grid/log/orclrac1/agent/crsd/oraagent_grid/oraagent_grid.log"
2014-12-11 09:23:20.058:
[/oracle/grid/11ggrid/app/11.2.0/grid/bin/oraagent.bin(9946)]CRS-5016:Process "/oracle/grid/11ggrid/app/11.2.0/grid/opmn/bin/onsctli" spawned by agent "/oracle/grid/11ggrid/app/11.2.0/grid/bin/oraagent.bin" for action "check" failed: details at "(:CLSN00010:)" in "/oracle/grid/11ggrid/app/11.2.0/grid/log/orclrac1/agent/crsd/oraagent_grid/oraagent_grid.log"
2014-12-11 09:23:51.216:
[/oracle/grid/11ggrid/app/11.2.0/grid/bin/oraagent.bin(9946)]CRS-5016:Process "/oracle/grid/11ggrid/app/11.2.0/grid/opmn/bin/onsctli" spawned by agent "/oracle/grid/11ggrid/app/11.2.0/grid/bin/oraagent.bin" for action "start" failed: details at "(:CLSN00010:)" in "/oracle/grid/11ggrid/app/11.2.0/grid/log/orclrac1/agent/crsd/oraagent_grid/oraagent_grid.log"
2014-12-11 09:33:50.969:
2.查看"/oracle/grid/11ggrid/app/11.2.0/grid/log/orclrac1/agent/crsd/oraagent_grid/oraagent_grid.log"
日志如下发现调用操作系统函数execCmd scls_process_spawn() failed 1 spawn进程失败,也就意味节点无法创建新的连接,不能进行登录了可以从这里看出
[check] (:CLSN00008:) category: -2, operation: fork, loc: spawnproc28, OS error: 11, other: forked failed [-1]
2014-12-11 09:22:54.932: [ora.ons][944477952]{0:1:71} [check] getOracleHomeAttrib: oracle_home = /oracle/grid/11ggrid/app/11.2.0/grid
2014-12-11 09:22:54.933: [ora.ons][944477952]{0:1:71} [check] Utils:execCmd action = 3 flags = 6 ohome = /oracle/grid/11ggrid/app/11.2.0/grid/opmn/ cmdname = onsctli.
2014-12-11 09:23:06.524: [ora.asm][949495552]{1:37481:2} [check] CrsCmd::ClscrsCmdData::stat entity 1 statflag 33 useFilter 0
2014-12-11 09:23:06.544: [ora.asm][949495552]{1:37481:2} [check] AsmProxyAgent::check clsagfw_res_status 0
2014-12-11 09:23:06.666: [ora.LISTENER.lsnr][961095424]{1:37481:2} [check] Utils:execCmd action = 3 flags = 38 ohome = (null) cmdname = lsnrctl.
2014-12-11 09:23:06.666: [ora.LISTENER.lsnr][961095424]{1:37481:2} [check] (:CLSN00008:)Utils:execCmd scls_process_spawn() failed 1
2014-12-11 09:23:06.666: [ora.LISTENER.lsnr][961095424]{1:37481:2} [check] (:CLSN00008:) category: -2, operation: fork, loc: spawnproc28, OS error: 11, other: forked failed [-1]
2014-12-11 09:23:06.674: [ora.LISTENER.lsnr][961095424]{1:37481:2} [check] clsnUtils::error Exception type=2 string=
CRS-5013: Agent "/oracle/grid/11ggrid/app/11.2.0/grid/bin/oraagent.bin" failed to start process "/oracle/grid/11ggrid/app/11.2.0/grid/bin/lsnrctl" for action "check": details at "(:CLSN00008:)" in "/oracle/grid/11ggrid/app/11.2.0/grid/log/orclrac1/agent/crsd/oraagent_grid/oraagent_grid.log"
2014-12-11 09:23:06.681: [ora.LISTENER.lsnr][961095424]{1:37481:2} [check] clsn_agent::check: Exception SclsProcessSpawnException
2014-12-11 09:23:06.681: [ AGFW][952690432]{1:37481:2} ora.LISTENER.lsnr orclrac1 1 state changed from: ONLINE to: UNKNOWN
2014-12-11 09:23:06.681: [ AGFW][952690432]{1:37481:2} ora.LISTENER.lsnr orclrac1 1 would be continued to monitored!
2014-12-11 09:23:06.681: [ AGFW][952690432]{0:1:73} Generating new Tint for unplanned state change. Original Tint: {1:37481:2}
2014-12-11 09:23:06.681: [ AGFW][952690432]{0:1:73} Agent sending message to PE: RESOURCE_STATUS[Proxy] ID 20481:1780005
2014-12-11 09:23:20.057: [ora.ons][944477952]{0:1:71} [check] (:CLSN00010:)ons is not running ...
2014-12-11 09:23:20.057: [ora.ons][944477952]{0:1:71} [check] (:CLSN00010:)
2014-12-11 09:23:20.058: [ora.ons][944477952]{0:1:71} [check] (:CLSN00010:)Utils:execCmd scls_process_join() uret 2
2014-12-11 09:23:20.058: [ora.ons][944477952]{0:1:71} [check] execCmd ret = 2
2014-12-11 09:23:20.058: [ora.ons][944477952]{0:1:71} [check] (:CLSN00010:)ons is not running ...
从以上2点怀疑是因为操作进程数设置不足导致的
3.继续分析ons.out日志
cd /oracle/grid/11ggrid/app/11.2.0/grid/opmn/logs
[grid@orclrac1 logs]$ ls
ons.log.orclrac1 ons.out
发现创建线程的函数pthread_create()创建失败 Resource temporarily unavailable资源无法获取
[2014-12-11T09:21:54+08:00] [ons] [TRACE:2] [] [internal] ONS worker process stopped (2)
pthread_create() Resource temporarily unavailable
pthread_create() Resource temporarily unavailable
[2014-12-11T09:23:35+08:00] [ons] [ERROR:1] [] [internal] ONS: fork failed -- Resource temporarily unavailable
pthread_create() Resource temporarily unavailable
[2014-12-11T09:24:06+08:00] [ons] [TRACE:2] [] [internal] ONS worker process stopped (2)
pthread_create() Resource temporarily unavailable
pthread_create() Resource temporarily unavailable
pthread_create() Resource temporarily unavailable
pthread_create() Resource temporarily unavailable
pthread_create() Resource temporarily unavailable
[2014-12-11T10:31:38+08:00] [ons] [TRACE:2] [] [internal] ONS worker process stopped (2)
pthread_create() Resource temporarily unavailable
pthread_create() Resource temporarily unavailable
从以上分析可以看出是系统进程设置限制导致的问题
4.查看 cat /etc/security/limits.conf
oracle soft nproc 16384
oracle hard nproc 16384
oracle soft nofile 16384
oracle hard nofile 65536
grid soft nofile 16384
grid hard nofile 65536
grid soft nproc 16384
grid hard nproc 16384
grid soft stack 10240
grid hard stack 32768
设置的应该够用的,但是为什么会失败呢???
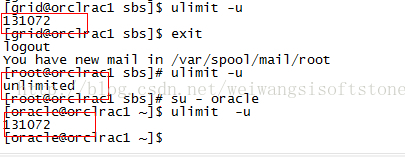
5.使用ulimit -u命令查看当前设置情况,惊奇的发现limits.conf没有生效,最大进程数为1024
grid的用户的:
[grid@orclrac1 orclrac1]$ ulimit -u
1024
oracle用户的:
[oracle@orclrac1 ~]$ ulimit -u
1024
root用户的:
[root@orclrac1 ~]# ulimit -u
1024
6.通过查找资料发现在cent os 6以后的版本中有一个/etc/security/limits.d/90-nproc.conf
内容如下
root@orclrac1 ~]# cat /etc/security/limits.d/90-nproc.conf
# Default limit for number of user's processes to prevent
# accidental fork bombs.
# See rhbz #432903 for reasoning.
* soft nproc 1024
普通用户用了/etc/security/limits.d/90-nproc.conf 软限制的配置, 而root用户用了/etc/security/limits.conf硬限制的配置,/etc/security/limits.d/90-nproc.conf优先级高于limits.conf
修改该/etc/security/limits.d/90-nproc.conf 中的* soft nproc 1024 为* soft nproc 131072
并设置root用户的最大进程数为unlimited
如下:
root soft nproc unlimited
root hard nproc unlimited
oracle soft nproc 139264
oracle hard nproc 139264
oracle soft nofile 16384
oracle hard nofile 65536
grid soft nofile 16384
grid hard nofile 65536
grid soft nproc 16384
grid hard nproc 16384
grid soft stack 10240
grid hard stack 32768
查看设置生效:
[grid@orclrac1 logs]$ ulimit -u
139264
[root@orclrac1 ~]# ulimit -u
unlimited
[oracle@orclrac1 ~]$ ulimit -u
139264
至此问题到一段落,目前ons运行正常,需要观察一段时间,继续监控
过了一段时间后问题重复出现了
由于之前分析资源offline的原因操作系统最大进程设置较小导致,修改后问题又重复出现,所以问题要从新分析定位
问题连续重复出现加班重新分析这个问题
今天主要的分析思路
收集rac环境所有异常日志和osw监控日志
监控用户的进程数和会话数
从新分析所有日志信息
分析过程:
1. 登录到环境收集日志
把rac相关的所有日志,以及ows监控日志取到本地(防止日志被覆盖掉)
2.监控用户的进程数和会话数
上次分析的结果是由于无法创建进程导致的失败,用户无法连接数据库,所以想了解出问题时数据库的会话数和进程,在rac部署如下脚本
-- Create table
create table MONSESSION
(
MTIME DATE,
INDST_ID NUMBER,
COUN NUMBER,
NAME VARCHAR2(20)
)
create or replace procedure wproc_session
as
begin
insert into monsession
(select sysdate, inst_id, count(*), 'session'
from gV$session
group by inst_id);
insert into monsession
(select sysdate, inst_id, count(*), 'process'
from gv$process
group by inst_id);
commit;
exception
when others then
wprc_exp_log('wproc_session', '出错');
commit;
end wproc_session;
--job每2分钟运行一次
begin
sys.dbms_job.submit(job => :job,
what => 'wproc_session();',
next_date => to_date('14-12-2014 10:01:02', 'dd-mm-yyyy hh24:mi:ss'),
interval => 'sysdate+2/1440');
commit;
end;
/
3. 对日志进行重新分析
由于之前分析结果,修改后问题又重复出现,可以推断问题原因不是由于操作系统最大进程数设置过小导致,所以需要换一种思路去重新分析。
经过重新分析日志,可以得出结论问题出现的原因就是操作系统资源无法获取导致的
Resource temporarily unavailable,到底是什么资源无法获取导致的??
猜测可能是
内存资源不足
磁盘空间不足
swap空间不足
进程数设置较小(已经排除)
通过分析出问题时间点的osw监控日志
排查内存不足,磁盘空间不足,swap空间不足的原因
zzz ***Sun Dec 14 05:02:18 CST 2014
top - 05:02:20 up 120 days, 18:47, 7 users, load average: 0.35, 0.33, 0.36
Tasks: 1740 total, 1 running, 1739 sleeping, 0 stopped, 0 zombie
Cpu(s): 0.9%us, 0.4%sy, 0.0%ni, 98.7%id, 0.0%wa, 0.0%hi, 0.0%si, 0.0%st
Mem: 32853644k total, 31692916k used, 1160728k free, 233892k buffers
Swap: 33554424k total, 675160k used, 32879264k free, 15600456k cached
综合所有日志分析得出的结论还是进程数问题导致
通过分析日志得出的结论和上次结论是一样的,所以有感觉到很郁闷,从一开始就想会不会是oracle自身的bug导致的
于是开始沿着oracle 自身bug进行分析
首先最大进程数设置在系统中是生效的如下
那问题在oracle是不是生效的,怎么去查看呢?
通过在网上查询资料,最后在mos上看到一篇文章
The processes and resources started by CRS (Grid Infrastructure) do not inherit the ulimit setting for "max user processes" from /etc/security/limits.conf setting (文档 ID 1594606.1)
通过标题一看,对这篇文件欣喜若狂
文挡介绍问题症状是
SYMPTOMS
Database alert.log shows the following:
WARNING: Oracle instance running on a system with low open file
descriptor limit. Tune your system to increase this limit
to avoid severe performance degradation. Current limit = <nnnn>
OR
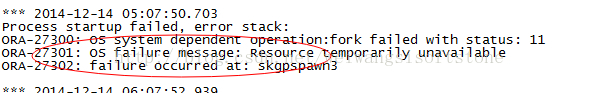
ORA-27300: OS system dependent operation:fork failed with status: 11
ORA-27301: OS failure message: Resource temporarily unavailable
ORA-27302: failure occurred at: skgpspawn3
一看和我们症状一样,如下:
文章介绍,问题原因(有由于oracle的bug导致)
CAUSE
Due to bug 17301761 THE MAXIMUM PROCESS VALUE OF OHASD,BIN IS TOO SMALL IF THE CRS STARTS MANUALLY
Duplicates: bug 16875455 bug 17007666 bug 17232135
影响版本:
Oracle Database - Enterprise Edition - Version 11.2.0.1 and later
Information in this document applies to any platform.
我们数据库的版本是11.2.0.4的说明我们版本也在影响范围之内
下面就是解决方案了
1. 打补丁
2. 规避
查看当前oracle 进程限制情况
数据库服务器上
[root@rac1 ~]# ps -ef |grep pmon
grid 46506 1 0 Dec12 ? 00:00:44 asm_pmon_+ASM1
oracle 47051 1 0 Dec12 ? 00:02:05 ora_pmon_orcl1
root 115832 91913 0 11:40 pts/12 00:00:00 grep pmon
查看pmon进程栈信息
[root@rac1 ~]# cd /proc
[root@rac1 proc]# cd 46506
[root@rac1 46506]# cat limits
Limit Soft Limit Hard Limit Units
Max cpu time unlimited unlimited seconds
Max file size unlimited unlimited bytes
Max data size unlimited unlimited bytes
Max stack size 33554432 unlimited bytes
Max core file size unlimited unlimited bytes
Max resident set unlimited unlimited bytes
Max processes 1024 256514 processes
Max open files 65536 65536 files
Max locked memory unlimited unlimited bytes
Max address space unlimited unlimited bytes
Max file locks unlimited unlimited locks
Max pending signals 256514 256514 signals
Max msgqueue size 819200 819200 bytes
Max nice priority 0 0
Max realtime priority 0 0
Max realtime timeout unlimited unlimited us
[root@rac1 46506]# cd ../47051
[root@rac1 47051]# cat limits
Limit Soft Limit Hard Limit Units
Max cpu time unlimited unlimited seconds
Max file size unlimited unlimited bytes
Max data size unlimited unlimited bytes
Max stack size 33554432 unlimited bytes
Max core file size unlimited unlimited bytes
Max resident set unlimited unlimited bytes
Max processes 1024 256514 processes
Max open files 65536 65536 files
Max locked memory unlimited unlimited bytes
Max address space unlimited unlimited bytes
Max file locks unlimited unlimited locks
Max pending signals 256514 256514 signals
Max msgqueue size 819200 819200 bytes
Max nice priority 0 0
Max realtime priority 0 0
Max realtime timeout unlimited unlimited us
[root@rac1 47051]#
从上面红色标注的可以看出oracle ,asm的pmon进程栈信息的max processes为1024
这就是问题一直出现的原因,设置操作系统最大进程数在oracle中根本就没有生效
Mos给出的解决方法如下:
通过修改两个相关的脚本来显示的设置最大进程数
The ohasd script needs to be modified to setthe ulimit explicitly for all grid and database resources that are started bythe Grid Infrastructure (GI).
1) go to GI_HOME/bin
2) make a backup of ohasd script file
3) in the ohasd script file, locate thefollowing code:
Linux)
# MEMLOCK limit is for Bug 9136459
ulimit -l unlimited
if [ "$?" != "0"]
then
$CLSECHO -phas -f crs -l -m 6021 "l" "unlimited"
fi
ulimit -c unlimited
if [ "$?" != "0"]
then
$CLSECHO -phas -f crs -l -m 6021 "c" "unlimited"
fi
ulimit -n 65536
In the above code, insert the following linejust before the line with "ulimit -n 65536"
ulimit -u 16384
4) Recycle CRS manually so that the ohasdwill not use new ulimit setting for open files.
After the database is started, please issue "ps -ef | grep pmon" andget the pid of it.
Then, issue "cat /proc/<pid of the pmon proces>/limits | grepprocess" and find out if the Max process is set to 16384.
Setting the number of processes to 16384 should be enough for most serverssince having 16384 processes normally mean the server to loaded veryheavily. using smaller number like 4096 or 8192 should also suffice formost users.
In addition to above, the ohasd template needs to be modified to insure thatnew ulimit setting persists even after a patch is applied.
1) go to GI_HOME/crs/sbs
2) make a backup of crswrap.sh.sbs
3) in crswrap.sh.sbs, insert the followingline just before the line "# MEMLOCK limit is for Bug 9136459"
ulimit -u 16384
Finally, although the above setting is successfully used to increase the numberof processes setting, please test this on the test server first before settingthe ulimit on the production.
按照mos给的解决方案,修改后重启crs栈,问题得到解决,以后再也没有出现问题


 4892
4892


 被折叠的 条评论
为什么被折叠?
被折叠的 条评论
为什么被折叠?
 到【灌水乐园】发言


