Today in this article, we will see about how to create a Coronavirus dashboard using React with Gatsby and Leaflet.
今天,在本文中,我们将介绍如何使用带有Gatsby和Leaflet的React创建冠状病毒仪表板。
Before get into the topic, let’s see what are the steps we are going to follow:
在进入本主题之前,让我们看看我们将要遵循的步骤:
- Getting started with Leaflet. Leaflet入门。
- Fetching API data. 正在获取API数据。
- Transform the data into geographic data format. 将数据转换为地理数据格式。
- Adding the data to the map. 将数据添加到地图。
Let’s get into the topic.
让我们进入这个话题。
Leaflet入门 (Getting Started with Leaflet)
We are going to create application that uses an API containing Coronavirus statistics that the country is facing in real-time.
我们将创建使用包含该国实时面临的冠状病毒统计信息的API的应用程序。
This map will show a marker for each country with the number of confirmed cases. And then we will include a little popup tooltip that shows the detail information.We are using the OpenStreetMap public tileserver. To get started follow the commands:
该地图将显示每个国家的标记,以及已确认病例的数量。 然后,我们将包含一个显示详细信息的弹出工具提示。我们正在使用OpenStreetMap公共tileserver。 要开始使用,请遵循以下命令:
- node or yarn 结或纱
Gatsby’s CLI - yarn global add gatsby-cli
盖茨比(Gatsby)的CLI- yarn global add gatsby-cli
First we have to setup a foundation for our map. We can do this by using Leaflet Gatsby starter with React.
首先,我们必须为地图设置基础。 我们可以通过在React中使用Leaflet Gatsby入门来做到这一点。
gatsby new my-coronavirus-map https://github.com/colbyfayock/gatsby-starter-leaflet
And then navigate to your new project and start the development server.
然后导航到您的新项目并启动开发服务器。
cd my-coronavirus-map
yarn develop
Now you will see the basic mapping app in your browser.
现在,您将在浏览器中看到基本的地图绘制应用程序。
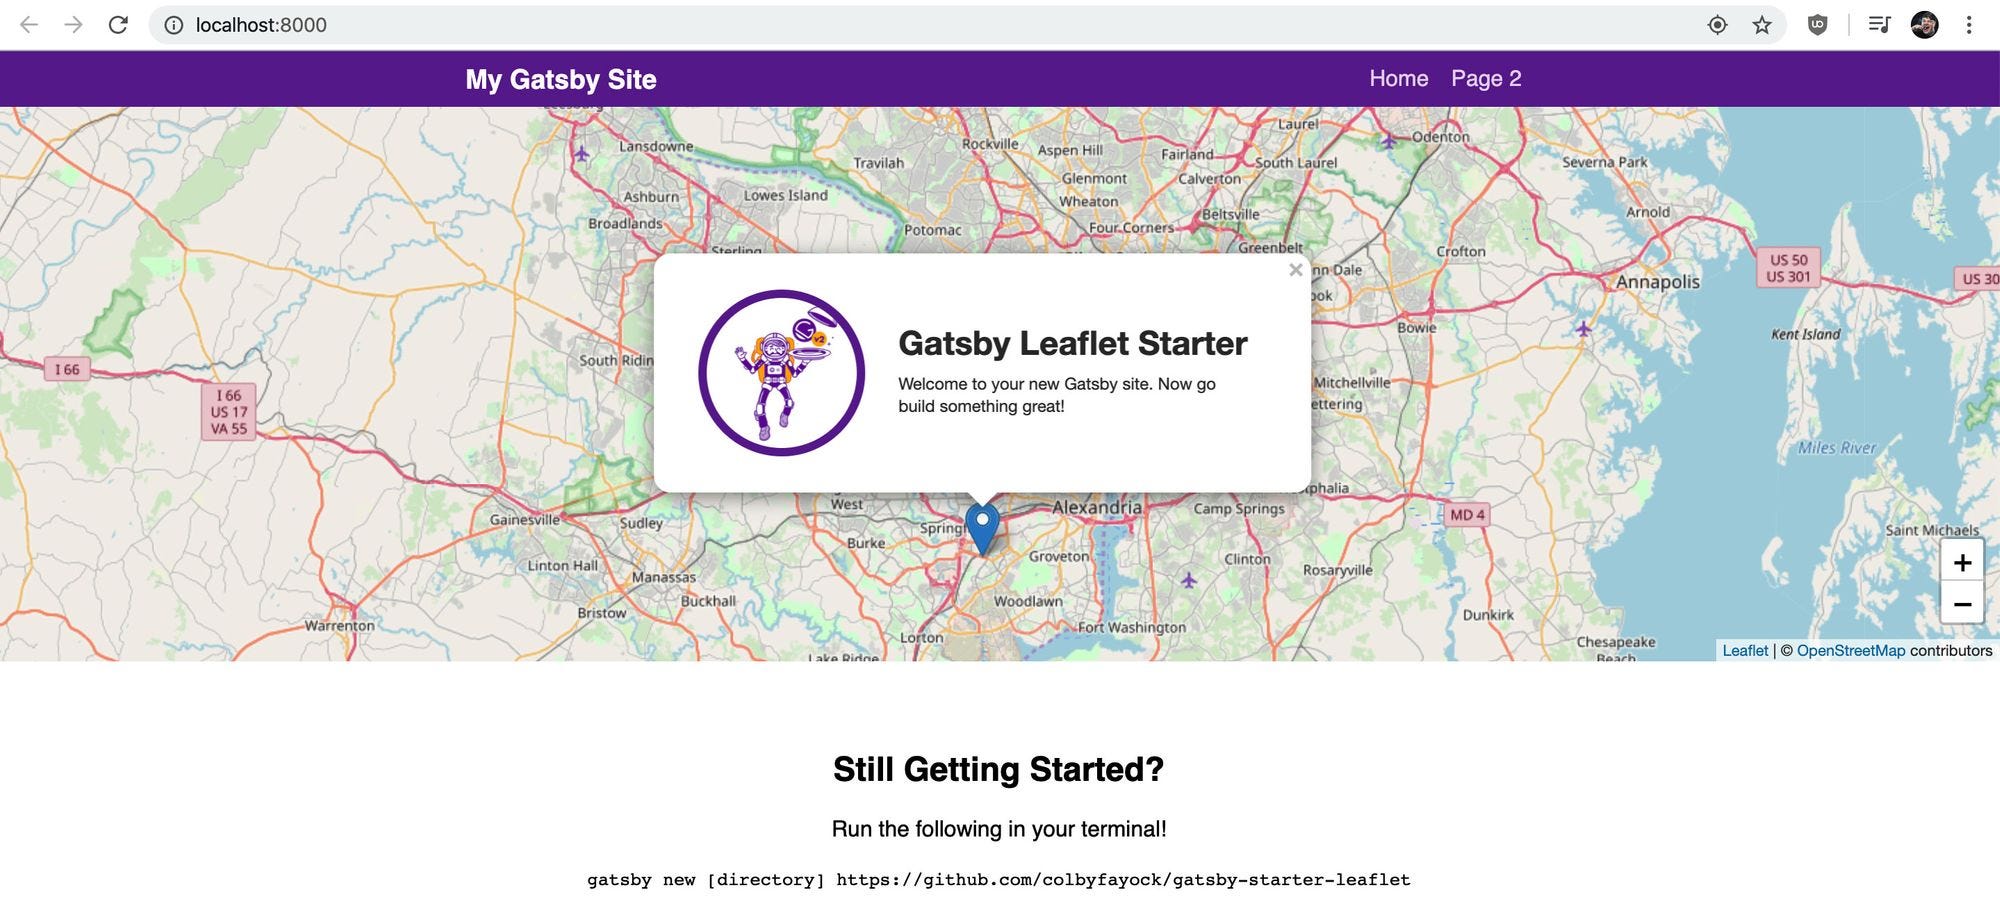
Generally the map comes with the spinner and we want to clean up some code for our better convenience.The file src/pages/index.js is the homepage of our app. Remove everything in the mapEffect function.
通常情况下,地图带有微调框,为了方便起见,我们希望清理一些代码。文件src / pages / index.js是我们应用程序的主页。 删除mapEffect函数中的所有内容。
async function mapEffect({ leafletElement } = {}) {
}
Then change the variable name of our LeafletElement with our convenience for better understanding.
然后,通过方便的方式更改LeafletElement的变量名称,以更好地理解。
async function mapEffect({ leafletElement: map } = {}) {
}
And then we don’t want a marker now, so remove the Marker component from the Map component.
然后我们现在不需要标记,因此从Map组件中删除Marker组件。
<Map {...mapSettings} />We have to remove all the following imports and variables in our file:
我们必须删除文件中的以下所有导入和变量:
- useRef useRef
- Marker 记号笔
- promiseToFlyTo promiseToFlyTo
- getCurrentLocation getCurrentLocation
- gatsby_astronaut gatsby_astronaut
- timeToZoom timeToZoom
- timeToOpenPopupAfterZoom timeToOpenPopupAfterZoom
- timeToUpdatePopupAfterZoom timeToUpdatePopupAfterZoom
- ZOOM 放大
- popupContentHello popupContentHello
- popupContentGatsby popupContentGatsby
- markerRef markerRef
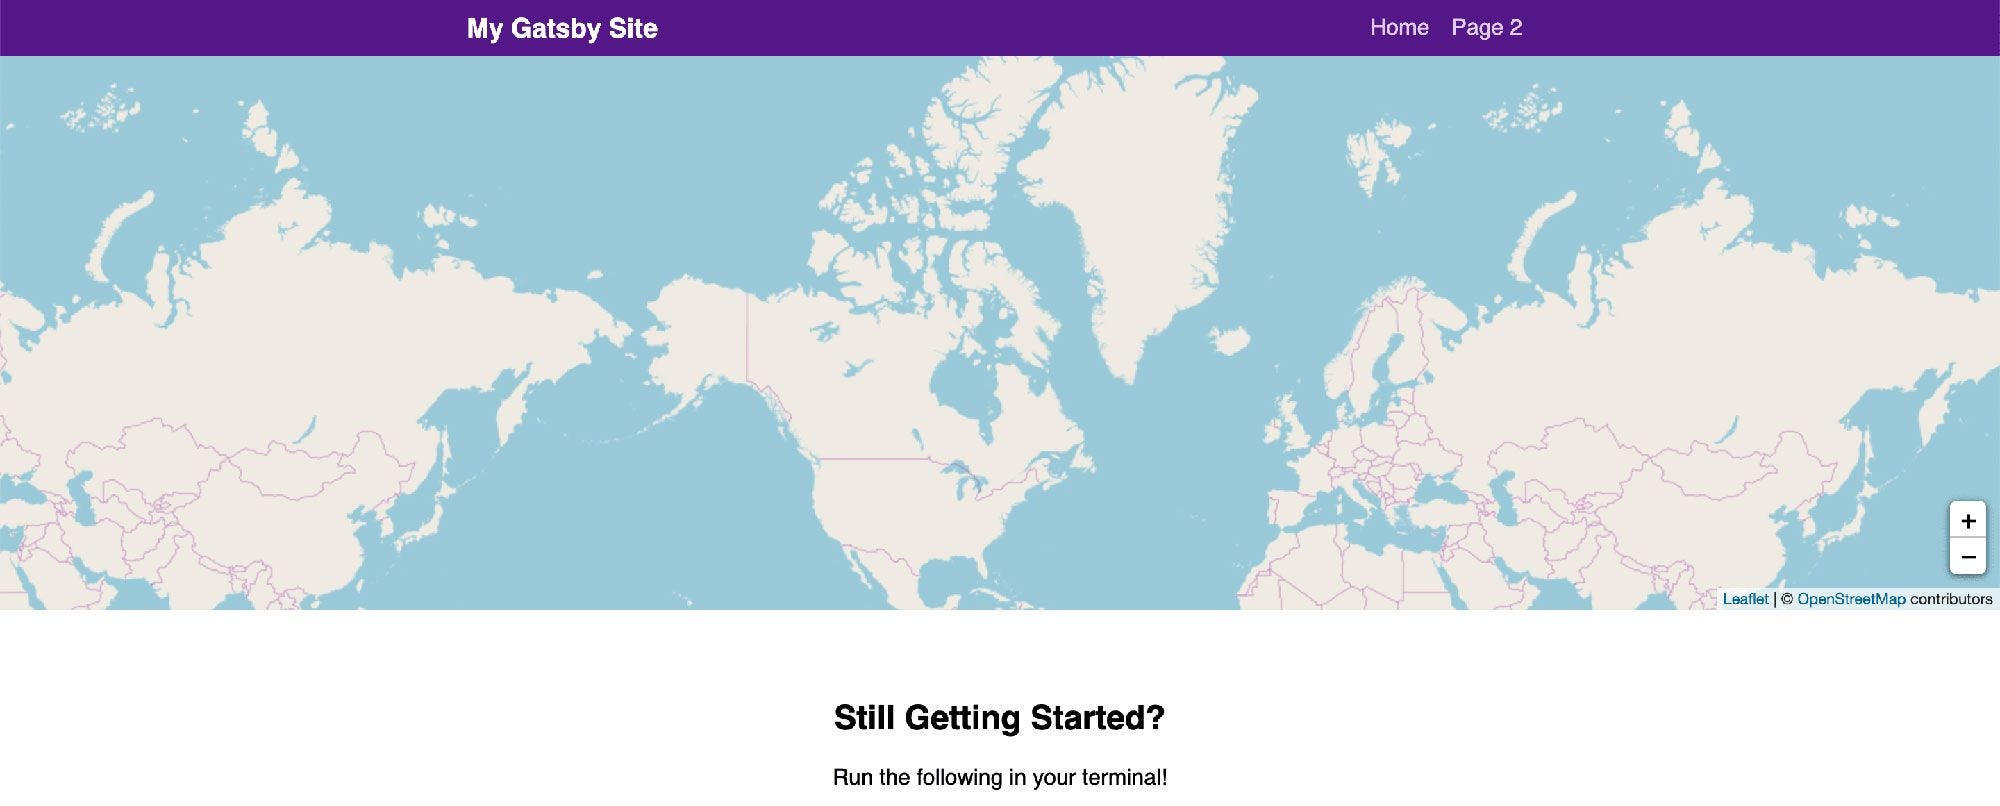
Let’s see now how our map looks like.
现在让我们看看地图的外观。
提取API数据 (Fetching API Data)
In our app we are going to use the NOVELCOVID API. Especially we are going to use the countries endpoint to fetch the list of all countries statistics associated with them.
在我们的应用程序中,我们将使用NOVELCOVID API 。 特别是,我们将使用国家端点来获取与它们相关的所有国家统计信息的列表。
For making requests we are going to use axios. It is a nice API to use always. If you want to use fetch or your own request library, implement this in your code.
为了发出请求,我们将使用axios。 始终使用它是一个不错的API。 如果要使用提取或自己的请求库,请在代码中实现。
Run the code to start installing axios:
运行代码以开始安装axios:
yarn add axiosOnce installed, again restart your server.
安装完成后,再次重新启动服务器。
Import the axios package to the pages/index.js file:
将axios包导入到pages / index.js文件中:
import axios from 'axios';Now inside our mapEffect function, make a request to the API endpoint.
现在在我们的mapEffect函数中,向API端点发出请求。
async function mapEffect({ leafletElement: map } = {}) {
    let response;
    try {
      response = await axios.get('https://corona.lmao.ninja/v2/countries');
    } catch(e) {
      console.log(`Failed to fetch countries: ${e.message}`, e);
      return;
    }
    const { data = [] } = response;
}
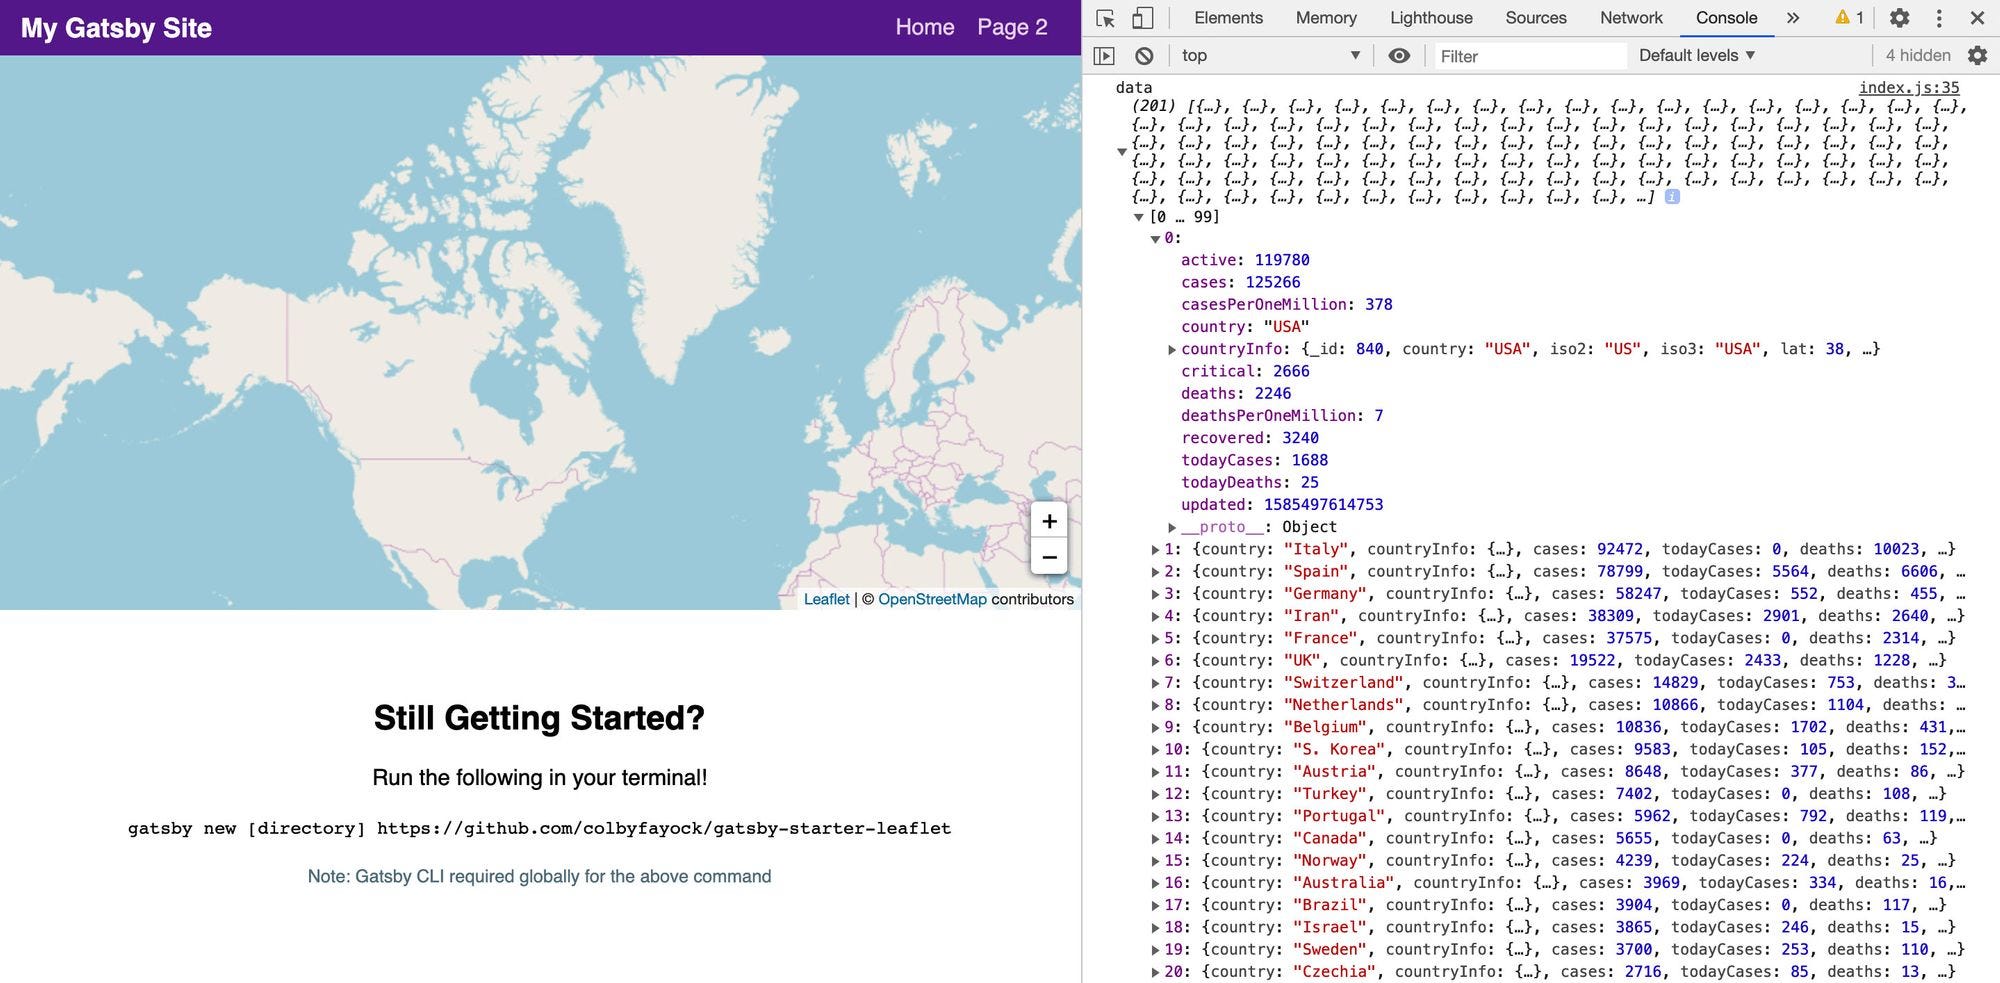
Now navigate to console log to see the data object and we have seen our data successfully fetched!
现在,导航到控制台日志以查看数据对象,并且我们已经成功获取了数据!
将数据转换为地理数据格式 (Transform the data into geographic data format)
Now we have the data, we have to convert it into a geographic data format, especially GeoJSON format.
现在我们有了数据,我们必须将其转换为地理数据格式,尤其是GeoJSON格式。
Let’s start by adding this code into our project:
首先,将以下代码添加到我们的项目中:
const { data = [] } = response;
const hasData = Array.isArray(data) && data.length > 0;
if ( !hasData ) return;
const geoJson = {
  type: 'FeatureCollection',
  features: data.map((country = {}) => {
    const { countryInfo = {} } = country;
    const { lat, long: lng } = countryInfo;
    return {
      type: 'Feature',
      properties: {
       ...country,
      },
      geometry: {
        type: 'Point',
        coordinates: [ lng, lat ]
      }
    }
  })
}
We have created a new constant called hasData that is used to checks that our data variable is an array and has data.
我们创建了一个名为hasData的新常量,该常量用于检查我们的数据变量是否为数组并具有数据。
- If we don’t have data, we want to return it into the function, because we don’t want to try to add data that we don’t have. 如果没有数据,我们想将其返回到函数中,因为我们不想尝试添加我们没有的数据。
- We have created a geoJson object that is our GeoJSON document. 我们创建了一个geoJson对象,它是我们的GeoJSON文档。
Our document we are using is type FeatureCollection and thus features will loop through our dataset.
我们正在使用的文档类型为FeatureCollection ,因此要素将遍历我们的数据集。
For each country, we obtain the data in the form of the lat and lng to create a point for our map.
对于每个国家/地区,我们以lat和lng的形式获取数据,以为地图创建一个点。
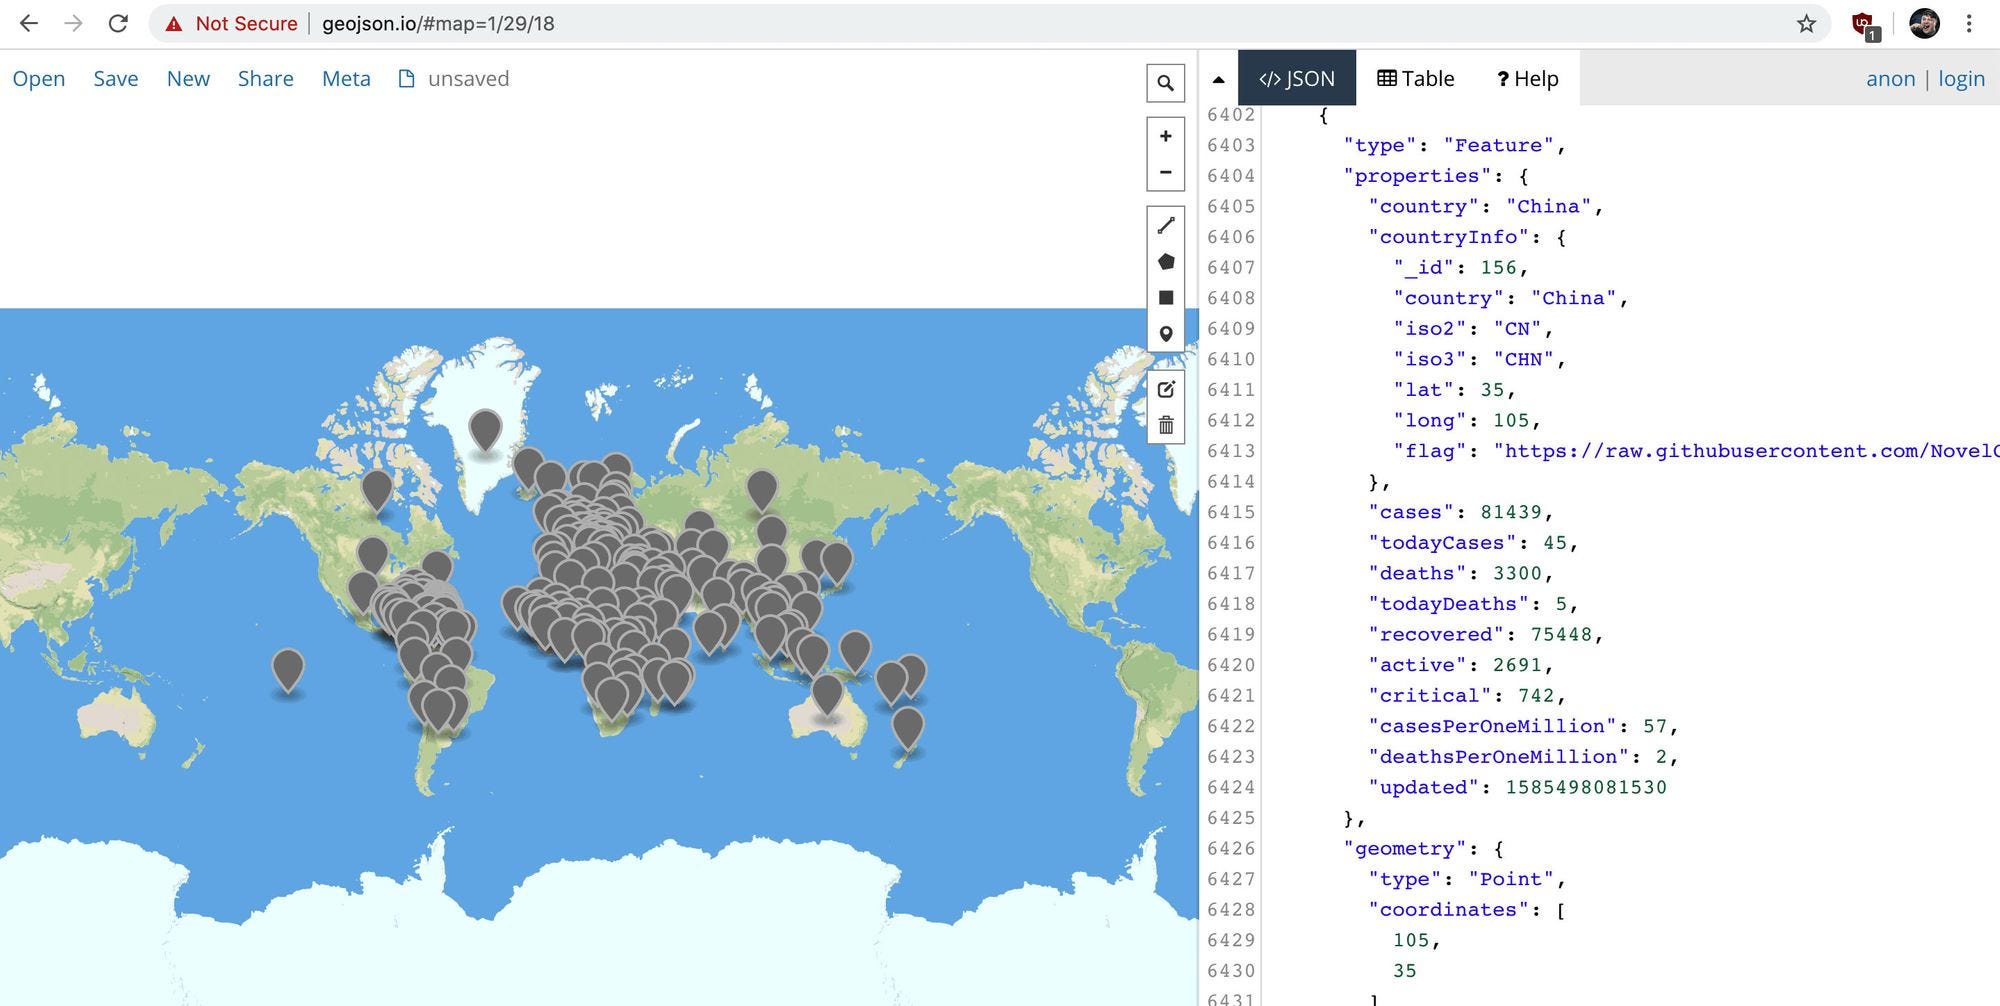
Now add the GeoJSON document in our project. Let’s see how it looks like in the console.log of geojson.io.
现在,在我们的项目中添加GeoJSON文档。 让我们在geojson.io的console.log中看到它的样子。
将数据添加到地图 (Adding the data to the map)
Now we have the GeoJSON document add it to the map.
现在我们有了GeoJSON文档,将其添加到地图中。
const geoJsonLayers = new L.GeoJSON(geoJson, {
  pointToLayer: (feature = {}, latlng) => {
    const { properties = {} } = feature;
    let updatedFormatted;
    let casesString;
    const {
      country,
      updated,
      cases,
      deaths,
      recovered
    } = properties
    casesString = `${cases}`;
    if ( cases > 1000 ) {
      casesString = `${casesString.slice(0, -3)}k+`
    }
    if ( updated ) {
      updatedFormatted = new Date(updated).toLocaleString();
    }
    const html = `
      <span class="icon-marker">
        <span class="icon-marker-tooltip">
          <h2>${country}</h2>
          <ul>
            <li><strong>Confirmed:</strong> ${cases}</li>
            <li><strong>Deaths:</strong> ${deaths}</li>
            <li><strong>Recovered:</strong> ${recovered}</li>
            <li><strong>Last Update:</strong> ${updatedFormatted}</li>
          </ul>
        </span>
        ${ casesString }
      </span>
    `;
    return L.marker( latlng, {
      icon: L.divIcon({
        className: 'icon',
        html
      }),
      riseOnHover: true
    });
  }
});
We have created a new instance of L.GeoJSON that converts the GeoJSON document into Leaflet.
我们创建了一个新的L.GeoJSON实例,该实例将GeoJSON文档转换为Leaflet。
The custom pointToLayer we have defined inside the instance will allows us to customize the map layer Leaflet creates in our map.
我们在实例内部定义的自定义pointToLayer将使我们能够自定义Leaflet在我们的地图中创建的地图图层。
The L.marker will return with our custom configuration that contains a class of icon for the container and custom HTML.
L.marker将以我们的自定义配置返回,其中包含用于容器的图标类和自定义HTML。
We have to add a CSS code here to our assets/stylesheets/components/_map.scss file to make it more interactive:
我们必须在此处向我们的asset / stylesheets / components / _map.scss文件添加CSS代码,以使其更具交互性:
.icon-marker {
  display: flex;
  position: relative;
  justify-content: center;
  align-items: center;
  color: white;
  width: 3.6em;
  height: 3.6em;
  font-size: .7em;
  font-weight: bold;
  background-color: $red-800;
  border-radius: 100%;
  box-shadow: 0 2px 5px rgba(black, .9);
  &:hover {
    .icon-marker-tooltip {
      display: block;
    }
  }
}
.icon-marker-tooltip {
  display: none;
  position: absolute;
  bottom: 100%;
  width: 16em;
  font-size: 1.4em;
  padding: 1em;
  background-color: $blue-grey-900;
  border-radius: .4em;
  margin-bottom: 1em;
  box-shadow: 0 3px 5px rgba(black, .9);
  &:before {
    display: block;
    position: absolute;
    bottom: -.6em;
    left: 50%;
    content: '';
    width: 1.4em;
    height: 1.4em;
    background-color: $blue-grey-900;
    transform: rotate(45deg);
    margin-left: -.7em;
  }
  h2 {
    font-size: 1.5em;
    line-height: 1.2;
    margin-bottom: .1em;
    margin-top: 0;
  }
  h3 {
    font-size: 1.2em;
    margin: .1em 0;
    font-weight: normal;
    color: $blue-grey-100;
  }
  ul,
  p {
    font-weight: normal;
  }
  ul {
    list-style: none;
    padding: 0;
    margin: .6em 0 0;
  }
}
Now we have created our geoJson layer, add it into our app.
现在,我们已经创建了geoJson图层,并将其添加到我们的应用程序中。
geoJsonLayers.addTo(map)It’s not adjust automatically to centre. Always make sure to add the following code inside index.js to make it fit into the centre.
它不会自动调整为居中。 始终确保在index.js中添加以下代码以使其适合中心。
const LOCATION = {
  lat: 0,
  lng: 0
};
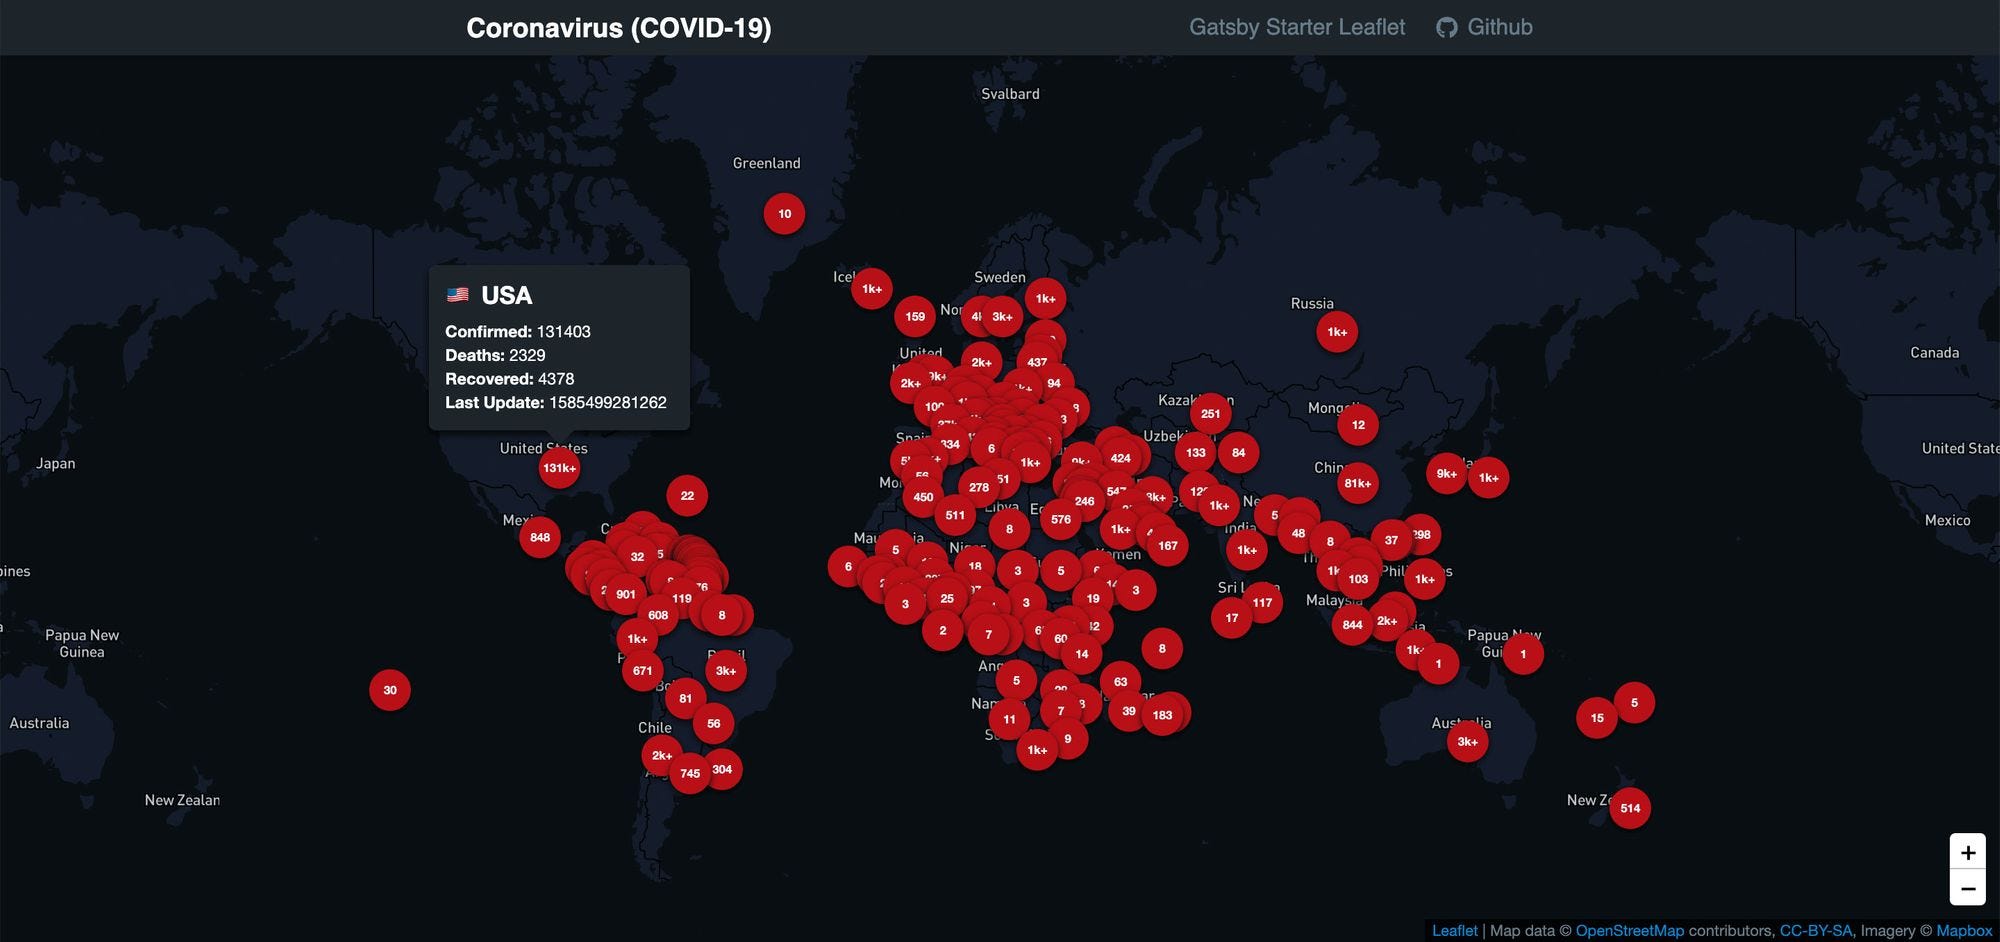
Now let’s see our final app.
现在,让我们看看我们的最终应用程序。
结论 (Conclusion)
I hope you enjoyed a lot and this dashboard gives statistics about the cases around the world. You can also add more styles and functions into this app.
我希望您喜欢这个表,它提供了有关世界各地案件的统计信息。 您还可以在此应用中添加更多样式和功能。
Thanks for reading!
谢谢阅读!
普通英语JavaScript (JavaScript In Plain English)
Enjoyed this article? If so, get more similar content by subscribing to Decoded, our YouTube channel!
喜欢这篇文章吗? 如果是这样,请订阅我们的YouTube频道解码,以获得更多类似的内容!


 510
510

 被折叠的 条评论
为什么被折叠?


