


机器学习 (MACHINE LEARNING)
On this post I’ll focus on supervised problem with continuous valued input. In other words, I’ll trained an algorithm with a dataset compose of known input and output.
在这篇文章中,我将重点介绍带有连续值输入的监督问题。 换句话说,我将训练一个由已知输入和输出组成的数据集的算法。
In this first post dedicated to machine learning I’ll try to predict covid evolution thank to simple linear regression algorithm. The goal is to move forward step by step to well understand how to improve the efficiency of our prédictions.
在第一篇致力于机器学习的文章中,由于简单的线性回归算法,我将尝试预测covid进化。 目标是逐步前进,以更好地了解如何提高我们的决策效率。
选择数据 (Choose the data)
I’ll use data from https://www.data.gouv.fr/fr/datasets/coronavirus-covid19-evolution-par-pays-et-dans-le-monde-maj-quotidienne/
On this website you’ll be able to download files with following data by date and by country:
在此网站上,您可以按日期和国家/地区下载包含以下数据的文件:
- the number of cases 案件数
- the number of death 死亡人数
- the number of healing 治愈的次数
- the death rate 死亡率
- the healing rate 治愈率
- the infection rate 感染率
To begin we’ll try to do a simple linear regression only for one country one this file. Later we’ll try to add some feature form these data and from other sources like average temperature, average salary, etc.
首先,我们将尝试仅对一个文件的国家/地区进行简单的线性回归。 稍后,我们将尝试从这些数据以及其他来源(例如平均温度,平均工资等)中添加一些功能。
进口库 (Import Lib)
Import some libs:
导入一些库:
- Numpy: Basic lib for scientific computing and data science. Numpy:科学计算和数据科学的基本库。
- matplot: Lib to draw some graph matplot:轻松绘制一些图形
- Panda: Load and process input data 熊猫:加载和处理输入数据
- Sklearn: ML lib Sklearn:ML库
- google.colab: Use google drive google.colab:使用Google云端硬盘
- datetime: Date manipulation datetime:日期操作
import numpy as np
import matplotlib.pyplot as plt
import pandas as pd
from google.colab import drive
import datetime
加载并准备数据 (Load and prepare data)
I will use some data files hosted on my google drive. The first step is to mount the folder to be able to retreive files.
我将使用Google驱动器上托管的一些数据文件。 第一步是安装该文件夹以便能够检索文件。
drive.mount('/content/drive', force_remount=True)In this file there are dates. To easly use them I’ll convert these date (String) into timestamp (Number).
在此文件中有日期。 为了轻松使用它们,我将这些日期(字符串)转换为时间戳(数字)。
convertDate = lambda x : datetime.datetime.strptime(x, "%Y-%m-%d").timestamp()Now open your csv thank to read_csv. Fill the four parameters:
现在打开您的csv,感谢read_csv。 填写四个参数:
- the path of your file, here it’s the path in my google doc 文件的路径,这是我的Google文档中的路径
- the CSV delimitator, here is “;” CSV分隔符,这里是“;”
error_bad_lines=False is to avoid to stop the execution in case of bad lines
error_bad_lines = False是为了避免在行错误的情况下停止执行
converters={‘Date’:convertDate} apply your converter on the column Date
converters = {'Date':convertDate}将您的转化器应用于日期列
usecols=[0,1,2,3] allow you to select specific columns. Here I use only the first four.
usecols = [0,1,2,3]允许您选择特定的列。 在这里,我仅使用前四个。
di = pd.read_csv('/content/drive/My Drive/dataML/coronavirus.politologue.com-pays-2020-08-22.csv',";", error_bad_lines=False,converters={'Date':convertDate},usecols=[0,1,2,3])Now the file is almost ready but still remain some problem with the “Pays” column. In fact in this column we have categorical data, not numerical data. For this example we’ll just keep data from France and remove this column.
现在文件已准备就绪,但“付款”列仍存在一些问题。 实际上,在此列中,我们具有分类数据,而不是数字数据。 对于此示例,我们将仅保留来自法国的数据并删除此列。
# Remove all ligne with a value different than "France" in column "Pays"
clean_di = di.drop(di[di.Pays != "France"].index)# Remove the column "Pays"
clean_di = clean_di.drop(axis=1,labels="Pays")
定义线性回归参数 (Define the linear regression parameters)
Now I isolate features (input) in a vector x and output data in a vector y. Moreover I create a variable dataset to represent the global dataset.
现在,我将向量x中的特征(输入)隔离,并将向量y中的数据隔离。 此外,我创建了一个变量数据集来表示全局数据集。
dataset = clean_di;
x = clean_di.iloc[:, clean_di.columns == 'Infections'].values
y = clean_di.iloc[:, clean_di.columns == 'Deces'].values
将数据集分为训练集和测试集 (Splitting the dataset into the Training set and Test set)
from sklearn.model_selection import train_test_splitx_train, x_test, y_train, y_test = train_test_split(x, y, test_size = 1/6, random_state = 0)在训练集上训练简单线性回归模型 (Training the Simple Linear Regression model on the Training set)
from sklearn.linear_model import LinearRegression
regressor = LinearRegression()
regressor.fit(x_train, y_train)
可视化训练集结果 (visualizing the Training set results)
plt.scatter(x_train, y_train, color = ‘red’)
plt.plot(x_train, regressor.predict(x_train), color = ‘blue’)
plt.xlabel(‘Case’)
plt.ylabel(‘Death’)
plt.show()
可视化测试集结果 (Visualising the Test set results)
plt.scatter(x_test, y_test, color = 'red')
plt.plot(x_train, regressor.predict(x_train), color = 'blue')
plt.xlabel('Case')
plt.ylabel('Death')
plt.show()
结论 (Conclusion)
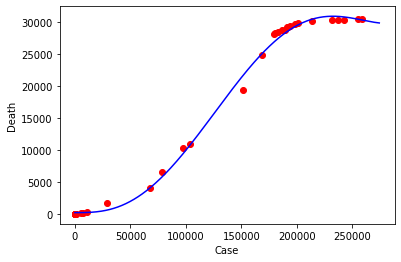
As you can see our prediction seems to be good but the prediction is not good. The Degree of the approximation polynomial function is not sufficient to give us good results.
如您所见,我们的预测似乎不错,但预测并不理想。 逼近多项式函数的度不足以提供良好的结果。
from sklearn.preprocessing import PolynomialFeatures
from sklearn.pipeline import make_pipelinex_seq = np.linspace(x.min(),x.max(),300).reshape(-1,1)
regressorDegree5 = make_pipeline(PolynomialFeatures(5), LinearRegression())
regressorDegree5.fit(x, y)plt.scatter(x_train, y_train, color = 'red')
plt.plot(x_seq, regressorDegree5.predict(x_seq), color = 'blue')
plt.xlabel('Case')
plt.ylabel('Death')
plt.show()plt.scatter(x_test, y_test, color = 'red')
plt.plot(x_seq, regressorDegree5.predict(x_seq), color = 'blue')
plt.xlabel('Case')
plt.ylabel('Death')
plt.show()
资源资源 (Resources)
资料来源 (Sources)
The executable example on Colab.
Colab上的可执行示例。


 4万+
4万+

 被折叠的 条评论
为什么被折叠?
被折叠的 条评论
为什么被折叠?
 到【灌水乐园】发言


